by Greg Harmon
Last week’s review of the macro market indicators suggested, after closing the books on the July options cycle and moving into August that the markets were making new highs but looking a bit overdone. We looked for Gold ($GLD) to continue the bounce in its downtrend while Crude Oil ($USO) continued higher. The US Dollar Index ($UUP) looked lower or might consolidate while US Treasuries ($TLT) were bouncing in their downtrend. The Shanghai Composite ($SSEC) looked weak again and headed lower as Emerging Markets ($EEM) were biased to the downside in their bounce in the downtrend. Volatility ($VIX) looked to remain low and biased lower keeping the bias higher for the equity index ETF’s $SPY, $IWM and $QQQ, despite the moves higher the previous week. Their charts were also biased to the upside in the mid term with the QQQ looking lower in the short term while the SPY and IWM could stand to consolidate their moves.
The week played out with Gold gapping higher and holding while Crude Oil found resistance and tailed back slightly. The US Dollar continued lower as Treasuries returned lower. The Shanghai Composite started lower again while Emerging Markets held steady. Volatility tested support before slowly drifting up but remained subdued. Two of the Equity Index ETF’s peaked with the SPY and IWM making new all-time highs before giving back some ground late in the week while the QQQ took all week to close its gap down from last week. What does this mean for the coming week? Lets look at some charts.
As always you can see details of individual charts and more on my StockTwits feed and on chartly.)
SPY Daily, $SPY 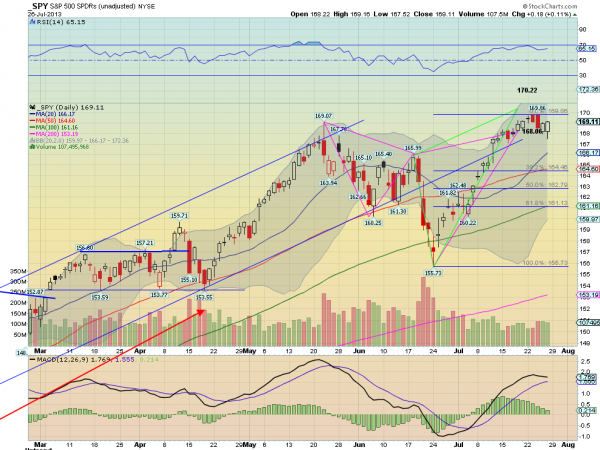
SPY Weekly, $SPY 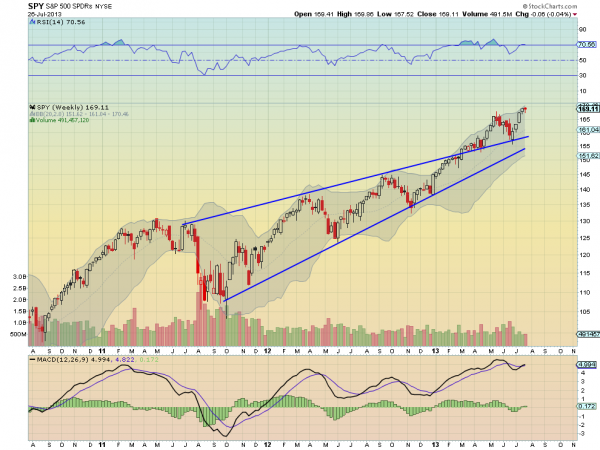
The SPY made a top at 169.86 before pulling back slightly. This eventually triggered the bearish Shark (1) Potential Reversal Zone (PRZ) below 168.06. The Shark (2) PRZ remains at 170.22. The bullish engulfing candle Friday gives hope that this was a quick move lower and it is ready to move up again. The Relative Strength Index (RSI) on the daily chart is moving sideways along the 70 technically overbought level, in bullish territory with a Moving Average Convergence Divergence indicator (MACD) that is flat on the signal line and falling on the histogram. These support more pullback or consolidation. The weekly chart shows a consolidation candle after the Advance Block move higher. The RSI is at the 70 level and the MACD is turning higher. These support more upward price action. There is support lower at 168 and 166 followed by 163. The Initial Price Objective (IPO) of the Shark reversal would be to 164.46 and the second target if through that is to 161.13. Resistance higher comes at 169.86 and then there is a target on a Measured Move to 171.25 and then 175. Consolidation in the Uptrend with a Chance of a Pullback.
As July ends and we move into the dog days of August look for Gold to continue the bounce in the downtrend while Crude Oil consolidates or pulls back in the uptrend. The US Dollar Index looks lower while US Treasuries may consolidate but are biased lower. The Shanghai Composite is biased to the downside but may continue to consolidate while Emerging Markets are biased higher in their downtrend. Volatility looks to remain subdued keeping the bias higher for the equity index ETF’s SPY, IWM and QQQ. The QQQ charts seem all for that while the SPY and IWM suggest there is still some downside risk in the short term. Use this information as you prepare for the coming week and trad’em well.
No comments:
Post a Comment