by Greg Harmon
Last week’s review of the macro market indicators suggested, heading into March the strength that was anticipated to close February did not appear, but weakness did not show up either.
Elsewhere looked for Gold ($GLD) to continue the short term bounce higher while Crude Oil ($USO) churned in the consolidation of the downward move. The US Dollar Index ($UUP) seemed ready to move higher again while US Treasuries ($TLT) were biased higher short term in the pullback. The Shanghai Composite ($ASHR) was on the cusp of another leg higher and Emerging Markets ($EEM) were stalled at resistance but not showing any bias.
Volatility ($VXX) looked to remain subdued and possibly drifting lower keeping the bias higher for the equity index ETF’s $SPY, $IWM and $QQQ. Their charts were not as strong with consolidation or a pullback looking more likely in them, especially the SPY with the IWM next and QQQ strongest, holding level.
The week played out with the Gold bounce lasting a nanosecond before reversing lower while Crude Oil continued in the consolidation range. The US Dollar broke out of consolidation higher while Treasuries broke lower and just kept going. The Shanghai Composite found resistance and pulled back while Emerging Markets followed everything else lower.
Volatility tested last week’s low before rebounding higher. The Equity Index ETF’s started the week drifting with a downward edge, but accelerated after the Non-farm payroll report Friday, closing near the lows. What does this mean for the coming week? Lets look at some charts.
SPY Daily, $SPY 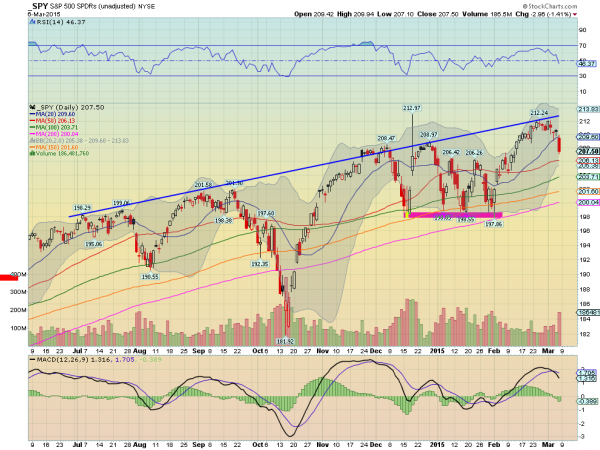
The SPY started the week to the upside, testing the 212 area and in consolidation. But it did not take long for the price to break to the downside. The 20 day SMA acted as support for a couple of days but then Friday saw a big push lower. The range of the long red candle had not been seen for two weeks. It ended the week below the December high but over the January high of the prior consolidation range. The daily chart shows the RSI pulling back along with the price pullback from the rising trend resistance and the MACD crossed down and falling. These all bode for more downside.
On the weekly chart the price moved back into the consolidation zone that started in October. The RSI on this timeframe is falling but bullish and the MACD about to cross down. Also a downside bias. Notice on both timeframes that the Bollinger Bands® are tightening, often a precursor to a bigger move. There is support lower at 206.40 and 204.30 followed by 203 and 202.30 before 200 and 198.60. Resistance higher stands at 209 and 210.25 followed by 212.25. Continued Pullback in the Uptrend.
SPY Weekly, $SPY 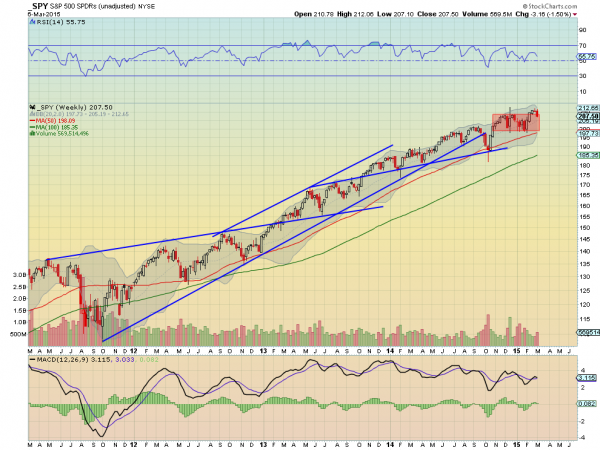
Heading into next week the equity markets look vulnerable. Elsewhere look for Gold to continue lower while Crude Oil churns in a consolidation zone. The US Dollar Index looks to continue higher while US Treasuries continue lower. The Shanghai Composite looks to continue its broad consolidation with a short term downside bias and Emerging Markets are biased to the downside.
Volatility looks to remain low keeping the bias higher for the equity index ETF’s SPY, IWM and QQQ. Their charts look better to the downside though with the SPY the weakest and the IWM and QQQ a bit stronger on the longer timeframe. Use this information as you prepare for the coming week and trad’em well.