Saturday, June 18, 2011

Food prices to stay 'high and volatile' to 2020

by Agrimoney.com

Food prices are to stay "high and volatile" for a decade, international experts said in a report pegging vegetable oil and pork values as set for particular rises, and foreseeing diverging fortunes for European and US farming.
The United Nations food agency, the FAO, and the OECD said that while they were "cautiously optimistic" that farm commodity markets would fall from 2010-11 highs, as farmers ramp up output to capitalise on higher values, prices would not slide to historic levels.
"Agricultural commodity prices… are likely to remain on a higher plateau during the next decade compared to the previous decade," the FAO and OECD said in a joint report.
While demand was being whetted by population growth and rising affluence in developing countries, "there are signs that productivity growth… is slowing", undermined by higher costs to farmers from the likes of oil, as well as "pressures" on land and water.
Wheat vs coarse grains
However, the distribution of price rises will be uneven, with wheat prices falling from average levels in 2008-10 to finish the decade at about $240 a tonne, undermined by a shift upmarket in human eating habits.
"Global consumption [of wheat] on a per capita basis is projected to decline over the next 10 years," while rising overall by some 10% by 2020-21, compared with the average of the past two seasons, the briefing said.
For coarse grains, however, consumption will rise by 18%, lifted by use in making biofuels as well as in feeding livestock, which will be greater demand as consumers in developing countries lift levels of animal protein in diets.
Corn prices will manage some increase from the 2008-10 average to reach $203 a tonne at the end of the decade.
Biodiesel boost
Bigger increases would be seen in prices of vegetable oils, whose use for industrial purposes is seen growing even quicker than that for coarse grains, accounting for 15% of total consumption in 2020, up from 6% at the turn of the century.
In the European Union and Argentina, "biodiesel production will represent an increasing share of vegetable oil use, exceeding 50% and 70% respectively", helping vegetable oil prices rise more than 15%.
All meat types will also enjoy firm price rises, ahead of inflation, with pigmeat seen gaining the most – depending on dynamics China, which is responsible for half the world's consumption.
"Due to its extraordinary volumes both in terms of production and consumption, unforeseen events in China which could result in import surges of pigmeat have the potential to severely impact international markets," the briefing said.
Europe lags
The FAO and OECD saw a strong role for Eastern Europe and Latin America in driving growth in agricultural production, with Asia set to lift meat output.
But among developed regions, only North America would see significant growth in farm output, thanks to "highly mechanised, capital and input intensive agricultural industries [that] will grow mainly from intensification and efficiency gains".
Europe's output would be limited by environmental concerns, limited land availability and a forecast of strong currencies, making exports less competitive.
"Agricultural sectors of the main Western European producers [will remain] roughly at their current levels, barely higher than peak production in 2008," the report said.
Production growth in crop and livestock will increasingly come from efficiency gains" encouraged by reforms including the shake up of the region's Common Agricultural Policy.

See the original article >>

Slippery slope ahead for Crude Oil?

by Kimble Charting Solutions


Resistance Dollar ...

by Kimble Charting Solutions


Chinese Market Breaks Down

by Bespoke Investment Group

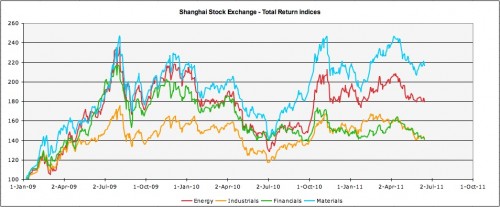
Like the US and the rest of the world, China's equity market has performed horribly over the last month and a half. Today, the Chinese stock market really took a hit when the widely followed Shanghai Composite broke below key support to trade at a fresh 2011 low. The six-month price chart of the Shanghai Composite shown below looks pretty awful right about now.


S&P 500 Net New Highs

by Bespoke Investment Group

In Friday's trading, there were three S&P 500 stocks that hit new 52-week highs (CL, DGX, and TDC) and only one stock that traded to a new 52-week low (WFR). This ended a nine trading day streak where more stocks hit new lows than new highs. Since the bull market began in March 2009, there has only been one other period where new lows exceeded new highs for nine trading days (8/19 - 8/31). So at this point at least it hasn't gotten worse than last Summer.


See the original article >>

Crude Oil Price Downward Pressure


Frankly, there are so many cross-currents influencing the markets at any given time, uncertainty clearly has the upper hand -- even when we think that new information or decisions are alleviating some of the uncertainty.

Case in point: crude oil prices. Is downward pressure positive for equities (for obvious reasons: i.e., the consumer gets a "tax cut"), or negative because it might reflect a serious slow down in U.S. and global economic growth (read: China demand)?

I don't know the answer, but I am leaning towards the latter scenario right now.
Looking at the nearby NYMEX crude oil futures chart we see that prices continue to follow their technical script, which called for a breakdown from the four-week coil pattern towards an optimal target zone of 90.00-88.00.

So far, the plunge from the coil has hit a confirmed low of 92.12 earlier this morning. Barring a sustained climb above 97.25, my pattern and momentum work will continue to point to 90.00-88.00.

Whether or not downward pressure on NYMEX oil (and to a lesser extent Brent) will translate into headwinds for Exxon (XOM), Schlumberger (SLB), ConocoPhillips (COP), Halliburton (HAL), Chevron (CVX) and the ProShares UltraShort Oil & Gas ETF (DUG) remains to be seen.

That said, with the possible exception of CVX, all of the above-mentioned energy names exhibit very toppy intermediate-term chart patterns.


See the original article >>

The Turning Point

by Tyler Durden

Submitted by Charles Hugh Smith from Of Two Minds

The Turning Point

Some technical analysts are calling for a major rally from here, but the massive injections of financial insulin don't seem to be reviving the sagging global economy.

The stock market and economy are both at a turning point. Analyst Martin Armstrong's Economic Confidence Model (tm) set the turn date as June 13/14, 2011.

In the stock market, a number of technical analysts are issuing strong buys based on the negative sentiment of so-called "dumb money"--small investors--and the number of stocks below their 50-day moving averages.

Others such as Armstrong are predicting that Greece has no alternative to default and the Euro is untenable as "one size does not fit all."

It is rare to find a market where the technical evidence is so compelling for a strong rally yet the fundamental basis for such a rally so lacking. Exactly where do Bulls think the growth and rising profits are going to come from?

The answer for the past few years has been massive Federal Reserve/Federal intervention and stimulus, and a weakening U.S. dollar that boosted overseas profits via the legerdemaine of currency devaluation.

But three years of these policies have accomplished nothing but load the taxpayer with staggering amounts of debt: none of the causes of the 2008 implosion have been fixed or even addressed. As Armstrong notes, the massive interventions did not shorten the crisis, they have prolonged it.

This reality has filtered down to the political swamp, and now the politicos are hesitant to bet their own futures on additional trillions in stimulus and quantitative easing. For the first time in memory, the Federal Reserve is on the defensive. Simply put, its policies have failed to accomplish anything except prop up a rotten, insolvent banking sector that needs to be declared bankrupt and swept into the dustbin of history.

As I have noted here before, the next round of QE (quantitative easing) will fail to inflate the stock market regardless of its size or tricks. The fact that QE3 is needed will spook everyone who understands that it is a last-ditch effort to keep the Status Quo financialization from imploding, and since QE2's sugar-high was so brief, others will be spooked by the possibility that the next high will be even shorter.

This is the dreaded Diabetes Financial Syndrome--the Fed is pouring ever larger amounts of financial insulin into the system, but the financial "body" no longer responds to this insulin. The financial system then goes into toxic shock and implodes.

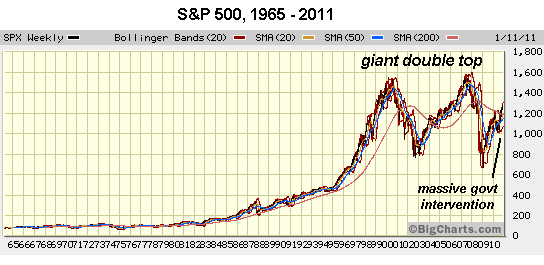
Let's look at two charts for context. Here is the S&P 500 from 1965 to 2011. Hmm, are there any aberrations visible here, any gigantic spikes of speculative frenzy? Just because these spikes of speculative, financialized frenzy have been normalized doesn't mean they are no longer speculative, financialized frenzies.

Has the economy really been healed? If not, then what is the basis of the market's spectacular rebound since 2009? We all know the answer: $6 trillion in Federal financial insulin and another $2 trillion in Federal Reserve insulin. The entire rally, in other words, is an artifact of Central bank/State intervention.

Courtesy of dshort.com, here is an inflation-adjusted chart of the S&P 500. This chart clearly illustrates that unprecedented Central State stimulus and intervention/manipulation have juiced the market higher than previous post-crash highs.

But the whole financial-insulin project is looking a bit long in tooth compared to previous post-crash markets. In the long run, perhaps we can attribute this extension of the euphoric high of "recovery" to the Fed's QE2, which pumped half a trillion dollars into stocks in a matter of months.

Short of the Fed simply buying trillions of dollars in stocks outright, then it looks like this "recovery" rally is about to have a Wiley E. Coyote moment, as it has raced off the solid ground provided by the Fed's QE2 injections and is now poised in thin air.

Of course the market could rally from here, but it's hard to see on what basis other than a technical dead-cat bounce. The Fed could announce another round of intervention, and that would certainly give the comatose body a jolt. But for how long?

If it does respond to gravity, then we might want to re-visit the definition of "dumb money:" small investors have been pulling money out of the stock market all during the QE2 insulin-rush rally while the "smart money" has been piling in, blubbering piously about the key tenet of their religious faith, "don't fight the Fed."

So which do you think is all-powerful, smart money--the Fed or gravity? We're about to find out.


It has not been Jim Caron's decade. The Morgan Stanley rates strategist, riding on the coattails of the always wrong Morgan Stanley economics team led by David Greenlaw, has been wrong in his annual rates call year after year after year. Which is unfortunate because while unable to see the forest for the trees, Caron does have a better grasp of rates than most other Wall Street penguins. That said, just like everyone else in the status quo, Caron has just come out with another short duration call (i.e. sell bonds), probably the 6th time in a row he has done that in the past 3 years. Perhaps 7th time will be the charm. Amusingly, Caron, terrified to be seen in the same camp as Bill Gross who is short bonds on fears that there will be nobody available to step in an buy the 80% of gross issuance that has been monetized by the Fed to date, make this very loud caveat on his short bond call: "To be sure, our shift toward short from neutral duration has nothing to do with the end of QE2 and related concerns that there will be a lack of demand to buy US Treasuries once the Fed stops buying them. As we have stated many times in the past, the outlook for the economy will be the main driver of yields, not the end of QE2." No, instead Caron believes that the sell off in bonds will be due to the same bullish economic growth call that he has been predicting over... and over... and over... and over... etc. More interesting is how he suggests the trade is implemented: in MS' view the best way to be bearish on rates is with a DV01 neutral 7s-10s flattener: "we continue to recommend being short 5s on the 2s5s10s fly. In line with the butterfly, and in order to express a more robust short duration position, we recommend a curve flattener on the UST 7s10s curve: · Sell $133.7mm OTR 7y Notes; · Buy $100mm OTR 10y Notes." Perhaps those who want to be short bonds, but for the right reason, that predicted by Zero Hedge and then Bill Gross, this may be one of the better ways to put the trade on.
More below:
Reducing Duration Exposure from Neutral Toward Underweight

We are reducing duration exposure from neutral toward underweight. The reason is that the market has already well discounted 2H growth to levels much lower than consensus. As we see it, the risk now is for the market to price 2H11 growth higher. We will start out cautiously by expressing this negative view via underweighting the belly of the curve versus the wings rather than positioning outright short. The risk to our view is if the European debt crisis worsens, but our base calls for a temporary reprieve as Greece receives a new aid package. This is a tactical view and we believe the location is good to establish a negative UST bias, given how rich the belly of the curve has gotten and since our models indicate 2.85% is the lower bound of fair-value for UST 10y. Medium term, we believe 10y yields will remain range-bound. Let us explain:

1. The belly of the curve has richened to levels that is consistent with a 2.65% growth outlook over the next six months While we feel it is appropriate for the market to discount the risk of a downgrade to the 3.35% consensus growth expectations in 2H11, we believe that discounting it to 2.65% or lower is too much (growth estimates come from Blue Chip Consensus).

2. Our economics team believes that we will have a rebound in 2H11 led by the auto sector that may contribute as much as 1.5% to growth in 3Q11 (see Exhibit 1, LHS) and possibly as much as 0.5% to 4Q11 growth. Also, consistent with their growth outlook, they see core inflation continuing to rise with headline CPI forecasted to be 3.4% and core at 1.9% by the end of 2011 (see Exhibit 1, RHS). However, this view hinges upon the US economy’s ability to produce at least 150K jobs per month − a key threshold.

3. Over the next several weeks, event risks will come to pass and we expect clarity from the end of QE2, the debt ceiling and Dodd-Frank. We believe that this will reduce uncertainty and the safe-haven bid for bonds. Our macro team believes that the recent soft patch is nothing more than a mid-cycle slowdown and that risky assets may perform starting in 2H11 (see Global Debates Playbook, June 16, 2011).


To be sure, our shift toward short from neutral duration has nothing to do with the end of QE2 and related concerns that there will be a lack of demand to buy US Treasuries once the Fed stops buying them. As we have stated many times in the past, the outlook for the economy will be the main driver of yields, not the end of QE2. Also, we think that an agreement will be made on the debt-ceiling debate between the Democrats and Republicans some time in July before the August 2 social security payment deadline. And as for Dodd-Frank, which is scheduled to start imposing new regulations on the market as early as July 16, we believe that much of it may be postponed until later this year and possibly into 2012 due to the lack of clarity around many of the intended regulations.

Following the money. As the market is priced for slower growth over the past several weeks, we have seen inflows into bond funds rise sharply while risky assets saw outflows (see Exhibit 2). For the month of May, bond funds saw the largest monthly inflows in seven months totaling $20.2 billion while equity funds saw outflows of $2 billion as compared to inflows in April of $5.3 billion (first month of outflows after six consecutive months of inflows). Also, according to surveys we follow, the decline in rates has caused many to reduce their short positions. Thus the combination of money flows and duration surveys we track indicate that the short bond exposure in the market has been reduced which technically puts less pressure on rates to stay low and instead clears a path for them to rise.

Duration risk cuts both ways. When growth expectations for 2011 were being downgraded, longer-duration bonds performed best. This was most notable in TIPS as real yields significantly dropped. The drop in real yields was so dramatic that the year-to-date performance of TIPS even exceeds that of high yield. What has changed? Long-duration exposure presents a greater risk and may become a source for underperformance rather than outperformance going forward, especially if 2H11 growth rebounds as market consensus suggests it might.

Conclusion. Our tactical shift from neutral to short duration has several implications: 1) we expect real yields to begin a steady rise higher, and 2) we expect the belly of the curve to underperform and the 10s30s curve to flatten.
And the best way to express a bearish stance in the rates complex according to Caron:
Since April, the belly of the curve has richened significantly as rates have marched lower (Exhibit 1). We continue to recommend being short the belly vs. the wings, as previously discussed short 5s on the 2s5s10s fly (see “Fade the Recent Outperformance of the Belly,” US Interest Rate Strategist, June 9, 2011). In line with the butterfly, and in order to express a more robust short duration position, we recommend a curve flattener on the UST 7s10s curve:

· Sell $133.7mm OTR 7y Notes

· Buy $100mm OTR 10y Notes

Both the 7s10s curve flattener and the butterfly allow the investor to play for a reversion in the richness of the belly. Rather than going outright short we suggest initiating these relative value trades, which capture some duration exposure and some relative value exposure between different points on the curve.

We argue that growth expectations have not been downgraded to the extent that rates in the 5-10y sector have fallen with survey consensus at 3.35% for 2H11. In our view, the rates market is pricing levels of US growth that are inconsistent with surveyed forecasts (see “Reducing Duration Exposure from Neutral to Underweight” in this publication).

This past week, price action in the market has reflected uncertainty as, for example, the 7y point increased 12bp on Tuesday only to decrease by 14bp on Wednesday returning to similar levels. We expect the market to remain range-bound in the near term; however, we see fair value of the 10y note at about 3.10% with a 25bp standard deviation (Exhibit 2). With the 10y dipping to the low 2.90’s, we see an opportunity to fade this extreme.


UST 7s10s Flattener

As we have shifted from neutral duration to tactically short, we seek relative value trades that would perform if yields in the belly increased. We believe a UST 7s10s flattener is one of the best trades that fit this description for the following three reasons:

1) Historically steep curve. We have been in a steep yield curve environment for some time now, but with the recent move lower in yield in the belly, curves such as 5s10s and 7s10s have increased once again and now are nearing the all-time highs reached in November of last year (Exhibit 3). We do not think that the low yields around the 7y point are warranted due to growth expectations higher than they were 8 months ago, and hence we look for this curve to flatten.

2) Beneficial roll and carry characteristics. The 5s10s curve historically has more variance than 7s10s, however both curves have increased approximately the same amount over the last several weeks (Exhibit 4). Additionally, the carry on the 7s10s flattener is -2.0bp per 3m, while it is -4.5bp per 3m on 5s10s. If we divide this carry by the 3m realized volatility of each respective curve, we obtain a carry quotient of -0.24 and -0.36 for the 7s10s and 5s10s flatteners, respectively.

The carry quotient gives us a risk-adjusted level of carry on each curve and shows us that the 7s10s absolute carry of -2.0bp is also better than the 5s10s negative carry on a risk-adjusted basis.

3) Correlation that favors a sell-off in the belly. Our premise is that we are not only fading an extreme curve level, but also gaining exposure to a sell-off in the 7y sector. Recently, that is exactly how this curve has been trading

7s10s has been fairly well correlated with rates since about January, 2010. Starting in October, 2010, this correlation increased, and the beta, or slope of the regression increased as well. Since October, 2010, the 7s10s curve has been flattening/(steepening) approximately 13bp for every 1bp increase/(decrease) in the 7y yield.

The risk to this trade is that the 7y yield decreases relative to the 10y yield. As the trade involves a short position at the 7y point, losses are potentially unlimited.

See the original article >>

Moody's Puts Italy's Aa2 Rating On Downgrade Review, EUR Slides, And A Bonus Report From SocGen: "How Vulnerable Is Italy?"


Trust Moody's to come up with the Friday afternoon bomb. EURUSD slides on the news, which sends the 100% correlated stocks plunging.


Full text from Moody's:
Frankfurt am Main, June 17, 2011 -- Moody's Investors Service has today placed Italy's Aa2 local and foreign currency government bond ratings on review for possible downgrade, while affirming its short-term ratings at Prime-1. 

The main drivers that prompted the rating review are: 

(1) Economic growth challenges due to macroeconomic structural weaknesses and a likely rise in interest rates over time;
(2) Implementation risks surrounding the fiscal consolidation plans that are required to reduce Italy's stock of debt and keep it at affordable levels; and
(3) Risks posed by changing funding conditions for European sovereigns with high levels of debt. 

Moody's review will evaluate the weight of these growing risks in light of the country's high rating but also relative to some credit-strengthening trends that have been observed in recent years and are expected over the coming years, such as improved fiscal governance, lower budget deficits and a modest economic recovery. 

RATIONALE FOR REVIEW 

First, the Italian economy faces growth challenges in an environment characterized by long-term structural impediments to growth and potentially rising interest rates. Structural economic weaknesses -- mainly low productivity and important labour and product market rigidities -- have been a major impediment to growth in the last decade and continue to hinder the economy's recovery from the severe recession it experienced in 2009. Italy has so far only recovered a fraction of the nearly seven percentage points in GDP that it lost during the global crisis, despite low interest rates, which are likely to rise in the medium term. Growth prospects for the Italian economy in the coming years will be a crucial factor that will determine the government's revenues and the achievement of fiscal consolidation targets. 

Second, there are implementation risks to the fiscal consolidation plans that are required to reduce Italy's stock of public debt to more affordable levels. Against a backdrop of rising interest rates and weak economic growth, the government may find it difficult to generate the primary surpluses that are needed to place the public debt-to-GDP ratio and the interest burden on a solid downward trend. The adoption of additional conservative fiscal policies may prove more difficult in the near future because the current government's electoral support is weakening, with the government facing challenges in gaining public approval for its policies. For example, the government's recent energy and water supply proposals were rejected by popular vote. 

Third, the fragile market sentiment that continues to surround European sovereigns with high levels of debt poses additional risks for Italy. The continued stability of market demand for Italy's debt is uncertain at current yields. Although future policy actions within the euro area could reduce investors' concerns and stabilize funding costs, the opposite is also possible. In any event, going forward, investors appear likely to differentiate more among euro area sovereign borrowers than they did prior to the financial crisis, to the disadvantage of euro area countries with higher-than-average debt burdens, like Italy. 

FOCUS OF RATINGS REVIEW 

Moody's review of Italy's sovereign rating will focus on the growth prospects for the Italian economy in coming years, and particularly the prospects for a removal of important structural bottlenecks that could hinder a stronger economic recovery in the medium term. The review will also examine the government's ability to achieve ambitious fiscal consolidation targets and to implement further plans to generate substantial primary surpluses in the medium term. This will include an analysis of the vulnerability of the Italian government debt trajectory to a rise in risk premia, as well as the options for the government to react. The government's new fiscal plan, which is expected to be announced shortly, will be considered during the review. 

In addition, any broader developments across the euro area, in particular with regard to the resolution of the euro area debt crisis and its impact on funding costs, could be important determinants of the outcome of Moody's rating review

PREVIOUS RATING ACTION AND METHODOLOGY

Moody's last rating action affecting Italy was implemented on 15 May 2002, when the rating agency upgraded Italy's Aa3 government bond ratings to Aa2 with a stable outlook. The rating action prior to that was taken on 3 July 1996, when the rating agency upgraded Italy's A1 government bond ratings to Aa3.

5 CHARTS OF CHINA’S GROWTH CONUNDRUM

By Rohan Clarke

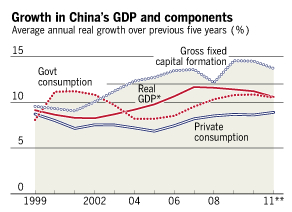
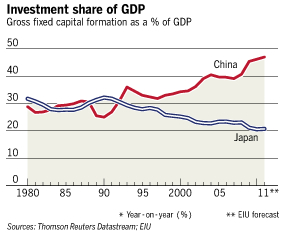
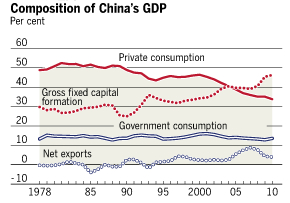
When you think about it, the imminent spike in mining related investment and its impact on Australian GDP is a pretty fair reflection of what has been going on in China for some time. Martin Wolf recently opined on the sustainability of China’s GDP growth without the government sanctioned infrastructure binge (here). It’s the Jim Chanos view of the world, ease off the building and things don’t just slow, they go into reverse pretty quickly. The following charts hint at what’s at stake:

1) The importance of infrastructure investment (Gross fixed capital formation) in driving China’s GDP growth over the last decade is self-evident:
2) And even more simply stated as a proportion of GDP:
3) So it is clear just how difficult is the task is to migrate the driver of GDP growth from investment to consumption.
4) Still that is why China is forecasting GDP growth closer to 7% for the next 5 years – it’ll be weaning the economy off the debt financed infrastructure spend ever so gradually:
5) But the risk is that the problems have already been conceived – China’s financial system is pregnant with debt that has financed investments that will prove uneconomic if the rate of GDP growth (and the attendant asset price inflation) slows.
Looked at from this perspective, it has remarkable similarities to the debt overhang that persists in the developed world – and the resulting underperformance of financial equities from New York to London and beyond.

See the original article >>

THE VIX RATE OF CHANGE IS MORE IMPORTANT THAN ITS LEVEL

By Tom McLellan


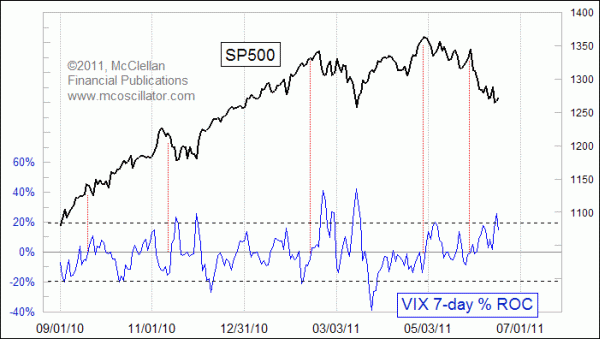
Back in February 2010, I introduced Chart In Focus readers to the 7-day rate of change (ROC) for the VIX. It is a fun little indicator, and offers us a nice simple way to see the VIX in a different form than just looking at what the raw values say.

The math is very simple: We just compare the VIX today with the VIX of 7 trading days ago, and find the percentage difference between those two numbers. It ignores all of the values between, which might seem like we are unnecessarily ignoring important data. But the result does a couple of magical things which make it worth looking at.

The first magical indication is that any reading above around +20% is a pretty good sign of an oversold bottom for stock prices, one that is worthy of a bounce. It does not seem to work the same way when we look at extreme negative readings for this indicator. Remember that the VIX is a fear indicator, and so the sudden development of fear which produces a high reading on the 7ROC is not the same phenomenon as a sudden abandonment of fear. Deeply negative readings for this indicator are usually seen at the kickoff of a strong up move, and not at the end of one.

The other magical insight that this indicator gives us occurs when it passes upward through zero. An upward crossing through zero often (but not always) marks an important top for stock prices. These seem to be better top signals when the upward crossing through zero occurs after a longer period below zero. The red vertical lines highlight some good examples of this sort of indication.

The stock market selloff during May and June 2011 unfolded without any big spikes upward in the VIX, which was confusing for a lot of people. If the market was in a downtrend (they wondered), why was the VIX staying so low? We now have the answer, with the sudden jump upward in the 7ROC indicator to a high of 25.8% on June 16. Fear reaches a climax at the end of a decline, not in the middle of one.


Two weeks ago, I showed a comparison of the chart pattern of the big silver price top in 1980 versus the current structure. Despite so many differences in the economy of 1980 versus now, there was a surprisingly strong pattern correlation in the price behavior.

I recently updated that relationship for readers of our Daily Edition. The June 16 issue of that subscription publication also showed what the same comparison looks like for gold prices, with some really interesting conclusions. Hint: the correlation is still working, for the moment anyway.

We are now offering a free 2-week trial for new subscribers of our Daily Edition. If you have been thinking about signing up for our Daily Edition, now would be a good time to give it a try, and get to see how that 1980 pattern comparison is continuing to develop, plus get our other real-time insights about stocks, bonds, and gold.

See the original article >>

Inflation Or Deflation? Follow the Money Supply


Debate continues to rage between the inflationists who say the money supply is increasing, dangerously devaluing the currency, and the deflationists who say we need more money in the economy to stimulate productivity. The debate is not just an academic one, since the Fed’s monetary policy turns on it and so does Congressional budget policy.

Inflation fears have been fueled ever since 2009, when the Fed began its policy of “quantitative easing” (effectively “money printing”). The inflationists point to commodity prices that have shot up. The deflationists, in turn, point to the housing market, which has collapsed and taken prices down with it. Prices of consumer products other than food and fuel are also down. Wages have remained stagnant, so higher food and gas prices mean people have less money to spend on consumer goods. 

The bubble in commodities, say the deflationists, has been triggered by the fear of inflation. Commodities are considered a safe haven, attracting a flood of “hot money” — investment money racing from one hot investment to another.

To resolve this debate, we need the actual money supply figures. Unfortunately, the Fed quit reporting M3, the largest measure of the money supply, in 2006.

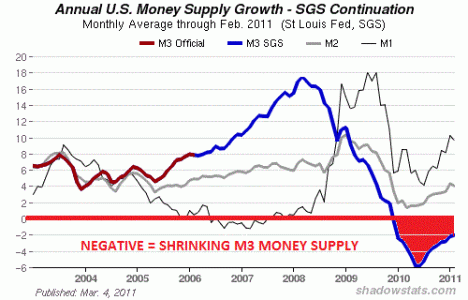
Fortunately, figures are still available for the individual components of M3. Here is a graph that is worth a thousand words. It comes from ShadowStats.com (Shadow Government Statistics or SGS) and is reconstructed from the available data on those components. The red line is growth in the M3 money supply as reported by the Fed until 2006. The blue line is the growth in M3 after 2006.
 economy
The chart shows that the overall U.S. money supply is shrinking, despite the Fed’s determination to inflate it with quantitative easing. Like Japan, which has been doing quantitative easing (QE) for a decade, the U.S. is still fighting deflation.

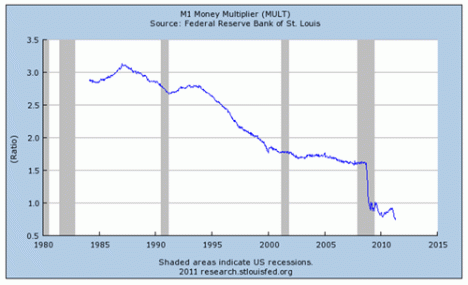
Here is another telling chart – the M1 Money Multiplier from the Federal Reserve Bank of St. Louis:
 economy
Barry Ritholtz comments, “All that heavy breathing about the flood of liquidity that was going to pour into the system. Hyper-inflation! Except not so much, apparently.” He quotes David Rosenberg: “Fully 100% of both QEs by the Fed merely was new money printing that ended up sitting idly on commercial bank balance sheets. Money velocity and money multiplier are stagnant at best.” 

If QE1 and QE2 are sitting in bank reserve accounts, they’re not driving up the price of gold, silver, oil and food; and they’re not being multiplied into loans, which are still contracting. 

The part of M3 that collapsed in 2008 was the “shadow banking system,” including money market funds and repos. This is the non-bank system in which large institutional investors that have substantially more to deposit than $250,000 (the FDIC insurance limit) park their money overnight. Economist Gary Gorton explains:
[T]he financial crisis . . . [was] due to a banking panic in which institutional investors and firms refused to renew sale and repurchase agreements (repo) – short?term, collateralized, agreements that the Fed rightly used to count as money. Collateral for repo was, to a large extent, securitized bonds. Firms were forced to sell assets as a result of the banking panic, reducing bond prices and creating losses.
There is nothing mysterious or irrational about the panic. There were genuine fears about the locations of subprime risk concentrations among counterparties. This banking system (the “shadow” or “parallel” banking system) ?? repo based on securitization ?? is a genuine banking system, as large as the traditional, regulated banking system. It is of critical importance to the economy because it is the funding basis for the traditional banking system. Without it, traditional banks will not lend, and credit, which is essential for job creation, will not be created.”
Before the banking crisis, the shadow banking system composed about half the money supply; and it still hasn’t been restored. Without the shadow banking system to fund bank loans, banks will not lend; and without credit, there is insufficient money to fund businesses, buy products, or pay salaries or taxes. Neither raising taxes nor slashing services will fix the problem. It needs to be addressed at its source, which means getting more credit (or debt) flowing in the local economy.

When private debt falls off, public debt must increase to fill the void. Public debt is not the same as household debt, which debtors must pay off or face bankruptcy. The U.S. federal debt has not been paid off since 1835. Indeed, it has grown continuously since then, and the economy has grown and flourished along with it.
As explained in an earlier article, the public debt is the people’s money. The government pays for goods and services by writing a check on the national bank account. Whether this payment is called a “bond” or a “dollar,” it is simply a debit against the credit of the nation. As Thomas Edison said in the 1920s:

If our nation can issue a dollar bond, it can issue a dollar bill. The element that makes the bond good, makes the bill good, also. The difference between the bond and the bill is the bond lets money brokers collect twice the amount of the bond and an additional 20%, whereas the currency pays nobody but those who contribute directly in some useful way. . . . It is absurd to say our country can issue $30 million in bonds and not $30 million in currency. Both are promises to pay, but one promise fattens the usurers and the other helps the people.

That is true, but Congress no longer seems to have the option of issuing dollars, a privilege it has delegated to the Federal Reserve. Congress can, however, issue debt, which as Edison says amounts to the same thing. A bond can be cashed in quickly at face value. A bond is money, just as a dollar is.

An accumulating public debt owed to the IMF or to foreign banks is to be avoided, but compounding interest charges can be eliminated by financing state and federal deficits through state- and federally-owned banks.
Since the government would own the bank, the debt would effectively be interest-free. More important, it would be free of the demands of private creditors, including austerity measures and privatization of public assets.

Far from inflation being the problem, the money supply has shrunk and we are in a deflationary bind. The money supply needs to be pumped back up to generate jobs and productivity; and in the system we have today, that is done by issuing bonds, or debt.

See the original article >>

The Danger Isn’t Greece, It’s Everyone Else

By Kathleen Madigan

Will this Greek drama go out on a global tour?

That’s the fear as officials in Athens scramble to work out an austerity plan to avoid defaulting on the nation’s sovereign debt while some Greek voters riot in the streets.

Some market watchers worry Greece 2011 could be a replay of Lehman 2008 when it comes to market performance and economic growth. Greece defaults, markets tank, and the global economy spins into severe recession.

In the “Greece as Lehman redux” scenario, a default would force lenders, especially European banks, to write down billions in Greek loans. The losses would reduce bank capital and trigger a global credit crunch. That’s why rating agencies have put European banks under review for possible downgrade.

Certainly, there are reasons to worry that Greece’s problems could be the last straw for the recovery, especially because a default could bring the unanticipated. And recent data show the U.S. economy has throttled back significantly in the second quarter.

The biggest risk, however, isn’t Greece per se. It is the prospect of other peripheral euro members — Ireland, Spain, and Portugal — following Greece down the default path. That cascade effect has to be avoided.

The U.S. and global economies are in better shape than they were in 2008. If time heals all wounds, three years have gone a long way in healing economic excesses and the world banking system.

To be sure, sentiment can change on a dime, but for now, the banking system seems to be taking Greece in stride.

Interbank rates remain extremely low. The three-month London interbank lending rate is creeping along below 0.25%. When the financial crisis hit in 2008, it soared above 4%.

Back then, almost all U.S. banks tightened standards on commercial loans — basically shutting off bank lending. At the same time, the commercial paper market froze, leaving businesses no access to cash to meet payrolls or maintain inventories.

Now, the latest Federal Reserve senior loan officer survey shows more bank are easing lending standards than are tightening them. And commercial paper outstanding is expanding so far this year.

Perhaps another key reason to expect the recovery to survive is the long build-up to a possible default. The global credit authorities and financial markets have been digesting this problem for more than a year. Some participants think a default is inevitable; Greece should just do it.

Then the world can move on to an even bigger worry: whether the U.S. government will soon default on its debt.

IMF Sees Risks to Global Economy Mounting

By Sudeep Reddy

The International Monetary Fund released its latest global economic forecast Friday, cataloging risks that have piled up in the world economy over just the past two months.

The IMF says it still expects global growth of 4.3% this year, down slightly from the 4.4% estimate offered in April in what it called a “mild slowdown of the global expansion.” Among advanced economies, the U.S. is seen growing at 2.5% (slower than the prior 2.8% estimate) while Japan is expected to contract 0.7% (instead of 1.4% growth).

In the update to the World Economic Outlook, the IMF’s economists said greater-than-expected weakness in U.S. activity and renewed financial volatility from the euro zone’s fiscal troubles “pose greater downside risks” to the world economy. They also cited more risks from “persistent fiscal and financial sector imbalances in many advanced economies” along with signs of overheating in emerging and developing economies, which are maintaining their strong growth prospects.

“Strong adjustments — credible and balanced fiscal consolidation and financial sector repair and reform in many advanced economies, and prompter macroeconomic policy tightening and demand rebalancing in many emerging and developing economies — are critical for securing growth and job creation over the medium term,” the fund said.

That’s not all. In its latest update for its Global Financial Stability Report, the fund said financial risks have risen worldwide for three (somewhat similar) reasons:

* While a multispeed global recovery remains the base case, downside risks to this baseline have increased.
* Concern about debt sustainability and support for adjustment efforts in Europe’s periphery is leading to market pressures and worries about potential contagion. Political risks are also raising questions about medium term fiscal adjustment in a few advanced countries, notably, the United States and Japan.
* Notwithstanding some recent pullback in risk appetite, the prolonged period of low interest rates may push investors into riskier assets in a “search for yield.” This trend has the potential to build financial imbalances for the future, particularly in some emerging markets.

The IMF said policymakers need to accelerate actions to address the long-standing risks, warning that “the room for maneuver to counter shocks has been reduced.”

“Although there has been progress, improvements in financial system robustness have been insufficient so far,” the update said. “Markets may lose patience and become disorderly if political developments derail momentum on fiscal consolidation and financial repair and reform.”

Could the Eurozone Break Up?

By John Mauldin


Could the Eurozone Break Up?
The EMU Has Always Fallen Short…
Surely a Break-Up Remains Inconceivable?
Has it Really Come to This?
Kiev, Geneva and London


Is it possible for the Eurozone to break up? It was so inconceivable when they formed it that there is nothing in the treaty that mentions a member leaving or being removed; but now, if we’re to be honest with ourselves, we need to think about how that would work. This Friday finds me in Kiev for the first time ever, with my youngest son, Trey; and the small tour we went on last night was fascinating. Since I know not if I will ever get to this fascinating city again, I am going to write a briefer missive than usual, and it will center on my thoughts on Europe, as I have just had the pleasure of the company of a number of very diverse people, talking about the issues. Nouriel Roubini has graciously agreed to allow me use his latest private piece (very powerful analysis here), where he analyzes the question of whether the Eurozone could actually break up, so you will get the usual solid content (OK, maybe a little better), with my notes at the end. And I’ll close with some thoughts on Kiev.

But first, a quick fix. In last week’s fascinating Outside the Box by Pat Cox on the state of stem cell technology, which you really should read, there was a link to Lifeline Skin Care cream that was faulty. It should have been http://www.lifelineskincare.com.


Could the Eurozone Break Up? Possible Over a Five-Year Horizon

By Nouriel Roubini

The current “muddle through” approach to the eurozone (EZ) crisis is not a stable disequilibrium; rather, it is an unstable disequilibrium. Either the member states move from this disequilibrium toward a broader fiscal, economic and political union that resolves the fundamental problems of divergence (both economic, fiscal and in terms of competitiveness) within the union…

…or the system will move first toward disorderly debt workouts and eventually even break-up, with weaker members departing. Over a five-year horizon, the odds of a break-up are at least one-third.


The EMU Has Always Fallen Short…

The EMU has never fully satisfied the conditions for an optimal currency area: Synchronized economic activity and growth rates; a high level of labor and capital mobility; fiscal federalism allowing the fiscal risk sharing of idiosyncratic national shocks; and a significant degree of political union.

The hope was that the EMU’s lack of independent monetary, fiscal (the Growth and Stability Pact fiscal constraints) and exchange rate policies would lead to the acceleration of structural reforms that would in turn lead to the convergence of productivity and growth rates, rather than increased divergence.

The reality turned out to be different… Paradoxically, the early interest rate convergence became damaging as it allowed a severe lack of fiscal discipline in some countries (such as Greece and Portugal) and the build-up of asset bubbles in others (such as Spain and Ireland). Moreover the lack of market discipline delayed the necessary structural reforms and led to divergences in wage growth relative to productivity growth, and thus a rise in unit labor costs in the periphery and a loss of competitiveness that led to economic divergence between the PIIGS and the core. And the straightjacket of common monetary and currency policy exacerbated the real growth divergence at a time when structural and fiscal policies diverged.

Figure 1: Divergent Unit Labor Costs (ULCs, relative to EZ average, 1998 = 100)

Note: ULCs are computed as the ratio between compensation per employee and real GDP per employed person. Source: European Commission

Any successful monetary union has eventually been associated with political and fiscal union. Political union in the EZ and EU has stalled and a backlash against anonymous Brussels bureaucrats imposing their views on nation states is brewing. The EU does not have a common foreign policy or a common defense policy; while economic and financial policy convergence has reached an impasse.

A fiscal union would require that a significant amount of federal/central revenues be mobilized for the provision of EU/EZ-wide public goods, but there is no mechanism or will to provide the EU with enough power to create a semi-federal system of taxation, transfers and spending. Fiscal risk-sharing also includes the sharing of losses from financial crises, which requires a central EU-based system of supervision and regulation of financial institutions rather than the current national approach. Losses would be shared throughout the EZ only if the responsibility for properly supervising and regulating financial institutions were at the central level.

Fiscal union would also require the widespread issuance of Eurobonds, where the taxes of German (and core) taxpayers backstop not only German debt but also the debt of the members of the periphery. But the German (and core) taxpayers would not accept that unless binding rules are established to ensure that periphery countries cannot again indulge in persistently and systematically large fiscal deficits; while periphery taxpayers would not accept the total loss of fiscal independence—fiscal slaves to the views of the core—that binding fiscal rules would require.

It is also clear that the heavy burden of private and public debt in a number of periphery countries— Greece, Ireland, Portugal—is so large that a debt restructuring and reduction will eventually have to occur, thus imposing—slowly or sharply—a capital loss on these periphery agents’ foreign creditors (mostly financial institutions in the core). This will exacerbate conflicts between the core and periphery as it will redistribute wealth from savers and creditors to debtor and borrowers.

Figure 2: General Gross Government Debt Projections (if fiscal adjustments go as planned, % of GDP)

And while an orderly debt reduction may at least resolve the issue of excessive debt in some insolvent economies or financial systems, the restoration of economic convergence requires the restoration of competitiveness convergence. Without it, part of the periphery will stagnate or even contract for many years to come and eventually decide to exit the monetary union and return to a system of domestic national currencies.


So, How Can Competitiveness Be Restored and Growth Resume in the Periphery?

One way would be for the euro to sharply fall in value toward—say—parity with the U.S. dollar. But with Germany being uber-competitive, the core running current-account surpluses and the ECB always more hawkish than the Fed, there is little chance that the euro would fall sharply enough to restore the competitiveness of the PIIGS.

A second solution would be to take the German reform approach: Accelerate structural reforms to increase productivity growth and keep a lid on wage growth below productivity growth to reduce unit labor costs. But this will not work: Structural reforms show their gains only in the medium term—in the short run, they can actually reduce growth as you shed labor and capital from declining firms and sectors; also, it took 15 years for Germany to reduce unit labor costs by keeping wage growth below productivity growth; if Greece, Portugal, etc. start today, the benefit in terms of competitiveness and growth will occur only in a decade, too late to be politically acceptable.

A third option is deflation: If the PIIGS could reduce prices and wages by 5% per year for five years, you would get the necessary cumulative compound fall of 30% in nominal prices/wages to restore competitiveness. The problem with the deflation route to a real depreciation is twofold.

First, deflation is associated with persistent recession and no social or political body could accept another five years of recession to reduce prices/wages by 30%; Argentina tried the deflation route to a real depreciation, but after three years of an ever-deepening recession gave up and decided to default and exit its currency board peg.

Second, even if by some miracle deflation was feasible and successful, the real value of the already-high private and public debts would rise sharply (a balance-sheet effect), forcing even-larger defaults and debt reductions. All the talk by the ECB and the EU of an “internal depreciation” is thus faulty: Even the often-heard argument that reducing public salaries would lead to a rapid real depreciation is erroneous as it would require private wages and prices to fall accordingly and would not prevent the damaging balance-sheet effects. The alleged case of a successful internal devaluation— that of Latvia—is not relevant here: Entering the crisis, its public debt was 9% of GDP, not the 100%- plus of Greece; losses from depression and deflation were taken by foreign banks dominating its banking system; and accepting a draconian 20% fall in output was politically feasible as Latvia did not want to fall into the arms of the Russian bear again. And let us not forget that the necessary fiscal austerity has—in the short run—a negative effect on economic growth; thus, it postpones the recovery of growth that is necessary to make the reforms and austerity socially and politically feasible; and that is also necessary to make the debt and deficit ratios sustainable (as falling GDP increases those ratios, despite fiscal austerity efforts).

If the euro is not going to fall sharply, if reducing unit labor cost takes too long to restore competitiveness and growth and if deflation is unfeasible or (if achieved) self-defeating, there is only one other way for the PIIGS to restore competitiveness and growth: Leave the monetary union, go back to national currencies and thus achieve a massive nominal and real depreciation. After all, in all emerging market financial crises where growth was restored, a move to flexible exchange rates was necessary and unavoidable on top of official liquidity, austerity and reform and, in some cases, debt restructuring and reduction.


Surely a Break-Up Remains Inconceivable? Not the Way We’re Going…

Of course, today, the idea of leaving the EZ sounds inconceivable, even in Athens and Lisbon. It is simply not on the table. And of course, the costs of exit would be significant: A country leaving the EZ might also be kicked out of the EU as there is no mechanism to exit EMU without exiting the EU. Also, exit would impose: 1) Trade losses on the rest of the EZ via massive real depreciation; and 2) massive capital losses on the creditor core as the sharp increase in the real value of euro debt once the new currency is sharply depreciated would either force a default on private and public euro debts, or a conversion of such euro debts into the new depreciated national currency (the equivalent of the Argentine pesification of dollar debts). The latter would be a not-so-disguised massive capital levy on the creditor core.

But scenarios that are inconceivable today might not be so far-fetched five years from now if some of the periphery economies stagnate or contract for the next five years, an outcome that is not unlikely if competitiveness is not restored, if the burden—debt overhang—of unsustainable private and public debts is not reduced and if there is little move toward more burden-sharing within the EZ via the progressive adoption of some form of a fiscal union. What has glued the EZ together has been the convergence of interest rates and low real rates sustaining growth, the hope that reforms will maintain convergence when a one size-fits-all monetary and exchange policy opposes growth and the prospect of a move toward a fiscal and political union. But now, the benefits of interest rate convergence are no longer there as: Bond vigilantes have woken up and periphery spreads will remain high for a long time; increasingly, a common
monetary policy and currency is a size that does not fit all; while fiscal union, risk-sharing and political union don’t seem to be on the horizon.

So, it is not a matter of if or whether debt restructurings will occur, but rather when (sooner or later) and show (orderly or disorderly) they occur. And even debt reduction will not be sufficient to restore competitiveness and growth. So, unless the latter can be achieved in other ways, the option for PIIGS of exiting the monetary union will become dominant as the benefits of staying in will be lower than the benefits of exiting, however bumpy or disorderly that exit may end up being.

Messy marriages lead to messy divorces, but if the marriage doesn’t work, even the threat of a messy divorce cannot keep couples together that are not a long-term match.

Ok, this just thoughtful insight in from my friend Richard Yamarone, chief economist for Bloomberg. It is part of an email thread where a number of us were commenting on the recent swoon in the market and how much of it could be tied to Greece?

“When Greece folds like a wet gyro, and it will, the real game begins. It’s no different that when Bear was taken over by JP Morgan, the markets ignored the Bear Stearns story (the media didn’t). When all business televison and newspapers did stories about the $2 price tag on Bear, investors were saying ‘who’s next?’ The fact that Bear went down was old history — most knew it was going to happen. The focus was where do we turn next?

“The Greece story is like the sick uncle at the annual family picnic…Mom would say, go take a plate of food to Uncle Larry, he’s really sick. This goes on for three, five, ten years. Then Uncle Larry dies. Everyone turns to each other shocked, ‘I can’t believe that Uncle Larry died!’0 What’s so surprising? Everyone knew, he was dying for over a decade. That’s what’s going to happen to Greece…The financial press will say Whoa, Greece folded, defaulted, whatever. But the markets will say, ‘Who’s next?’ Then the entire EU will come under pressure. I don’t believe they will exist in two year’s time. – Rich”


Has it Really Come to This?

There are stories and movies where the end of the plot is sad. “Has it really come to this? After all our dreams and hard work and this is what we get?” But this is real. And worse, there are so many people who have been saying “I told you so” for so many years. It is like watching a really bad play and not being able to leave, and knowing you are going to have to watch it the next day and pay even more for the tickets!

The headline on my European Wall Street Journal this morning says “Greece Faces Demands for Deeper Cuts.” On TV, 20,000 people are surrounding the Greek parliament. The “troika” is meeting this weekend and you can bet Bernanke and Geithner have people there with second row seats, discreetly placed. My bet? They find the measly 12 billion euros to paper over the current crisis.

Then comes the July meeting. That’s when it gets interesting. They are going to need at least 150 billion euros (for a total of 340 billion, give or take) to get this done for a few years. Joan McCullough sent me these really great paragraphs:

“Lemme tell you something right now. Yesterday, all these warring factions in Europe went from a hardcore game of “chicken” to blinking. Each and every one backpedaled. And the spin became “broad-based cooperation” to get it done. Because they were facing meltdown. And I’m thinkin’, the next thing we’re gonna’ see is the Greek Army and then it’ll be all over. I am sure all this was not lost on the rest of the world’s leadership who are watching Greece unfold from the edge of their seats.

“That same backpedaling baloney has continued this morning now to where Merkel is tryin’ to smooch it up with the ECB. They’re talkin’ Vienna-style resolution. Again. (That’s the one where the paper matures but the banks have formed a consortium and have agreed collectively to let the bet ride, i.e., roll over. I guess a roll-over at gunpoint does not count as a default. Whatever. We are so far into delusional, I’m actually enjoying it now. You?)”

Let me repeat myself. Reading and listening to people over here I get the distinct feeling that the politicians at these meetings will not be the same ones at a similar meeting in two years. This is not a happy group of voters. There are no good choices. It is between choosing between pretty bad today and really bad in a few years and a disastrous choice forced on the world after that.

Let me suggest to my fellow US citizens that you really pay attention to this. If you think that we can somehow avoid making difficult choices by kicking the can down the road, watch the European theater. And coming to a theater near you in a few years will be a real Japanese monster movie. Godzilla on steroids.

I think Nouriel is being optimistic, which makes me nervous, because he is supposed to be Dr. Doom. I don’t like taking a more pessimistic stance than him, but I just can’t see five years. The math just doesn’t work. Not the accounting math for Greece (or Ireland) and certainly not the political math.

But he may be right in this. There are no agreed upon ways to leave the Eurozone and return to a national currency. The legal pain is horrible to contemplate. It may take a very long time for the participants to work out what can only be a messy divorce.

Me? I would tell the Greeks to figure out their own problems. They got themselves into it. If they want to stay with the euro, fine. But we are not going to bail you out. We are not throwing good money after bad. Europe should take the money they are giving to Greece (which is just going to default later anyway) and bail out their financial system directly. Let bondholders lose and realize they actually have to pay attention to what they invest in. Are these guys creditworthy?

It is like loaning your profligate brother-in-law money. You do it to keep peace in the family, but there comes a point. It helps neither him nor you.


Kiev, Geneva, and London

As noted above, I am in Kiev, Ukraine with youngest son, Trey, spending a fascinating time with friends who have flown in from all over the world for a class reunion of an executive course we did two years ago at Singularity University in the Silicon Valley. Beautiful city, lots of orthodox churches that have been restored, new buildings and architecture among the Soviet-era dullness.

There is a very vibrant business community, judging from the people I’m meeting. But there is also a melancholic note. Ukraine’s population is decreasing faster than that of any nation in the world. It is down from 54 million in 1991 to less than 46 million today, and still dropping. The birth rate is about the lowest anywhere, and the young people are leaving the country. Our tour guide says that so many young people have no hope.

But, as you walk the streets, people seem happy and moving with purpose. The universities are full. The people are very friendly. I need to come again and explore some more. Sigh. There are so many places that deserve some attention, and so little time.

I am off to Geneva on Sunday and then to London on Wednesday night (after we take a tour of CERN), where I will co-host Squawk Box London for two hours. Then it’s on to the airport and home (mostly) for the next two months.
Somehow, I figured out how to be in Texas in July and August. Timing was never my thing.

I see a river boat tour tonight, shooting Soviet-era guns with my son tomorrow, and lots of great conversation in my very near future. Have a great week.

Wall Street Week Ahead: Line drawn in stocks' battle

by Edward Krudy

(Reuters) - The S&P 500's 200-day moving average is the line in the sand as the bulls and the bears fight over the U.S. stock market's direction. It will face one of its stiffest tests next week with Greece's debt crisis appearing to reach a climax.

After setting its closing high for the year on April 29, the S&P 500 has lost 7 percent. Wall Street typically defines a drop of 10 percent or more from a recent peak as a correction.


The benchmark S&P 500 hit its lowest point right on its 200-day moving average in volatile trading on Thursday. The index then rallied 1 percent from that session low to close on Friday at 1,271.50. It also scored its first weekly gain in the last seven weeks.


At Friday's close, the S&P 500's 200-day moving average was around 1,259. If the level holds, it could be a springboard for stocks to rally.


"We seemed to have bounced off that level of concern that people were watching," said David Joy, chief market strategist at Ameriprise Financial, where he helps oversee $571 billion in assets. "At least for now, that is a little bit of evidence that these problems are solvable and markets could move higher."


The Nasdaq, which often leads market moves, has not fared so well, and that is a worry to investors. It has closed below its 200-day moving average and kept falling on Friday when other indexes stabilized. It ended the week down 1 percent. From its 2011 closing high on April 29, the Nasdaq has tumbled nearly 9 percent -- getting close to a correction.


Bond markets remain anxious about a Greek default.


Most economists are overwhelmingly skeptical that Greece can ever repay its mountain of debt, which has reached 340 billion euros -- or 150 percent of the country's annual economic output.


Reuters' calculations using 5-year credit default swap prices from Markit show an 81 percent probability of Greece eventually defaulting, based on a 40 percent recovery rate.


SOME SAY IT'S TIME TO BUY


But for now, it seems stock investors are sanguine. They believe the European Union will rescue Greece without major disruption to markets and are using the drop in equity prices as a buying opportunity.


Bob Doll, chief equity strategist at BlackRock, says he has been using the pullback to reduce his underweight in cyclical stocks such as a Alcoa Inc , Applied Materials, and International Paper.


He has also been cutting his overweight in defensive areas such as healthcare, trimming positions in stocks like United Health and Aetna.


Doll believes the S&P 500 will rally to 1,350 by the end of the year.


"We're going to find Band-Aids and we're going to muddle through these credit problems," Doll said. "The consequences of not following that route could be pretty dire, and I think the interested vested parties are going to step up."


BlackRock is one of the world's largest money managers with $1.56 trillion in equity assets under management. Doll is also lead portfolio manager of BlackRock's Large Cap Series Funds and advises on $317 billion that is actively managed.


TUNING IN TO THE FED


A slew of data showing the United States is on the verge of a slowdown has already done its damage to the market. After the heavy selling of the past several weeks, it seems investors are taking a wait-and-see approach -- for now.


Joy is waiting until after the summer before making big moves.


"There is so much uncertainty that it is probably not wise to make big long bets, but I think that opportunity may well arise toward Labor Day," he said.


In the meantime, any sign that fears may have been overblown could spur a rally. The final reading on U.S. 

gross domestic product for the first quarter is forecast to come in at an annualized growth rate of 1.9 percent -- slightly higher than the first two estimates. But investors will be on the lookout for a surprise.


"People are not expecting a lot from GDP so should it come a little better than expected, you could see a pretty decent rally," said King Lip, chief investment officer of Baker Avenue Asset Management in San Francisco.


Some analysts attribute much of the market's turmoil to the end of the Federal Reserve's asset-purchase program, known as quantitative easing, or QE2. That will come to a close at the end of the month.


Investors will be looking to Chairman Ben Bernanke to reassure markets after the Fed's two-day meeting ends on Wednesday.


"What investors are really looking for is not a QE3 but a QE2.5, where (the Fed) continues to reinvest the coupons they get from the bonds they purchased," Lip said. "If that's the case, investors will look well on that."


The CBOE Volatility Index or VIX, a gauge of investor anxiety, spiked during the week, but it is still at relatively depressed levels. That could be a sign investors are still too complacent about the risks ahead.


"If the economy is slowing as much as people are thinking, should there be more risk to second-quarter earnings? That's a real question we have to ask," Doll said. "There is risk of complacency -- no question."

Follow Us