Friday, March 21, 2014

The Yellen Cacophany Begins: Confused Markets Are Going Off Their Fed Meds

by Jeffrey P. Snider

There were evident divergences all across the credit complex as the Yellen Fed takes shape. Maybe it relates to these “markets” being more accustomed to Bernanke and his manner of speech and saying nothing, but to me there appears to be little consensus about anything.

I have said on previous occasions this year that swap market participants are not synchronized with UST rates, as swap spreads have decompressed while treasury rates have fallen (particularly since January 9). That indicates to me wariness against policy changes of the kind we apparently saw on Wednesday. It also appears as if some agent, dealer or major participant got caught, yet again, positioned in the “wrong” direction against rate movements. There was clear desperation, evident more in the 5-year spread than 10-year (5-year spread dropped a massive 18 bps on Wednesday, settling at -.09 bps).

ABOOK Mar 2014 Credit Swap Spreads

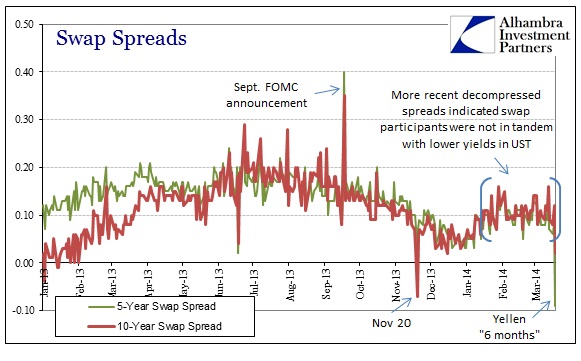
If I had to guess, I would say that the extreme spread movement Wednesday related to the collapse in the curve – a massive flattening that no doubt ran over some positions. We have no idea who was affected and by how much, but to move spreads as much as it did suggests it wasn’t a minor “mistake.”

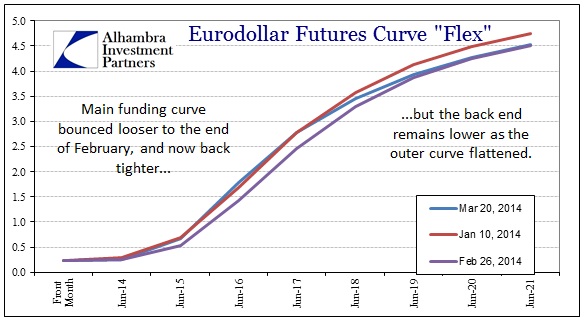
We can pick up some of that in funding markets, as dollars tightened more than a little in the “money” part of the eurodollar curve, but remained unperturbed in the outer years.

ABOOK Mar 2014 Credit Eurodollars

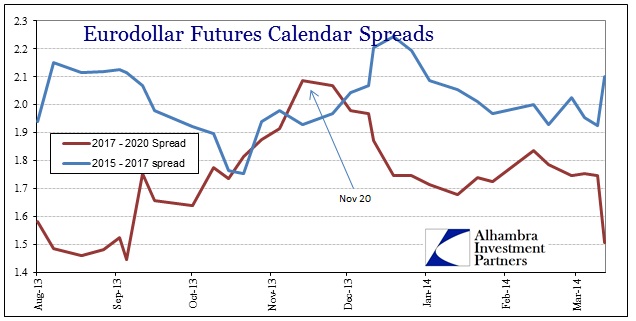
The net result was a rather obvious drop in calendar spreads out to 2020.

ABOOK Mar 2014 Credit Eurodollars Calendar Spreads

Given all of that “action”, you might expect some kind of change in expectations for inflation, particularly as that has been somewhat of a focus lately of both observation and policy. But the embedded inflation expectations in the treasury market have been more than docile ever since the summer selloff.

ABOOK Mar 2014 Credit Inflation Breakevens

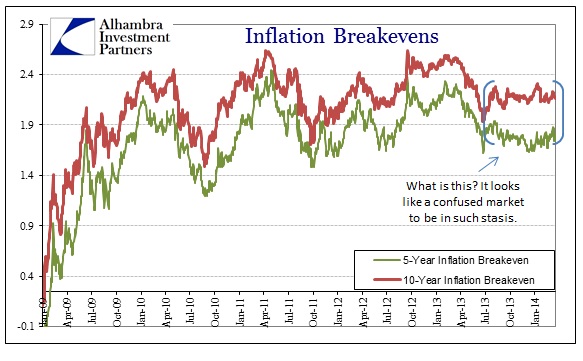
Such a static inflation indication I think goes along with these divergences in various segments. On the one side, there is constant reassurance that inflation will pick up at some point, and that the Fed will “normalize” itself to that inflation paradigm. Yet, for all that talk there is the evident problem that inflation is actually going in the “wrong” direction without anything other than assurances that will change. The net result appears as neither position obtains momentum, and the “market” devolves strangely into this static state.

Credit markets appear almost confused about the most basic factors of credit and interest rates. Could it possibly be from too much monetary interference through the lack of clarity regarding stance? The FOMC talks about forward guidance as if it were almost a direct line to credit “markets”, but these strange indications show that there is very little consensus anywhere about anything.

I think that applies as well to the yield curve shape (not unlike the eurodollar curve shape recently). The entire frame of the credit selloff between early May 2013 and November 20, 2013, was a sharp steepening in the belly. Then that reversed in one day, in no small part due to the sudden interest of QE POMO in the 9-10 year maturities beginning November 20. The Fed is still buying there, with only a break in February.

ABOOK Mar 2014 Credit SlopeABOOK Mar 2014 Credit POMO

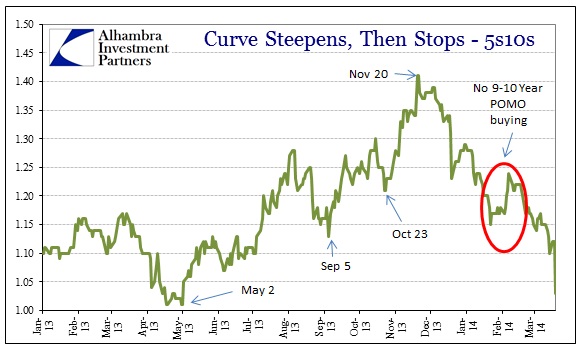
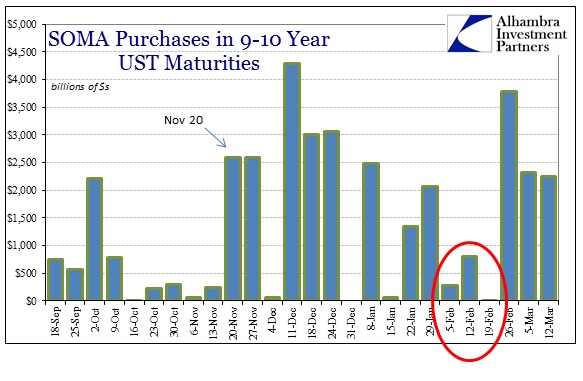
Does that explain why the 5-year (where no POMO activity has taken place at all) is taking the greatest beating? Is the Fed, aware of its “need” to “support mortgage finance” trying to influence the curve shape, and thus manifesting more and more confusion? Or, more precisely, have the credit markets become more attuned to guesses about changes in policy rather than anything else?

I don’t think there is a clear answer to any of those questions, but I do think there is something to them. Between the swaps market, minimal changes in eurodollar curves, and the absolute sclerosis in inflation expectations, I cannot help but wonder what would cause such evident seizure, particularly as major policy changes correspond to each of these pieces. However, the commonality in all of it seems to be a hidden wariness that I don’t believe existed prior to last May, meaning credit was lulled into a false sense of security that is only now being appreciated for what it was.

See the original article >>

The Waiting Wall

by Marketanthropology

From our friends at the Wall Street Journal:
____________

"Is this a recipe for another period of financial excess or runaway inflation? Not necessarily. Real short-term borrowing rates also were negative for most of the 1940s. Some analysts say World War II jolted the U.S. out of Depression. That might be the case, but cheap credit also helped.

This little history sums up Fed Chairwoman Janet Yellen’s challenge. The Fed is effectively betting it’s replaying a financial history that looks more like the 1940s than the 1970s or 2000s. If officials are wrong in that diagnosis, the consequences could be rather unpleasant."

- By Jon Hilsenrath - Grand Central: Fed Likely to Signal Real Rates Will Stay Negative For Years

____________
As much as it makes us uncomfortable sharing a picnic bench with the Fed, from our perspective (see Here & Here) they're looking at the right parallel. To that point, we recognize that it is this visceral and underlying cynicism and disdain of the Fed's quite visible hand which will likely provide the counterintuitive market dynamics we described in our previous notes on the 40's.   

Another Fed meeting, another taper - and another wail with dramatic pause from the participant and pundit peanut gallery. Our general take is that despite the immediate reaction by the market and extrapolation of near-term rate hikes on the horizon, the truth is the sentiment picture towards and drawn by the Fed will likely change swiftly when the ebullient character in our own domestic markets turn down. From our perspective that seems increasingly likely as the Fed pivots further away from their extraordinary monetary support.  
You'll notice that although the Fed helped smooth the business and market cycle during the 1940's, by the time the Fed started walking back its purchases at the beginning of 1947, the bloom had already come off the rose in the equity markets. It was during this time period that the zeitgeist saw a return to the economic hardships of the Great Depression, which bolstered Treasuries despite the fact that inflation was beginning to find traction in the system. 
Although the timeframes are different (4/42-4/46 & 3/09-3/14) between the two SPX series, when you factor in the pauses the Fed made in their LSAPs this time around the block, the comparison is much closer.
While the performance of long-term Treasuries and equities since the initial taper have been similar, our outlook continues to be much favorable for Treasuries going forward. 

See the original article >>

Gold Completes Golden Cross

by Tyler Durden

For the first time in 13 months, gold's 50-day moving-average is above its 200-day moving-average. This so-called "golden cross" occurred in Feb 09 before gold surged over 100% in the following years (but also occurred 'falsely' in September 2012.

Some technicians are reflcting on the last big run that gold had...

See the original article >>

Stock Market Crash Fractal - Deja Vu 2000 All Over Again

By: Anthony_Cherniawski

The Crash Fractal is still alive and well in the Dow. Its peak was December 31

The peak in NDX was March 7. It is now reversing hard down, as anticipated.

The peak in the Russell 2000 was March 4. It, too, is reversing.

But we have a new peak high in the SPX. However this may be almost exactly equivalent to the Market in 2000 when the Dow made its high in early January, while the SPX did not make its high until March 22. What followed was a 17.2 market day decline to April 14. That, my friends, was the first Flash Crash of the 21st century.

Watch SPX carefully, as I don’t expect it to stay elevated very long. It is possible that traders are still unaware of the big reversal in the NDX.

VIX made a Minor Wave 2 low this morning and is quickly taking back its losses. We may see a breakout later in the day as traders start hedging.

See the original article >>

5 Things To Ponder: Yellin' About Yellen

by Lance Roberts

The biggest news this past week was Janet Yellen's first post-FOMC meeting speech and press conference as the Federal Reserve Chairwoman.  While I have the utmost respect for her accomplishments, every time I hear her speak all I can think of is my white haired, 75-year old grandmother baking cookies in her kitchen.  This week's "Things To Ponder" covers several disparate takes on what she said, didn't say and the direction of the Federal Reserve from here.

In order to give these views context, I have included Yellen's post-meeting news conference.  This is best viewed with a glass of milk and some warm, fresh chocolate-chip cookies...."just like Grandma used to make."


Quote Of The Day: "Bull Markets Are Just Like Sex, It Feels Best Just Before It Ends." by Barton Biggs

1) Dropping The 6.5% Unemployment Target by Howard Gold via MarketWatch

I have written many times in the past, most recently here, that the 6.5% unemployment target for the Federal Reserve was not a good measure of the true state of employment in the U.S.  Specifically I stated:

"The difference between today, and 1978, is that in 1978 the LFPR was on the rise versus a sharp decline today.  However, as I stated previously in 'Fed's Economic Projections - Myth vs Reality' this leaves the Federal Reserve in a bit of a predicament.

'The problem that the Fed will eventually face, with respect to their monetary policy decisions, is that effectively the economy could be running at 'full rates' of employment but with a very large pool of individuals excluded from the labor force.  Of course, this also explains the continued rise in the number of individuals claiming disability and participating in the nutritional assistance programs.   While the Fed could very well achieve its goal of fostering a 'full employment' rate of 6.5%, it certainly does not mean that 93.5% of working age Americans will be gainfully employed.  It could well just be a victory in name only"

This is particularly the case when roughly 1 out of 3 people are no longer counted as part of the work force, 1-out-of-3 individuals are dependent on some sort of social support program, and over 17% of personal incomes are comprised of government transfers."

Howard points to the Federal Open Market Committee dropping its 6.5% unemployment rate threshold for raising the federal funds rate, a target originally set in December 2012.

"Instead it would look at some 'qualitative' measures, 'including measures of labor market conditions, indicators of inflation pressures and inflation expectations, and readings on financial developments,' the FOMC’s statement said."

This move shouldn’t have surprised anyone. The official unemployment rate was 6.7% in February and keeping that 6.5% target would have tied the Fed’s hands before it’s even finished tapering.

Yellen must deal with an economy that’s slowly recovering, but leaving a lot of people behind."

2) Yellen And The Fed Go Dark by Matthew Klein via Bloomberg

This is a very interesting take on a change in how the Fed presents its decisions and is worth reading in its entirety.

"Unless you have a crystal ball that tells you what will happen with wages, this possible new target tells you almost nothing about when rates will be raised.

These developments suggest a desire to turn the clock back to a time when traders had to make bets without Fed hand-holding -- even if the Fed still does release its economic projections. A shift toward opacity might be wise. The economy is a complex system that no one fully understands, so it would be foolish to commit to any unbending numerical rule that limits policy makers’ flexibility to react to unforeseen events. That was why former Chairman Alan Greenspan was opposed to formal inflation targets.

An additional benefit of opacity is reduced predictability. Scholars have found that financiers take too much risk when they think they know what will happen in the future, so muddying the waters may be just what’s needed to promote a safer financial system."

3) Why The Fed Will Stop Tapering by Peter Schiff

"In reality, the Fed will keep manufacturing excuses as to why rates can't be raised. Whether it's a cold winter or a hot summer, a geopolitical crisis, or an unexpected sell off in stocks or real estate, the Fed will always find a convenient excuse to postpone tightening. That's because it has built an economy completely dependent on zero % interest rates. Even the smallest rate shock could be enough to push us into recession. The Fed knows that, and it is hoping to keep the ugly truth hidden.

Although Yellen followed the script on the QE tapering, by decreasing monthly purchases by an additional $10 billion to $55 billion, look for her to abandon her commitment to wind it down to zero just as easily as she has walked back the Fed's commitment to raise rates once unemployment hits 6.5%. Any additional weaknesses in economic data, or dips in stock or real estate prices, will cause the Fed to call a time out on its tapering plan."

4) Rising Risks To Fed's Policy Change By Mohamed El-Erian via CNBC

"Higher uncertainty premiums: The Fed is in the midst of not one but two policy transitions. It is pivoting from reliance on a direct instrument (QE purchases of securities in the marketplace) to an indirect one (forward policy guidance to convince others to devote their balance sheets) — thereby raising effectiveness questions. It is also moving from a readily-observable unemployment threshold to a set of indicators that include qualitative judgments — thereby raising less predictable interpretation questions.

Technical market conditions: Given the impressive multi-year rally, it doesn't take much these days to convince equity traders to book profits (and it hasn't taken long for buyers to buy on the dip). Similarly, over-extended front end rates positions can be destabilized in the immediate term even if the Fed is committed to maintaining low rates for long.

Reaction to the interest-rate selloff: With a significant part of the economy sensitive to short and intermediate interest rates, including housing, and with the economic recovery yet to broaden sufficiently, it is not surprising that the stock market would be concerned with a sharp selloff in the shorter-dated rates.

What about the longer-term?

Here, much depends on your assessment of the first factor — namely, Fed policy effectiveness during its policy transition. Unfortunately, there are no tested models, policy playbooks or historical data to confidently guide investors. What is clear, however, is that they will require quite a bit of evidence of ineffectiveness before abandoning their faith in an institution that has significantly supported markets in recent years."

Bye-Buy-BUY

5) Inside The Madness Of The Stock Market by Jason Zweig

Jason's articles are always worth reading and this is no exception.  The "madness of crowds" is always relevant and prevalent.  With the financial markets tied to the Federal Reserve, like a "fetus to its mother," these words of wisdom are worth remembering.

"In a guest essay published in the New York Times on Oct. 29, 1989, called 'Fear of a Crash Caused the Crash,' future Nobel Prize-winning economist Robert Shiller described a survey he had done of 101 market professionals the Monday and Tuesday after the tumble. Asked whether the drop was driven by 'a change in the stock market fundamentals' or 'psychology and emotion,' only 19% cited fundamentals; 77% blamed psychology and emotion. Shiller and his colleague William Feltus also asked the professionals if they thought the latest drop could turn into a replay of the 1987 crash; 35% thought it could, while 41% thought other investors thought so.

So, when KAL poked fun at traders overreacting to what others say, he was right on the money.

To this day, says KAL, brokers buying copies of the cartoon (featured above) 'inevitably' tell him, 'It was so funny because it was so true.'"

See the original article >>

Spring Forward?

by Bespoke

Happy Vernal Equinox!  The March equinox means the cold can't last much longer for those of us living North of the equator.  Today is the halfway point between the shortest day of the year and the longest day of the year, and is the traditional start of the spring season as defined by our planet's orbit.  12:53 PM today was the first minute of spring, at least as far as astronomers define it.  Spring has been a long time coming for the Eastern seaboard, and the market is ready to get the snow dusted off.  Below is a composite chart of cumulative performance in the S&P 500 dating back to spring of 1928, broken up by season and beginning with spring.

After a bit of a rough patch to start, historically speaking the spring months have been a good period for the market, with April especially showing strength.  Winter is the best time of the year to be in stocks, but over the last twenty years (1994 - 2013) spring has been almost as good or better depending on whether you use the median or average.  The real season of strength in the last twenty years, though, has been the fall.  While it has been the worst season for equities going back to 1928, in the last twenty years it has been the best season with the S&P 500 averaging a gain of 3.76%.  What does that mean for this year?  Historical patterns are never absolute, but if history does stick to its trend the next few months could be good ones for the market before we get into a summer lull.

See the original article >>

Dollar looks strong as Fed signals exit

By Andrea Wong

The dollar(NYBOT:DXM14) advanced to the strongest level in two weeks against the euro after Federal Reserve policy makers signaled they’ll probably raise interest rates by the middle of next year.

The greenback rose versus most of 16 major peers after Fed policy makers raised interest-rate forecasts yesterday and Chair Janet Yellen said borrowing costs could start rising “around six months” after the Fed stops buying bonds. Brazil’s real climbed on bets the nation’s central bank will raise rates. U.S. two-year note yields rose after gaining the most yesterday since 2011, burnishing the appeal of dollar-denominated assets.

“The dollar is likely to trade more firmly,” said Daniel Katzive, a director and head of foreign-exchange strategy, North America, in New York at BNP Paribas SA. “The Federal Open Market Committee’s message this week has forced markets to reassess the likely timing of the Fed’s first rate hike, driving front-end yields up significantly in the dollar’s favor.”

The U.S. currency advanced 0.4 percent to $1.3777 per euro at 2:10 p.m. New York time. It touched $1.3749, the strongest level since March 6. The dollar appreciated 0.2 percent to 102.49 yen after jumping 0.9 percent yesterday. The yen strengthened 0.2 percent to 141.20 per euro.

Europe’s shared currency will fall to $1.31 by year-end, the lowest since July, according to the median estimate of analysts in a Bloomberg survey. The yen will weaken to 110 per dollar for the first time since August 2008, analysts forecast.

Brazilian Currency

Brazil’s real climbed as faster-than-forecast inflation fueled speculation the central bank will keep raising borrowing costs. The currency strengthened as much as 1.2 percent to 2.3217 per dollar before trading at 2.3243, up 1.1 percent.

The Getulio Vargas Foundation reported yesterday that Brazil’s producer, construction and consumer prices rose 1.41 percent in the 20 days starting Feb. 21, more than the 1.35 percent increase forecast by economists surveyed by Bloomberg.

Indonesia’s rupiah led losses among the dollar’s 31 major counterparts after the Fed’s outline on the timeframe to raise interest rates.

“We’re seeing a broad dollar rebound after the Federal Open Market Committee meeting, and the rupiah isn’t immune to that,” said Irene Cheung, Singapore-based foreign-exchange strategist at Australia & New Zealand Banking Group Ltd. “The expectation for higher interest rates sooner than expected” was the big surprise.

The rupiah slumped 1.2 percent to 11,445 per dollar, the biggest loss since Nov. 11.

Kiwi Declines

New Zealand’s dollar weakened for a second day after the nation’s statistics agency said gross domestic product rose 0.9 percent in the fourth quarter, versus a revised 1.2 percent during the previous three months. The kiwi fell as much as 0.7 percent to 85.02 U.S. cents before trading at 85.37 cents, down 0.3 percent.

The dollar has gained 0.8 percent in the past six months among the 10 developed-nation currencies tracked by Bloomberg Correlation-Weighted Indexes. The yen slid 2.6 percent, while the euro gained 2.9 percent.

Yields on Treasury two-year notes increased one basis point today, or 0.01 percentage point, to 0.43 percent after climbing seven basis points yesterday.

The policy-setting FOMC after a two-day meeting discarded a jobless-rate threshold for considering when to increase borrowing costs and said it will look at a wider range of data. The benchmark interest-rate target has been zero to 0.25 percent since 2008.

‘Six Months’

Policy makers reduced monthly bond-buying by $10 billion to $55 billion and said the purchases will be slowed in “further measured steps.” Economists surveyed by Bloomberg before the meeting forecast officials would announce an end to the program in October.

Yellen said she saw a “considerable time” between the end of the stimulus and the first rate increase, meaning “around six months or that type of thing.” She spoke at a press conference after presiding over her first policy meeting.

Fed officials estimated the interest rate will be 1 percent at the end of 2015 and 2.25 percent a year later. In December, they projected 0.75 percent and 1.75 percent.

The Bloomberg Dollar Spot Index, which monitors the U.S. currency against its 10 major counterparts, rose 0.2 percent to 1,021.60 after reaching 1,023.65, the highest since Feb. 13. It jumped 0.8 percent yesterday, the most since August.

“The statement and forecasts contained unexpected hawkish elements, which Yellen didn’t dispel,” said Valentin Marinov, head of European Group of 10 currency strategy at Citigroup Inc. in London. “Euro-zone assets no longer look cheap,” and it “points to growing downside risks for euro-dollar.”

U.S. Sanctions

The ruble erased gains as U.S. President Barack Obama ordered sanctions on 20 senior Russian officials and a bank in the standoff over Russia’s annexation of Ukraine’s Crimea region. The financial firm is Bank Rossiya in St. Petersburg, which officials said has $10 billion in assets and is the 17th largest bank in Russia. Obama imposed sanctions earlier on 11 individuals.

The currency was little changed at 42.3420 against Bank Rossii’s target basket of dollars and euros.

France leapfrogged the U.S. as the top destination for the Russian central bank’s investments, dethroning America for the first time. The amount of reserves in French assets, including government bonds and deposits, rose to 32 percent as of June 30, a jump of 4 percentage points from three months earlier, the central bank said today in a quarterly report on its website. Bank Rossii decreased investments in the U.S. to 29.7 percent, from 33.8 percent.

See the original article >>

The Federal Reserve: Masters of the Universe or Trapped Incompetents?

by Charles Hugh Smith

Suppose the Fed was actually little more than a collection of incompetents trapped in a broken system that is beyond repair.

For a variety of reasons, the Federal Reserve is viewed by many as the financial Master of the Universe. Given how the media hangs on every pronouncement and the visible power of the Fed's policies to move markets, this view is understandable.
But suppose rather than being masters of all things financial, the Fed was actually little more than a collection of incompetents trapped in a broken system that is beyond repair. Many reasons have been proposed to explain the Fed's policies,and most (including my own expressed here) focus on the Fed's need to protect the banking sector and the Status Quo, lest the whole rotten contraption collapses in a heap of worthless derivatives and various Ponzi schemes.
An alternative view is that the members of the Fed have been selected for incompetence by a system that fosters incompetence by its very nature, i.e. a centralized power center.
Longtime correspondent Harun I. recently offered this explanation of the incompetence of those atop the heap:

Regarding the competence of the Deep State and Federal Reserve:When one merges the Peter Principle and Pareto Principle one realizes that, not only are they incompetent, it is inevitable. Complexity does not equal competence. And because complexity is a form of leverage it does not require a majority of systems inoperable to fail.
Modern developed civilizations rest upon several inverted pyramids. How many people out of any random sampling know how to produce their own food, make their own clothing, build their shelter, or tap into their own water source? As complexity increases and the division in labor grows increasingly in areas that have nothing to do with core survival the civilization becomes increasingly incompetent.
Since a civilization is a hierarchal system, its leaders (the vital few) will eventually be incompetent. Inverted pyramids and inept leadership are a toxic mix. As history would indicate this situation eventually disintegrates then reorganizes... to be repeated.

Another key characteristic of such centralized systems is the way they trap participants, even those at the top. Analyst Catherine Austin Fitts has discussed this attribute, for example, in this interview: Catherine Austin Fitts on Wall Street's Corruption, the Austrian School and Who's 'Really' in Charge.
One way to think about this is to ask: let's say the voting members of the Fed knew that the best way to re-start sustainable growth was to normalize interest rates by ending the Fed's zero-interest rate policy (ZIRP) and quantitative easing.
Even if they knew these changes would ultimately profit the banking sector and the economy as a whole, could they withstand the pressure that would be exerted by everyone benefiting from the Status Quo?
I have long maintained that the Fed's vaunted independence is actually contingent, i.e. the Fed is a political entity and as a result it responds to political pressure like any other political entity. And like any hierarchy, it is prone to group-think and the urge to conform to norms.
This raises another question: even if the voting members of the Fed wanted to fix the nation's broken financial system, do they have the ability to do so?
I have posited that whatever consensus/group-think dominated the various factions that comprise the Deep State has eroded, and the cracks of profound disunity are opening between powerful factions in the Deep State.
Rather than Masters of the Universe, the Fed's governors are increasingly looking more like deer caught in the headlights of a transformation they cannot understand, much less control.

See the original article >>

Fool’s gold?

By Judy Crawford

Fool’s gold? Not quite. Gold (COMEX:GCJ14) had one heck of a run that technically started with a major bottom in 1999 but didn’t really get serious with the move until late 2005. Consequently gold has become a very emotional market for many and the darling of investors. If you question the up trend in any manner to many, it is like you offended their first born.

Consequently, the one demon that is very hard to deal with in any market, emotion and/or personal opinion takes the place of logic with gold and what the market is doing. All markets go up and all markets go down. It does not mean the end of that market by all means. It is merely a phase and it is the phases that we have to face sooner or later because they can be very extensive and expensive if you’re on the wrong side.

So it seems everyone is asking someone what they think of gold. Yet no one has asked gold itself. Gold trades every day and night and to get some idea of what it is doing, it might be helpful to pay attention to what it says. And its “language” is not yours or mine but what it does every day in its technically behavior. That is the basic language of that market and, in fact, any market. So what does gold suggest?

Since gold started its major move in 2005 it has been in a long term uptrend. That uptrend currently intersects approximately down around 1100.00. From 2005 to 2008 it had two small corrections. It was then almost straight up from October 2008 to the September 2011. The more a market rallies, without a correction, the more extreme the correction will be. The dynamics change and that is what occurred with gold. It has not changed the overall trend but it sure has changed the extent of the correction based on the dynamics of the market--with or without the interim rallies it produces in that process.

And that is where traders seem to get into trouble--with the interim rallies gold has been producing during this major correction. And that is where, it seems to me, that emotion has taken over again. Anxious for a retake of that major rally that started in 2005, traders decide that any rally is a return to that great trend. So everyone gets back on the band wagon. But what has gold been really doing?

If you go back to the monthly chart, I would say gold is a “teaser.” When it first topped out in September 2011 the selloff was extensive in one month from 1923.70 down to 1535.00. The ensuing rally looked like a test of the high that failed as the next selloff (1523.90) took out that 1535.00 low. The next little rally failed and gold started to sell off again. Based on the technical formation so far, you would assume that selloff would take out the 1523.90 low. Wrong. Gold stopped at 1526.70 and takes off. Great! The assumption then was that the major correction was done and over with. After all gold tested that low and held. Right? Wrong. What does gold do? It stops short of the high of the first rally (1804.40) when it reached 1798.10 in October 2012. It was only then that gold started technically the second wave down in this major correction. And what a correction. After lulling everyone into thinking gold had bottomed it literally collapsed down to 1179.40 in June 2013.

So that was the end of the second wave down technically in this major correction. Gold then started to repeat what it had done in late 2011. Another rally totally 254.60 points occurred before it again sold off (just like it did in November 2011). And that selloff stopped at 1181.40, definitely short of the 1179.40 low made in June. Now technically that suggests a test of the bottom that holds. Right? Don’t be so quick. And that brings us to today. Gold is rallying and you hear everywhere that gold has bottomed. Near term that is obviously correct but is it a major bottom?

Well, if you look back to what it pulled in late 2011, I would not be too quick to assume that. Why? It could be setting up the same thing again: giving the suggestion of a bottom formation but one that could ultimately fail as it did in 2011. All it did was drag in the weak longs and we all know what happened then. Sound familiar?

So if you are going to look at and listen to the technical behavior of gold I would not be so quick in believing the bottom is in with this “teaser.” We had a low in June 2013 that was tested and held in December 2013 that started the current rally. This is exactly the same setup that gold established in late 2011/early 2012 and it was a false bottom then and could be now.

So far the current rally has been a total of 211.20 points. It has yet to match the previous one. And technically since the 2011 high, gold has had two waves down--the second bottoming in June 2013. It has yet to complete a minimum of three waves down and technically markets tend to do either three or five. So that could add to the probability that this is a false bottom to this major correction.

So has gold really bottomed? Technically that has to be questioned, based on gold’s past behavior. If so, this current potential bottom does warrant calling it “fool’s gold” in that sense for now. Time will tell.

See the original article >>

Soybeans Decline on Concern About Weakening China Demand

By: Bloomberg

Soybeans fell the most in more than a week in Chicago on concern about falling demand from China, the biggest buyer of the oilseed.

Chinese soybean demand will weaken in the second and third quarters as crush margins slump in the next three months, with imported shipments accumulating and outstripping consumption, Chen Xuecong, vice president of Sinograin Oils Corp., said at the sidelines of an industry conference in Beijing.

Soybean futures for delivery in May dropped 1.2 percent to $14.165 a bushel on the Chicago Board of Trade by 6:27 a.m. The contract declined the most since March 12, trimming a weekly gain to 2 percent.

"In soybeans, operators are showing their concern about the cancellation of Chinese purchases from South America, maybe the beginnings of a downward revision of the country’s import requirements following a drop in demand," Paris-based farm adviser Agritel wrote in a market comment today.

China’s soybean imports fell to 4.81 million metric tons in February from 5.91 million tons in January, the lowest in four months, customs data show. The country may import 67 million tons in the year through Sept. 30, 2 million tons less than predicted by the U.S. Department of Agriculture, Chen said.

Palm oil for June delivery fell 1.6 percent in Malaysia to the lowest close in a month amid an outlook for rising production in Indonesia. May-delivery soybean oil, which competes with palm oil, fell 1.1 percent to 40.84 cents a pound in Chicago.

Wheat for May delivery dropped 0.7 percent to $6.99 a bushel in Chicago, still headed 1.7 percent higher this week. The contract touched $7.235 yesterday, the highest level since May. November-delivery milling wheat traded on NYSE Liffe in Paris fell 0.6 percent to 203.25 euros ($280) a ton.

Egyptian Tender

Egypt, the world’s biggest wheat buyer, bought 60,000 tons from Russia and 60,000 tons from Romania in its latest tender on March 18, as well as 55,000 tons of U.S. wheat.

"The Black Sea offer is still leading the way in terms of competition," Jaime Nolan-Miralles, a risk analyst at INTL FCStone Inc. in Dublin, said by phone today.

Corn for delivery in May slipped 0.3 percent to $4.7725 a bushel in Chicago, set for a weekly decline of 1.8 percent.

See the original article >>

Improvement In Unemployment Claims Slows as Stock Market Bubble Rages On

by Lee Adler

The headline seasonally finagled number of first time unemployment claims was 320,000 in the week ended March 15, beating Wall Street conomists’ consensus guess of 330,000. As with other data for February and March, the pundits and their media handmaidens had conditioned the market to expect downbeat numbers.

We knew otherwise. But the market was yet again surprised by the strong number this morning and once more took off like a scalded dog. Do that to me one more time! Rest assured that the Primary Dealers were well prepared as they had shaken the tree for a little extra inventory yesterday when Yellen said something about the prisoner having 6 months to live.

The Pavlovian training to expect bad numbers has been a two month long setup. While the Wall Street punditocracy has been busy grousing about the lousy weather, they have ignored real time data which has shown things heating up. I have absolutely no doubt that Goldman and JPM are well aware of the actual numbers and have been positioning to take advantage of the institutional sheep herd, glued to their CNBC monitors and Bloomberg terminals, wringing their hands about the Taper and supposedly slowing economy.

Sure, the economic gains are grossly and dangerously unbalanced. Stocks regularly forge new record highs. Wild, leveraged speculation with free money pays off every time. There are no consequences for reckless gambling. Saving is punished. Financial crime pays! The top 1% of income earners enjoys a free money bacchanalia of consumptive debauchery. Tangelo - You look fabulous!

The next 9% are having a pretty good time too. The next 10% are ok, and the 10% after that are treading water. Everybody else is in the soup, but the top is doing so well that the top line numbers… they look marvelous.

Initial Claims Improvement Is Slowing- Click to enlarge

Initial Claims Improvement Is Slowing- Click to enlarge

As the Labor Department (DOL) reported it, “In the week ending March 15, the advance figure for seasonally adjusted initial claims was 320,000, an increase of 5,000 from the previous week’s unrevised figure of 315,000.”

This isn’t the number actually counted by the 50 states and reported to the Federal Government. The DOL also reports that number, but the media doesn’t bother covering it. Reality is just too damn complicated for financial “journalism’s” rock stars. Said the DOL, “The advance number of actual initial claims under state programs, unadjusted, totaled 285,316 in the week ending March 15, a decrease of 16,995 from the previous week. There were 300,951 initial claims in the comparable week in 2013.”

The 285,000 claims last week was the smallest number for that week of March since 2007. Claims were down by 17,000 from the week before, which was about the same as the change for the comparable week of 2013, but less than the 10 year average decline of 25,000 for that week. On a year to year basis, claims are down 5.2%. That’s near the recent range of annual change, but that has been slower than the 10% year to year declines that have been prevalent for the past 3 years.

Stock Prices Bubble While Initial Claims Go Flat- Click to enlarge

Stock Prices Bubble While Initial Claims Go Flat- Click to enlarge

The trend of improvement in job losses has gradually slowed over the past two years but stock prices have continued to spiral higher, and so have Federal withholding tax collections, more evidence that enormous gains at the top of the income spectrum are skewing the totals, while hiding the fact that most people are not doing better.

Bubbles may be hard to define, but they’re easy to see when you look at a chart. As the two trends on the above chart continue to diverge, the danger grows, both for the US economy and American workers, and for the stock market. Those who are currently partying at the top should not rest easy.

See the original article >>

Aircraft Disappearances Since 1948

Reckoning with Russia

by Christopher R. Hill

DENVER – Anyone who believes that foreign policy choices come down to Manichean choices between good and evil need to look no further than the Ukraine crisis. It is truly, as former US Secretary of State Warren Christopher said of the Balkans, “a problem from hell.” Worse, resolving it will require a temperament and clarity of thought that has become increasingly rare at a time when leaders must be seen to emote, rather than to reason their way to wise choices.

There is enough blame in this crisis to go around, but that does not mean that there is moral equivalence. The most direct responsibility lies with the Kremlin, which, sadly, is far more interested in manipulating nationalist sentiment to preserve Russia’s crony capitalism than in making a clear choice to join the global economy.

Historically, President Vladimir Putin is by no means the first Russian leader to confront such a choice. But he seems to have a preference for shallow populism – a penchant for seeking ready-made symbols of legitimacy to win over a restive population. That makes him particularly unsuited to leading a great power in a time of trouble.

Russia today combines the worst features of capitalism and statism – conditions that Putin has had more than enough time to identify, analyze, and correct. His grasp of facts and his knowledge of what is wrong indicate that what is missing is the wisdom needed to respond appropriately.

Russia’s energy resources, for example, are fast shifting from an opportunity to a familiar curse as the country fails to make the structural adjustments needed to diversify its brittle economy. As a result, Russia is a world leader in capital flight, while Putin’s authoritarian political style has alienated the intellectual and entrepreneurial classes that are crucial to creating investment opportunities at home.

None of this means that Russia can be turned into a Western state, akin to, say, the Benelux countries or northwest Europe. But Russia does need to resolve its own centuries-long tensions concerning its relationship with the West – tensions that continue to define its leaders’ conception of national identity and interest. Russians’ failure to figure out what their country “means” will result, in the end, in the choice being made for them. Ironically, a Russia that wants to determine Ukraine’s future could find that it is Ukraine – or at least its crisis – that defines Russia’s future.

But the Ukrainian leadership bears its own share of the blame for the crisis. Sovereignty requires the protection provided by effective governments and political systems. In its 23 years of post-Soviet independence, Ukraine has lurched from one political crisis to the next under a succession of governments that were corrupt, inept, or, in former Ukrainian President Viktor Yanukovych’s case, both.

Ukraine sits on rich natural resources and has a talented population. Yet it is one of the world’s worst economic performers. Ukrainians may lament that they are fated to be Russia’s neighbor, rather than, say, Canada’s; but they need to deal with that neighbor and manage the relationship, difficult as it may be. Instead, Ukrainian politicians have alternated between venality and arrogant disregard for Russia’s interests. The prominence within the anti-Yanukovych “Maidan” movement of far-right forces has given Putin a highly effective political cudgel.

Yes, Soviet Premier Nikita Khrushchev ceded Crimea to Ukraine in 1954 (to commemorate the 300th anniversary of the Treaty of Pereyaslav, which unified Ukraine and Russia); and, yes, Boris Yeltsin confirmed Crimea’s status during a period of fraught negotiations to dissolve the Soviet Union and secure Russia’s own statehood. But Ukrainians know well the complexity of the history and the need to tread lightly on Russian sensitivities.

And, lest there be any doubt, the West has hardly covered itself in glory. The European Union surely had the best of intentions in negotiating an Association Agreement with Ukraine, but that prospect had the unintended effect of setting off alarms in the Kremlin, which instantly put Yanukovych in a quandary. By all accounts, Yanukovych has a tough enough time with life’s easy decisions; this one was way over his head.

Finally, the United States’ politicians and pundits deserve a bouquet of dead flowers. No issue that enters the mosh pit of American politics can escape being framed in terms of domestic partisanship. But the future of Ukraine – and of Russia – is not a game that any US leader can win or lose.

The West has no choice but to impose sanctions on Putin’s Russia, and they will now come fast and furious. But they are unlikely to be anything more than punitive, with no coercive power to reverse facts on the ground in Crimea.

A sanctioned Russia – and a Russia that maintains its own set of sanctions – will be the new reality. But the great historical task remains to coax Russia back in the direction of membership in the international community. That means maintaining the dialogue between Secretary of State John Kerry and Foreign Minister Sergei Lavrov and seeking opportunities – Syria? North Korea? – for cooperation in a multilateral context.

At a time when the instinct is quite understandably to throw the book at the Russians, real statesmanship will be needed. To use the cliché of the month in Washington, everybody needs an exit ramp. The question is whether there are enough good drivers.

See the original article >>

The Wolves of Wall Street

by Robert Skidelsky

LONDON – “What a commentary on the state of twentieth-century capitalism,” mused “motivational speaker” Jordan Belfort as he looked back on his life of fraud, sex, and drugs. As head of the brokerage firm Stratton Oakmont, he fleeced investors of hundreds of millions of dollars in the early 1990’s. I saw Martin Scorsese’s film The Wolf of Wall Street and was sufficiently intrigued to read Belfort’s memoir, on which the screenplay is based. I learned quite a lot.

For example, the scam known as “pump and dump,” which netted Belfort and his fellow Strattonites their ill-gotten gains, comes into much clearer view in the memoir than it does in the film. The technique works by buying up the stock of worthless companies through nominees, selling it on a rising market to genuine investors, and then unloading all of it.

It was not just small investors who were ruined; what stands out is the greed and gullibility of the rich who were sold the same rubbish by the “young and stupid” salesmen Belfort preferred to hire. Belfort was (is) obviously a super-slick snake-oil merchant, brilliant in his trade until drugs ruined his judgment.

Belfort, once again selling the elixir of success after a brief stint in prison, professes to feel shame for his behavior; but I suspect that deep down his contempt for those he swindled outweighs any sense of remorse. In a recent book, Capitalism in the Twenty-First Century, the economist Thomas Piketty describes Stratton Oakmont as an example of “meritocratic extremism” – the culmination of a century-long passage from the old inequality, characterized by inherited wealth and discreet lifestyles, to the new inequality, with its outsize bonuses and conspicuous consumption.

Belfort has been described as a perverse Robin Hood, robbing the rich to give to himself and his pals. The rich were the old-money Protestant establishment whose members had lost their skills for protecting their wealth, which was therefore rightfully forfeited to street-savvy up-and-comers – mainly Jewish – amoral enough to help themselves to it. But Stratton Oakmont’s peculations were hardly an exception on Wall Street. As a good friend, who was an SEC regulator for 20 years, told me when I asked about the extent of fraud, “I found it to be pervasive. The system simply makes it too easy, and human nature colludes on both sides. Greed is the source of all cons.”

The Wolf of Wall Street was a predator, but so were all those reputable investment banks that shorted the products they were selling, and the retail banks that offered mortgages to unviable borrowers, which they could then repackage and sell as investment-grade securities. They were all wolves in sheep’s clothing.

A decent banking system has two functions: to look after depositors’ money and to bring together savers and investors in mutually profitable trades. Savings are deposited with banks because they are trusted not to steal them, and custody has a price. The deals that banks arrange between borrowers and lenders are the lifeblood of modern economies – and risky work for which bankers deserve to be well rewarded. But any money that bankers earn over and above the cost of compensating them for providing an essential service represents what former British regulator Adair Turner calls “social waste,” or what used to be described as “usury.”

It is not the extent of the financial system that should alarm us, but its concentration and connectivity. In the United Kingdom, an ever-increasing share of bank assets has been concentrated in the five largest banks. Standard economic theory tells us that excessive profits are the direct result of concentrated ownership.

Connectivity is the link between banks. These links can be locational, as in Wall Street or the City of London. But they became global through the development of derivatives, which were supposed to increase the stability of the banking system as a whole by spreading risk. Instead, they increase the system’s fragility by correlating risk over a much larger space.

As a paper by Andrew Haldane of the Bank of England and the zoologist Robert May points out, derivatives were like viruses. Financial engineers and traders shared the same assumptions about the risks they were taking. When these assumptions turned out to be false, the entire financial system was exposed to infection.

Concentration and connectivity reinforce each other. Two-thirds of the recent growth of banks’ balance sheets in the UK represents internal claims among banks rather than claims between banks and non-financial firms – a clear case of money breeding money.

Reformers want to cap bankers’ bonuses, create firewalls between banking departments, or (more radically) limit a single bank’s share of total banking assets. But the only durable solution is to simplify the financial system. As Haldane and May put it: “Excessive homogeneity within a financial system – all the banks doing the same thing – can minimize the risk for each individual bank, but maximize the possibility of the entire system collapsing.” As long as banks can make a profit from trading, they will continue to expand derivatives in excess of any legitimate hedging demands from non-banks, creating redundant products whose only function is to make profits for their inventors and sellers.

How to curtail derivatives is now by far the most important topic in banking reform, and the search for solutions should be guided by the recognition that economics is not a natural science. As May recounts: “The odds on a 100 year storm do not change because people think that such a storm has become more likely.”

In financial markets, the odds do depend on what people think. The less thinking they have to do, the better. Jordan Belfort was partly right: people who go into finance should not be too clever.

See the original article >>

Joe Friday-Commodities rally hasn’t proven “new” bull market in play

by Chris Kimble

CLICK ON CHART TO ENLARGE

No doubt several commodities have shot up like a rocket ship in the first 90 days of 2014. Below are the top 10 performing commodities YTD.  On the flip side, when looking back over the past 3 years, commodities performance has been anything but impressive... actually they've been a place to avoid!

CLICK ON CHART TO ENLARGE

The top chart reflects that the CRB index over the past few years has been contained by sideways channel (A). The rally so far this year took the CRB index up to its 61% Fibonacci of the sideways channel and looks have created a "Doji Star" topping pattern at (1) and a short-term support line could be giving way.

Joe Friday, just the facts....The rally in commodities in 2014 hasn't proven a new bull market in commodities is at hand, as it remains inside of a sideways channel.

CLICK ON CHART TO ENLARGE

Is the hottest asset on the planet cooling off? The Power of the Pattern shared with members of late that Coffee looking to be peaking and for those members comfortable with doing so, shorted coffee at key Fib resistance, while 80% of investors were bullish. In just days, Coffee has lost 18% of its value!

See the original article >>

The Facts about the Fed’s Dangerous Credit Bubble

by Bill Bonner

Treading Water on Borrowed Money

As promised, today we enter the time that hasn’t come yet … the point where the poor camel’s back gives way.

On Thursday, the Fed announced it would withdraw another $10 billion of artificial demand from the US bond market. And Janet Yellen let slip that the Fed would consider raising short-term interest rates about six months after QE ends. The Dow fell 114 points. Gold dropped $17 an ounce. What to make of it?

You’ll recall that, as long as ZIRP (zero-interest-rate policy) continues, the Fed is draining more and more resources from the future. It encourages people to borrow – by dangling near-zero interest rates in front of them. This debt must be serviced and retired from future earnings. This reduces the amount of capital available for current wants and needs. Thus the future is placed in debt bondage to satisfy the desires of the here and now.

The whole world is in on it. With total global debt of $100 trillion, even if the world could set aside $5 trillion a year, it would take about 30 years to pay off the debt (including interest at “normal” rates). But the world cannot set aside $5 trillion a year. It can’t even stumble along at break even. Instead, every year it needs an extra $5 trillion of borrowed money (net) just to stay at current levels of unemployment, asset prices, consumption and interest rates!

In other words, today, instead of paying down the past debt, we borrow more from the future just to stay in the same place.

After the Highs, the Lows

The question on the table the other day: How much future is left?

We didn’t have an answer. Today, we tackle an easier question: What will the future look like when it comes? We refer, of course, to that part of the future when the you-know-what hits the fan.

As we began to explain two days ago, the typical result of asset price inflation is asset price deflation. That much is guaranteed. And it could begin any day. US stocks were the main beneficiaries of the Fed-induced credit bubble. They will, most likely, be the main victims when the credit bubble bursts. Then the record highs of the recent past will be matched by record lows.

Nature loves symmetry. That’s just the way it is. What goes up must come down. Booms in margin debt, stock buybacks, junk bond issuance, and stock and bond prices will all be followed by terrible busts.

This is as it should be. It is natural. It is healthy. The junk is flushed out … the bad decisions and mistakes are cleansed … economic life can go on. A new boom can begin.

Of course, a real recovery would moderate the bust. Higher incomes, higher sales, higher profits – all contribute to the kind of growth that makes debt less of a burden.

No Recovery

Do we have a real recovery?

The official statistics tell us we have the weakest recovery since the Fed began instigating them. But a closer look at the figures tells us that there is no recovery at all. Auto sales, house sales, household incomes – all are either flat or falling. You have heard, of course, that the unemployment level has fallen to 6.7%. You have also heard, we suppose, that much of the drop is attributed to older people who have simply retired.

But it isn’t true. Instead of retiring, old people have held onto their jobs like drowning men clutching to their life preservers.

The numbers tell the tale. The age group that has contributed most to the falling labor participation rate is the group in the prime earning years: 25 to 54. Workers over the age of 55, on the other hand, have actually increased their participation in the labor pool. They added 3% to the labor force; the younger group subtracted 4.7%.

Why would older people want to keep working? The obvious answer: They don’t have enough money to retire. Young people, meanwhile, need to work. There is no question of retirement. But they can’t find jobs.

In other words, the data used to prove that the economy is well and truly recovering proves just the opposite. And here’s something else: The failure to bring a real recovery is the only thing allowing the bubble to continue expanding …

See the original article >>

Meat Prices Go Hog-Wild

by Pater Tenebrarum

A Shrinking Meat Supply

As Agweb informs us, fears shrinking meat supplies have sent both the prices for cattle and hogs into the stratosphere recently:

“Cattle futures rose to a record as ranchers struggle to boost the U.S. herd from a 63-year low, and hogs climbed to a 34-month high after a virus that kills piglets spread, spurring concerns that meat supplies will shrink.

Beef output in the U.S., the world’s top producer, will fall 5.3 percent this year to 24.35 billion pounds, the lowest since 1994, the Department of Agriculture has forecast. At the start of this year, the cattle herd fell to 87.7 million head, the lowest since 1951, following drought and high feed costs. Porcine epidemic virus has killed more than 4 million pigs, according to an industry group.

This month, the USDA lowered its 2014 forecast for red-meat production and boosted the outlook for cattle and hog costs. Higher meat prices will raise expenses for retailers, while grocery shoppers will pay as much as 3.5 percent more for meat this year, compared with a 1.2 percent increase in 2013, the government projects.

"Total beef production is going to be down, and that’s one of the few commodities that we’re projected to see the supplies tighten this next year," Don Roose, the president of U.S. Commodities Inc. in West Des Moines, Iowa, said in a telephone interview. "In hogs and the cattle, the supplies are expected to continue to stay tight all the way into the spring. Funds are piling into the long side."

(emphasis added)

There can be no doubt of course that concerns about tighter supplies have strongly supported the recent rally in prices. And yet, this is certainly not the first time that parts of the food industry were plagued with supply concerns. Events like those described above, such as droughts and illnesses befalling herds happen quite frequently. So we are left to wonder whether prices would have also attained the truly dizzying heights recently recorded in the absence of money printing by the central bank. We would suggest the answer to this question is clearly no.

Below we show both the daily active futures charts of lean hogs, live cattle and feeder cattle, as well as 25 year long term charts of their respective prices immediately below the daily charts. As can be seen, prices have never been this high and the recent advances have been huge in the historical context. Luckily for the government,  food prices are excluded from the 'core' inflation measure, so the undoubtedly higher grocery bills of consumers won't rudely intrude on the fiction that money printing has no effect on prices.

Moreover, even headline CPI is unlikely to reflect these moves in prices, due to the substitution trick: instead of comparing apples to apples (or in this case, beef to beef), the government simply assumes that consumers will buy less of what has increased in price and therefore will reduce its weight in the basket of goods in favor of goods the prices of which have risen less. It is a very neat way of pulling the wool over everyone's eyes. There may for example be a smaller weighting given to beef, replaced by a higher weighting for chicken. Should chicken prices and other meat prices also rise, consumers will one day presumably be assumed to be eating cat food.

Always keep in mind though that 'CPI' and other 'price index' measures are nonsensical anyway. The mythical aggregate 'price level' does not exist: there is no objective standard by which prices can be measured, as money itself is subject to supply and demand as well. Supply and demand are thus relevant both from the goods and the money side. There is no 'fixed' item that could serve as a yardstick for measurement. Nevertheless, it is of course true that the purchasing power of money changes over time – it is merely not possible to isolate the extent to which price movements are due to influences from the goods side and from the money side. All we know with apodictic certainty is that without fractional reserve banking and central banks, prices would be orders of magnitude lower than they actually are.

The Charts

Let us move on to the chart of meat prices, starting with hogs:

Lean Hogs, DailyLean hogs, June contract, daily: hog prices go hog-wild – click to enlarge.

Lean Hogs, LTA 25 year chart of lean hogs prices. Prices are at a record high – click to enlarge.

Live Cattle, DailyLive Cattle, daily (June contract) – recently cattle prices attained a new all time high as well – click to enlarge.

Live Cattle, LTLive cattle, long term – prices over the past 25 years – click to enlarge.

Feeder Cattle, DailyFeeder Cattle daily, May contract. Here too a new all time high as recently been recorded – click to enlarge.

Feeder Cattle, Long TermFeeder cattle long term – the past 25 years. A decade ago, no-one would have thought that today's prices would be seen in just ten years time – click to enlarge.

Conclusion:

Who knows, maybe cat food isn't tasting all that bad anyway?

See the original article >>

The Important Role of Expectations in the Beef Industry

By: Derrell Peel

Cattle and beef prices are at record levels in every industry sector, from cow-calf to retail beef prices. These record prices are obviously supported by a very unusual set of supply and demand circumstances.

So far in 2014, markets- especially fed cattle and wholesale beef markets-have displayed unprecedented volatility as industry participants try to sort out these unusual market fundamentals in a very dynamic market environment.
Both producers and consumers are reacting, not only to current record prices, but also to their evolving expectations for market conditions over the coming weeks, months and years.

Much attention is focused on the low cow herd inventory and the need to rebuild.

After many years of liquidation, the result of a variety of factors impacting the beef industry, the current situation reminds us that it is the cow-calf sector that is primarily responsible for supply in the beef industry. Until cow-calf producers can and will expand the cow herd, the industry’s ability to maintain beef production will be limited.

Cow-calf producers make decisions about herd rebuilding by considering, not only current price levels, but also their expectations about how high prices will go and how long they will persist.

The cattle industry has a long history of production and price cycles so producers recognize that high prices now will likely lead to lower prices at some point in the future…it’s the old adage that the best cure for high prices is high prices.

However, the current situation is one of excess liquidation due to external factors that have taken cattle inventories to a much lower level than would have otherwise happened.

The beef cow herd was poised to begin expansion in early 2011, prior to the last three years of drought. The beef cow herd then was some 1.8 million head larger than today. Moreover, the last cyclical expansion began in 2004 with a beef cow herd of 32.5 million head, with some 3.49 million more beef cows than today.

That expansion was brief and truncated by feed and input market shocks; recession; and drought that contributed to the subsequent liquidation since 2007. The path to the current herd level was long and the recovery will similarly take several years, which should factor into producer expectations for most of the rest of the decade.

Demand is also affected by consumer expectations.

There is considerable industry concern about how beef demand will react to the growing pressure for higher wholesale and retail beef prices. So far it appears that beef demand is holding up well.

Pork supplies are dropping now as a result of the PED virus and higher pork prices ahead will help support higher beef prices. However, abundant broiler supplies and relatively cheap poultry prices have, somewhat surprisingly, led to little substitution of chicken for beef so far.

Consumers may be reacting differently to higher beef prices, in part, because of the expectations they have for the future.

Considerable media attention has been drawn to the fact that beef prices will likely be high for an extended period of time. If consumers believed high beef prices were a short term impact, they would very likely avoid the high prices and substitute away from beef. However, the prospects for high prices for an extended period of time may be causing consumers to have more of a "get it while you can before the price goes even higher" attitude.

Consumer preferences do not change easily or quickly. Consumers resigned to higher beef prices will make some adjustments but will continue to purchase beef.

See the original article >>

Control your risk with simple and winning rules to generate significant capital growth


Super Stocks Intestazione

We are happy to announce an interesting offer, a new service that will surely be of significant attention by all the experts.
We are now able to offer to a small number of selected investors the signal service or managed accounts service on the stocks of Dow Jones, using our Super Stocks strategy. Super Stocks is a clone of Super Commodity, works alike and with the same fixed and non-optimized parameters, obtaining very good results even on all the stock markets.
We offer free signal service for Super Stocks until the end of March, then we offer it just $ 49 for the entire month of April.

Please send me your email address so I can invite you on my server to do the demo. Mail me to take the offer and start the free service until the end of March michele.giardina@quantusnews.com
SIMPLE AND STRICT TRADING RULES
 
With our Super Stocks and Super Commodity strategies can operate on all markets with a simple, safe and reliable method, generating significant capital growth, with simple and strict trading rules and risk management rules.
 
BUY LOW AND SELL HIGH!
 
Super Stocks and Commodity strategies wants to be a solid reference point for all those investors which want to approach all markets world with a robust tool with low risk levels.
          
This strategies works automatically searching for specific patterns around markets, those highly profitable patterns with a good success percentage. These graphic formations demonstrated during the years to be turning points in robust and reliable manner. Super Stocks and Commodity were born in order to use these points as very good launch points for its trades.
           
Super Stocks and Commodity must be considered a pattern recognition systems which searches graphic formations with preselected features. The strategies uses six different patterns which determine particular rules the systems uses to manage trades.


Super Commodity Intestazione


Trade2
These strategies have the undeniable advantage to sell the highs and buy the lows. In fact, they look for the turning points of the market at the end of the waves, taking the highs and lows as stop loss. In this way, when the set-up is correct, we often see the price run in favor of the trade, reaching very often and very quickly the profit target.
 
Patterns acronyms are T1, T2, T3, T4, D1 and TR. These determine particular rules the strategy uses to manage trades. The pattern set-up is made ​​after the markets close and any new signals are used in the next market session.
Trade1
     

MANAGED ACCOUNT SERVICE
FOR BOTH STRATEGIES
Contact Me michele.giardina@quantusnews.com

TRADING SIGNALS SERVICE
FOR BOTH STRATEGIES
Contact Me michele.giardina@quantusnews.com


Material in this post does not constitute investment advice or a recommendation and do not constitute solicitation to public savings. Operate with any financial instrument is safe, even higher if working on derivatives. Be sure to operate only with capital that you can lose. Past performance of the methods described on this blog do not constitute any guarantee for future earnings. The reader should be held responsible for the risks of their investments and for making use of the information contained in the pages of this blog. Trading Weeks should not be considered in any way responsible for any financial losses suffered by the user of the information contained on this blog.

Control your risk with simple and winning rules - Free Trading Alert For 26 March

   
Super Stocks Trading Signals Report

Latest Free Trading Alerts for 26 March Download Historical Results
Open position value at 25 March $ 12,268.65 2014 P/L   +3.87%
   

Mixed long/short open position
Today no new entry orders, new orders for tomorrow.

5 Open Positions 
3 Long 
2 Short  
5 with Stop Loss at breakeven

In true signal service, attachments reports are shipped to customers also via email, in the evening after the markets close. Those who wish to receive them during the demo, please send me their email address.


I simulated 25% margining and modified initial  capital to $ 500K


1296672115_Stocks
Download Super Stocks Tading Signals for 26 March

1296672488_Chart_4
Download Super Stocks Evening Comment 26 March

   
We are happy to offer free signal service for Super Stocks until the end of March Please send me your email address so I can invite you on my server to do the demo. Mail me to take the offer and start the free service until the end of March michele.giardina@quantusnews.com


Material in this post does not constitute investment advice or a recommendation and do not constitute solicitation to public savings. Operate with any financial instrument is safe, even higher if working on derivatives. Be sure to operate only with capital that you can lose. Past performance of the methods described on this blog do not constitute any guarantee for future earnings. The reader should be held responsible for the risks of their investments and for making use of the information contained in the pages of this blog. Trading Weeks should not be considered in any way responsible for any financial losses suffered by the user of the information contained on this blog.


Follow Us