Thursday, February 24, 2011

Nasdaq Bounces at 50-Day...Again

by Bespoke Investment Group

For the second time in as many days, the Nasdaq Composite has staged an intraday rebound after breaking below its 50-day moving average (DMA).  The index is now on pace to close above the 50-DMA, thus extending the streak of consecutive closes above its 50-DMA to 120 trading days.  This is the eighth longest streak in the index's history, and the longest since 1997.  The Nasdaq's longest streak of consecutive closes above the 50-DMA was 227 trading days from August 1982 to July 1983 when the Nasdaq rose 86%.


Continue reading this article >>

Stocks Bear Market Beginnings, There Goes the First Sector


Bear markets begin when something fundamental breaks. Usually the sector initially affected will roll over before the general market and tends to be a warning sign of what lies ahead.

The last bear market was triggered when the credit bubble created by Greenspan's foolish monetary policy burst. It was exacerbated by Bernanke's foolish attempt to debase the currency and reflate the bubble. All he succeeded in doing was to inflate oil to $147, which put the finishing touches on an already crumbling economy.

The market gave us a warning when the financials began to diverge from the rest of the market. Considering that the banks were one of the leading sectors during the `02-`07 bull the fact that they couldn't follow the rest of the market to new highs after the February `07 correction was a big red flag that the bull was on its last legs.

I've been saying for more than a year now that the unintended consequences of QE would be to spike inflation, which in turn would poison the global economy. I knew all along that Ben was never going to create any jobs by printing money and of course he hasn't.

So if inflation is going to sink the economy and kill the stock market we should see warning signs from the sectors most affected by rising inflationary pressures, just like the banks warned us in `07 that the fundamentals were broken.

Sure enough I think we are starting to see those warning signs. 

Emerging markets have been the hit hard by food inflation. We are now seeing food riots in many third world countries. Emerging markets just like financials during the last bull were one of the leading sectors. EEM is now starting to diverge from the rest of the global stock markets. It's now on the verge of breaking back below the November cycle low.

The other sector that is extremely sensitive to inflation is the transports. When energy costs spike shipping companies profit margins are squeezed. The last two days have seen the Dow Transports fold under the pressure of surging oil prices. Keep in mind oil is only on the 17th day of its intermediate cycle. That cycle lasts on average 50-70 days. I think we are going to see $5.00 gasoline by the time the dollar collapses into its three year cycle low later this spring.

If the market can recover from the recent correction and make new highs I don't expect the transports will be able to follow. That will set up a Dow Theory non-confirmation and most bear markets begin with a Dow Theory non-confirmation.

China is already in a bear market. I think most emerging markets have probably topped and I doubt the rest of the global markets have more than 2 or 3 months left before the next leg down in the secular bear market begins.

I think the brief party created by Bernanke's printing press is about to come to an end.

Natural Gas: A Cure for America's Irrational Oil Addiction?

By JOSEPH LAZZARO

If the price of oil, currently at $99 per barrel , shoots above $100 on continuing political and social change in the Middle East, this will be the U.S.'s third oil shock since 1970 -- the fourth if you count the $147.27 price surge on speculative buying in 2008. The first two oil shocks were in 1973 and 1979 .

Whether this is the third or fourth shock is academic because either way it's bad news for the United States.

Will U.S. policy makers ever learn? The inanity of the nation's energy policy -- indeed, non-policy -- boggles the mind. The U.S., the largest, most-technologically advanced economy in the world, is at risk of being tipped into recession -- again -- due to its over-reliance on oil.

More Drilling Won't Prevent Another Oil Shock

Investors and Americans in general should not delude themselves regarding the U.S.'s oil production capabilities. The ominous reality? The country can't meet its daily consumption needs of roughly 18.7 million barrels per day (bpd) through increased drilling, so it has to import to make up the deficit. In November 2010, the U.S. imported an average of 8.25 million bpd , about 2 million of which came from Middle East oil producers.

Middle East unrest could send oil above $125 per barrel this spring, and that would probably push the average U.S. price for regular unleaded gasoline -- currently $3.25 per gallon -- above $3.50. Add the normal price increase stemming from the summer driving season, and the price could push past $4 per gallon by the Fourth of July.

This assumes that oil's price tops around $125 per barrel. There are other, more-sobering scenarios. Nomura Holdings Wednesday forecast that if Libya and Algeria halted production, oil could peak above $220 per barrel.

Natural Gas: A Better Way
 ?

An oil price above $200 would most certainly tip the U.S. into another recession, just as oil price surges did in 1973 and 1979 .

However, it need not be this way. If the U.S. were to implement a rational energy policy, it could achieve energy independence and enhance its foreign policy flexibility.

One solution is natural gas. Abundant, domestic, price competitive, clean -- natural gas has many advantages over oil.

Abundance is perhaps at the top of the list. The Potential Gas Committee (PGC) estimates that the U.S. has 1,451 trillion cubic feet (Tcf) of recoverable natural gas, out of a total natural gas resource base of 2,119 Tcf, good for about a 100-year supply (less if natural gas consumption increases). Also, of the 22.8 Tcf of natural gas the U.S. consumed in 2009, 90% was produced in the U.S.
Federal tax policy could speed the development of new natural gas vehicle designs that place bulky natural gas tanks under the vehicle's frame, in dead space. It could also help build the natural-gas station filling network, which in the U.S. currently totals only 1,100, compared to more than 160,000 gasoline stations.

While the price of natural gas -- currently about $2.50 per gasoline gallon equivalent(GGE) in Los Angeles, $2.30 in New York City -- would rise with its increased use as a transportation fuel, it's likely to remain competitive with gasoline. Most U.S. motorists know the days of $1.50 gasoline are ancient history, but very few are prepared for a price closer to $5. Given current global growth trends, $5 is looking more likely this decade, and that will help keep natural gas competitive.

To be sure, new natural gas vehicles won't hit auto showrooms soon enough to save the nation from the impact of any oil shock this year, but the sooner the nation increases the number of natural gas vehicles on the road, the better insulated it will be from the next oil shock.

Congressional Action Needed


Congress should implement vehicle tax credits that encourage the production and purchase of natural gas vehicles, with the goal of having at least 50% of the new vehicle fleet -- about 6 to 7 million vehicles per year -- running on natural gas by 2020.

Meanwhile, the shift toward natural gas in bus, taxi, and truck fleets and as an energy source for industrial, commercial, and residential uses will continue. In these energy consumption areas, the nation is making the prudent choice.

It's pointless to debate whether Big Oil has played a role in preventing increased natural gas use -- both as a transportation fuel and for other uses. We know that most oil companies benefit from a higher oil price. However, many also have natural gas operations that would benefit from increased U.S. consumption of natural gas. The point Congress should focus on is that if by using too much oil, the oil companies are strong and the U.S. economy is weak, the move has to be away from oil and toward natural gas.

In addition, greater use of natural gas will also enhance the nation's foreign policy flexibility. Currently, the U.S. has to balance competing -- and at times conflicting -- demands in the Middle East, and is ever-wary not to offend key oil suppliers. A U.S. that does not import oil from the Middle East doesn't face that potential cross-pressure.

What's more, although the natural gas sector is not as job-intensive as the oil sector, greater use of natural gas would increase domestic jobs. That would mean more dollars re-circulating in U.S. towns and counties -- something that should benefit local economies and support U.S. GDP growth.

The U.S. has a great deal to gain and very little to lose from increased use of its abundant, domestic natural gas for its transportation energy needs, and for other energy needs. And that sure sounds like the rational choice compared to debating whether the price of oil will be $60 or $160.

Continue reading this article >>

Survivor Trading System - Trades of 23 February

I trades di Survivor System del 23 Febrraio. I risultati storici di Survivor System small version sono disponibili ai seguenti link: http://www.box.net/shared/static/giq7mp90fq.xls, http://www.box.net/shared/6koqmtmnsb I risultati storici e MTM di alcuni altri nostri trading systems e portfolio systems sono a disposizione al seguente link: http://www.box.net/shared/5vajnzc4cp

Trades of Survivor System on 23 February. Historical results of Survivor System small version are available at the following links: http://www.box.net/shared/static/giq7mp90fq.xls,, http://www.box.net/shared/6koqmtmnsb. Historical and MTM results of our some other trading systems and portfolio systems are available at the following link: http://www.box.net/shared/5vajnzc4cp

GC  

Material in this post does not constitute investment advice or a recommendation and do not constitute solicitation to public savings. Operate with any financial instrument is safe, even higher if working on derivatives. Be sure to operate only with capital that you can lose. Past performance of the methods described on this blog do not constitute any guarantee for future earnings. The reader should be held responsible for the risks of their investments and for making use of the information contained in the pages of this blog. Trading Weeks should not be considered in any way responsible for any financial losses suffered by the user of the information contained on this blog.

Price of Oil to Natural Gas Expands to Record Levels

by Bespoke Investment Group

With the price of natural gas remaining below $4 even as NYMEX crude is rising above $100 per barrel, the ratio of the price of oil to natural gas is currently right near record highs.  Prior to the last five years, large spikes in this ratio were usually a sign that the price of oil had gotten ahead of itself.  However, in recent years the historical relationship has become unhinged due to large discoveries of natural gas reserves in the United States.  Given the fact that natural gas is harder to transport, there is less of a market for US supplies outside of the country.

The big question with the ever increasing ratio between oil and natural gas is why more hasn't been done to exploit the discrepancy.  It's now been nearly three years to the day since oil first spiked above $100 per barrel.  Since then we have heard incessant talk and catchphrases about how the US needed to become more energy independent and create alternative domestic sources of energy.  What's been missing in all this talk, however, is meaningful action on the part of policy makers, corporations, or automakers to create alternative uses for all this excess fuel which is practically burning a hole in the nation's pocket.  

As a result, we now find ourselves at the same place we were three years ago, with oil over $100 per barrel and more natural gas than we know what to do with.  The only difference this time around is that we're now in the almost laughable position of being glued to the events in the Middle East and pinning our hopes on dictators like Moammar Gadhafi acting rationally and keeping our fingers crossed that other non-democratic regimes in the region can maintain their grip on power and keep the oil flowing.  

Continue reading this article >>

World corn stocks to fall again in 2011-12 - IGC

by Agrimoney.com

World corn inventories are to fall for a third consecutive season in 2011-12, the International Grains Council said, in a report raising estimates for ethanol use, and lifting hopes for this year's wheat harvest.
The influential intergovernmental group, in its first outline forecast for the forthcoming corn season, said that production was likely to beat the all-time high of 813m tonnes set in 2009-10.
"Given initial planted area assumptions and, assuming trend yields, larger maize (corn) harvests are forecast in several key producers, including the US and China," the council said.
However, with demand "strong", the uptick in production may not be enough to rebuild supplies, currently heading towards their lowest for four years.
"Unless yields are exceptionally high… maize availabilities are projected to remain tight, with closing stocks set to fall for a third successive year."
Industrial demand
The comments came minutes after the US Department of Agriculture forecast that corn stocks in America, the top producer of the grain, would rise by a "modest" 190m bushels to 865m bushels, staying below the psychologically important 1bn-bushel mark for a second season.
The USDA forecast reflected in part greater expectations for corn consumption by ethanol plants, which the IGC also flagged in lifting by 2m tonnes its estimate for industrial use of the grain in current 2010-11 season.
The revision reflected "increased demand from US ethanol and high fructose corn syrup manufacturers", the IGC said.
The council trimmed by 1m tonnes to 119m tonnes its forecast for world inventories at the end of this season, just 2m tonnes from the recent low set in 2006-07, at the start of the last crop price spike.
Wheat prospects 
For wheat, the IGC lifted by 2m tones to 672m tonnes its estimate for the 2011-12 world harvest – leaving it second only to the record 2008 crop.
Sowings will reach a 130-year high of 224m hectares.
Nonetheless, with consumption also rising, "global wheat supply and demand is projected to be broadly in balance".

Continue reading this article >>

Throwing in the Towel Already?

by Bespoke Investment Group

It didn't take much, but after a sell-off of less than 3% in the S&P 500, individual investors are quickly throwing in the towel.  This week's weekly sentiment survey from the American Association of Individual Investors (AAII) showed that bullish sentiment declined from 46.58% to 36.63%.  This is the largest weekly drop since November (the last time the S&P 500 had a 3% sell-off), and it brings bullish sentiment down to its lowest level since the start of September.  With investors so quick to turn bearish after just a 3% decline, we can only imagine what will happen if the recent weakness turns into a more meaningful correction.


Continue reading this article >>

Crude Oil Goes SuperNova, $115, $150, $200, Implications for Inflation


The inflation forecast for 2011 warned that the key risks to the forecast were all to the upside and specifically if Crude oil were to go super nova during 2011, subsequent events starting in Tunisia, magnifying in Egypt and now exploding in Libya have sent crude oil prices soaring into the stratosphere as speculators pile into a panic sparked trend, where Brent Crude has now spiked higher to $115 on the spot market, up $40 from the recent trading range of $75 and leaving the US WTI Crude presently lagging behind at $101.


Brent Crude oil of $115 if sustained would translate into an inflation rate of CPI 5%+ as prices at the pumps are ratcheted higher by at least 7p per litre, however the explosion taking place in the middle east appears to be just beginning as the freedom storm turns to the oil rich gulf states with the mafia dictatorship of Saudi Arabia at its head. However it is not necessary for the these mafia chiefdoms to actually collapse, rather the risk alone is enough for speculators to pile in and producers hoard crude oil in lieu of higher future prices, that could send the crude oil prices soaring to first break the 2008 $150 peak and then target a break of $200 amidst a short-lived mega-spike. 

Whilst it is not possible to forecast where crude oil prices will exactly peak, however it is possible to estimate where Brent crude of $150 would translate into an UK CPI Inflation rate of 6%, and $200 of 7.5%, especially given the fact that Sterling today is much lower than where it was during the Commodity spike of mid 2008 as the below graph illustrates that crude oil in sterling is already within touching distance of its all time 2008 high rather than which is suggested by the dollar price that the mainstream press mistakenly exclusively focuses upon.

Continue reading this article >>

Gold and Silver Prices, Getting to Know Crisis Premiums


There’s a term gold and silver investors like to use to describe changes in premiums based solely on changes in the markets and demand for physical metals: the crisis premium.

The crisis premium was most recently encountered at the turn of the new millennium when hundreds of thousands of people stashed record collections of gold and silver to protect against what was supposed to be the worst electronic catastrophe ever.  Bank balances were supposed to go to zero, and computers were to become virtually worthless when the date rolled over to 01/01/00.  Of course, that never happened, no one died, and the sun still rose the next morning.

What we have on our hands now looks to be a crisis premium, but the crisis, interestingly, isn’t showing in the premium.  Instead, it is showing in the price of silver itself.

International Revolution

Because metals are driven by a number of different elements, fear being a large portion of this driving force, the silver markets are responding favorably (for longs) to the world’s newest revolutions.  In Libya, tens of thousands, maybe even hundreds of thousands, have taken to protest.  In Tunisia, the citizens are still searching for freedom. 

These crises obviously scare many investors, particularly those with exposure to areas rocked by riots and in industries where their daily business may be affected by new tensions.  Libya, for example, is a very important piece of the oil trade.  Egypt was a top concern as well, since literally billions of dollars of merchandise and raw materials flow through the Suez Canal.

Physical Price Time Delay

The shock we’re seeing in the paper physical markets can be linked quite easily to international revolution.   We have to consider that the inflows into speculative, market-based silver products are mostly the result of the “give it to me now” mentality.  That is, when fear sets in, investors want to hedge themselves as soon as possible.

In comparing the metal markets and ETFs to the corner coin shop, it is obvious which the faster alternative is.  ETFs can be snatched up in seconds.  In contrast, it isn’t even certain if coin shops will have enough silver to supply just a Wall Street speculator.  Plus, funds are easy, and they don’t even require actually taking delivery of the metal (a benefit to Wall Street, but not so much to an informed commodity investor).

Taking all that into consideration, it is sure that premiums on all physical metals are sure to rise in the coming days.  The move to financial paper silver was breakneck hedging, but it would only be reasonable that these positions will be later unwound and covered by purchases of physical silver.   This kind of market buying and selling is common, even among average gold and silver buyers, because it allows investors to lock in prices down to the very minute before they can then go buy equal amounts of gold or silver in physical form, while simultaneously reducing their paper silver positions.

How high do premiums go?  No one can know definitively, but today’s premiums are awfully low when compared to crisis premiums of the past.  Take that in mind before you delay your next silver purchase.

US cuts hopes for 2011-12 rebuild in crop supplies

by Agrimoney.com

The US Department of Agriculture has cut hopes for a rebuild in crop stocks in 2011-12 - with corn inventories to stay below 1bn bushels – presenting a squeeze sufficient to give farmers record prices for major crops.
The revisions looks set to bring a firmer opening to live trading in Chicago, with the immediate market reaction in Paris to send March wheat from E249 a tonne before the announcement to E253 a tonne.
Joseph Glauber, the USDA's chief economist, forecast "continued high costs" for grains as even a jump of 9.8m acres in American sowings of major crops expected for this year – the largest increase for 15 years - fails to ease significantly tight supplies.
"Even with additional supplies expected this year, it is likely that the tight stocks to use situation will not be entirely mitigated over the course of one or even two growing seasons," he told a USDA forum in the US.
The squeeze, while set to keep margins for livestock producers at "low levels", will present growers with even bigger prices, which will in corn, cotton, soybeans and wheat reach record levels.
Cut to corn stocks guess
The growth in sowings would be led by corn, Mr Glauber said, firming up a preliminary USDA forecast revealed last week, in the so-called "baseline" report, of a rise of 3.8m acres to 92m acres in sowings.
However, even assuming a trend yield of 161.7m bushels per acre, bringing the total harvest to an all-time high of 13.7bn bushels, a significant rebuild in inventories would be prevented by strong exports and firm demand from ethanol producers
Favourable tax treatment means "the incentive for ethanol blending remains strong… and ethanol [is] expected to remain attractive priced relative to gasoline", Mr Glauber said.
US corn stocks will see a "modest" increase to 865m bushels over 2011-12m a cut of 262m bushels on last week's estimate, and representing a historically "tight" level of 6.4% of consumption.
'Tight as well'
Soybean stocks will "remain tight as well", Mr Glauber said, despite a fall in exports in the face of "renewed competition" from Argentina and Brazil.
With sowings limited to a small rise to 78m acres by the rush for corn, inventories will rebuild by a modest 20m bushels to 160m bushels.
"The stocks-to-use ratio is still estimated to be below 5%, indicating a tight market," he said.
 Yield losses
Wheat will end 2011-12 with a stocks-to-use ratio – a key measure of the readiness of a crop's supply and therefore its price potential – of 28.3%, a relatively lax figure, if the lowest since 2007-08 in the run up to the last crop price spike.
Nonetheless, the figure is lower than the 30.4% proposed in the preliminary estimates, and reflected some allowance for the impact of a dry weather on southern Plains states.
"Despite higher planted acreage, wheat production will be affected by dry weather since last fall in the hard red winter growing region and by a return to more normal yields this year," Mr Glauber said.
Price forecasts
He added that, for wheat, the average farmgate price would reached a record $7.50 a bushel, "although prices will likely moderate in the late summer and fall as spring planted crops in the Northern Hemisphere come to market".
Indeed, stronger competition in export markets, after a series of poor crops in 2010-11 will limit US wheat exports to 1.15bn bushels next season, a fall of 12%.
Farmers will receive a record $5.60 a bushel for corn, of $13.00 a bushel for soybeans, and of 110 cents a pound for cotton.
 

Rough Few Days For The Stock Market Bulls....


Markets tend to catch the masses off guard. It's an old story with the stock market. The bull-bear spread has stayed quite high, and actually increasing in the number of bulls, and decreasing in the number of bears over the past few weeks. More and more are getting bullish which explains how the weekly charts got so extremely overbought, especially on the S&P 500 and Dow. High-70 readings on the Dow, and mid-70 readings on the SPX said it was time to reign it in some. 

There was trouble over the weekend in Middle East. This was the excuse, or catalyst, to get those overbought oscillators to unwind lower and allow for some decent selling. Our stock market had been grinding up for quite some time with tiny candle sticks that way day after day.That's the first red flag indicating a pullback isn't too far down the road. Poor MACD's, along with not so great looking RSI's and stochastics, were also red flags to start removing long positions late last week.

All of this led to a big gap down yesterday that tried to come back early on today, but was rejected by the bears. The bulls finally saw it wasn't coming back, thus, a long squeeze was on. Nasdaq fell nearly 80 points in a day as the big caps were slaughtered. The market followed through today, but got grossly oversold on the 60-minute charts, which allowed the indexes to close off the lows. Some stocks, such as Netflix, Inc. (NFLX), Priceline.com Incorporated (PCLN), Research In Motion Ltd. (RIMM), and others took it on the chin again, however. Ugly sticks over the past few days, which saw stocks take out many weeks of gains, if not months, in just those couple of days. Many also lost their 50-day exponential moving averages.
When things give it up, they can do so quickly, and it can take the human brain from complacency to fear very rapidly. That's what causes the long squeeze. Bottom line is, things aren't great for the short-term and there will be lots of bounces, but the near-term trend overall will be somewhat lower.

Only when we lose the 50-day exponential moving averages on the major index charts can the bears get happy for real. This is all just a gnat of selling thus far. Nothing from nothing, really, bigger picture. Sure, some stocks are really crushed, but the overall market hasn't seen anything worth talking about. Just a few percent down off the top. Only if the 50-day exponential moving averages get taken out with force can the bears say we have a genuine selling period we can feel surer about. Until that happens they've accomplished nothing to be blunt. A start for sure, but if they want to see a 10% or more correction, they will need to remove those 50-day exponential moving averages, and then the selling will kick in big time. I'll go over those numbers later on in this report.

Everything has to start somewhere, and the fact that the bears have a nice huge gap to work with on the index charts and on many leading stock charts, they can feel there's hope, after all, for some gains on the short side. It won't be easy getting back through these large open gaps, so the job should be a bit easier to get selling when needed. Bottom line is, the bears have gotten the ball rolling. They must now remove those 50's, and then they have something they can brag about. Until then it's just meaningless selling from overbought.

The key element to understanding a real pullback is whether selling is across the board or not. The market has seen money rotate around that has not allowed for much selling. We're seeing a change of character on that front now. Money has stopped rotating the past several days, which is allowing for more intense selling across the board. It seems as if the big money has decided now is the time to let things unwind for a few weeks, and that would allow for a much better buying opportunity.

Market needs periods of longer-term unwinding of its oscillators if it's ever going to move appreciably higher once again. RSI's can't stay above 70 on the daily and weekly charts forever. It's healthy and necessary to get deeper selling for some weeks. It's no different this time on that front. Notice how long we've been grinding higher. Not good. The deeper we sell over the coming weeks the better off we'll all be for the bigger picture bull. If the selling stops suddenly we'll be overbought in no time once again. For now, the market is following the type of script that has led to stronger periods of selling. As long as we don't see real rotation then the selling will continue for a while longer, even if the oil, gold, and silver stocks keep rocking due to the problems overseas.

Critical long-term support comes in at those 50-day exponential moving averages. On the Nasdaq it's at 2715, where there is also strong support on gap. If the Nasdaq loses 2715 with force the selling will really accelerate. It tried to lose that today, but we were too oversold with 10 RSI's on the Nasdaq 60-minute chart, thus, no success today there for the bears. That's the number to watch for in the days and weeks ahead.

2715 is critical for the Nasdaq bulls to hold. On the S&P 500 the level is further away. 1286 is that number, and we're still quite a ways away. You really need to understand, folks, that unless those 50's get taken out, the bears have accomplished nothing worth talking about. They will work hard in the coming days and weeks to get things accomplished on that front. The Nasdaq would be the first to go if things keep as they, and I, expect them to remain as they are, because the highest froth stocks get taken out first, which are clearly the Nasdaq stocks. The world of no reality lives in the Nasdaq, thus, that's where the bears will look to attack.

The market has started to sell, but nothing has really been accomplished. Selling through critical support is never easy in a bigger picture up trend, but many leading stocks have lost those big time 50-day exponential moving averages. First leading stocks go as they are doing now, and then, ultimately, the indexes go as well. The bears have gotten some of the job done but not all of it. A day at a time folks. Markets are oversold on the short-term charts, thus, as usual, the job won't be easy for the bears, but we do see a change in character for this market, thus, be VERY CAREFUL out there for now.

Cash is a position and where we need to be for the moment.

The art of asset allocation

by Daniel P. Collins

Diversification is a goal of nearly every portfolio manager and trading program. Even long-only mutual funds benchmarked to some broad market index claim to be diversified among large cap, mid cap and small cap equities, and to certain segments of the investing world that qualifies. 
Ssaris Senior Vice President Prav Sambamurti says, "Convergent strategies perform well in a normal market environment with stable to declining volatility when fundamental information is processed and interpreted rationally, whereas divergent strategies benefit from periods of imperfect information."

Sambamurti also points out that many convergent strategies lack the liquidity offered in managed futures. Waksman agrees and says that is one of the reasons for the emergence of managed futures. "Prior to 2008, investments were made on assumptions based on return on investments. Now people are taking into account the risk based on return of investment. If you are taking risk, a liquidity risk, how much should you be compensated for that, how do you quantify that," Waksman asks. 

What that means is that when allocators take into account the greater liquidity risk into certain investments, they would reduce their exposure to those investments as they eat up more risk. If you just look at standard deviation or value at risk, that liquidity risk is not exposed. So, they are allocating a percentage of risk capital based on an inaccurate picture of risk.

Ssaris considers liquidity risk and adjusts allocation to less liquid strategies based on that in addition to the traditional risk measures. 

"You have to take a discount to the rate of return," Waksman says. "For every risk you take, you should be getting compensated."


One of the alternative categories that suffered the most redemptions since 2008 is fund of funds. This strategy performed poorly and many would cite its concentration in convergent strategies that underperformed in 2008 (see "A precipitous drop," below). If they had followed Rosenberg’s model, they would have had allocated more to strategies that excelled in 2008. 

Longtime CTA Salem Abraham looks at it even simpler. He makes the point that most asset classes, besides managed futures, are long the economy and are based on averages. He says investment advisors devise programs that work in average markets, but managed futures performs best when you need it most. 

You don’t wear seat belts to work on a normal day, Abraham says, "you wear seat belts to work in a wreck."

This is so simple, yet it is often overlooked. And it supports Partridge’s view of looking at the return streams of an investment and not the variety within it. 

Even as diverse an approach as managed futures can suffer from periods where underlying conditions create correlations. CTA Bob Pardo pointed this out during the positive performance in 2008. He noted that in an anomaly, nearly all physical commodities were following equities; first up and then down. Managed futures benefited from its ability to go short just as easily as going long. And we know that when the dollar is under stress, managed futures programs can become more correlated as most commodities will benefit from a weak dollar and programs likely also will be long currencies versus the dollar. 

Many CTAs at the time reduced their exposure across all markets sectors due to the increasing correlation.
Following Abraham’s point, you can determine how diversified your portfolio is by asking yourself or your manager(s) a few simple questions. What would happen to this investment if the market crashes? What if interest rates spike 500 basis points? What if the dollar collapses? 

Difficult economic conditions tend to create correlations in asset classes where none previously existed. The key to portfolio allocation is to have investments that will perform well in whatever economic conditions we may face.

Top 10 rules of portfolio diversification

by Michael J Mcfarlin

If there is one thing the 2008 financial meltdown taught us, it is the value of a properly diversified portfolio. The second thing is that if you think you are diversified, you may need to check again. At the time, many thought they were, only to see losses across the board as assets that previously were uncorrelated moved together and sunk many a portfolio.

Today, figuring out what constitutes a diversified portfolio and, more importantly, how to actually assemble one can be a difficult and at times frustrating ordeal; every analyst and investment advisor has a different idea. To help you navigate these treacherous waters, we offer the following 10 rules of portfolio diversification.

1. Start with the end in mind. A diversified portfolio is not a one-size-fits-all product. Instead, it should be personalized, focusing on your personal long-term investment goals while considering your current personal circumstances. According to Michael Loewengart, senior investment strategist at E*TRADE Capital Management, your personal circumstances should take into account your current financial situation, expected future expenses and how far away from retirement you are. "The goal of asset allocation is to make sure the level of volatility in your portfolio is in line with your goals, personal circumstances and tolerance for risk," he says. Additionally, consider your temperament. If high-risk assets make you overly stressed, perhaps it would be better to stick with comparably low-risk alternatives.

2. Aim to reduce overall risk. Portfolio diversification has two goals, this being the first and what most people associate with diversification. If you have multiple assets in your portfolio, even if one is not doing well, you have others that are outperforming. As such, this reduces the overall volatility of the portfolio. "[Diversification] reduces your risk. Instead of being stuck in just one sector that may not do well at times, a diversified portfolio can sustain you and keep you in business," Michael Clarke, CEO of Clarke Capital Management, says.

3. Aim to enhance overall returns. Being able to capitalize in markets that are outperforming and adding to your bottom-line is the second goal of a diverse portfolio. Not only does owning a range of assets protect you in the event that one does poorly, but it positions you to take advantage of ones that perform exemplarily. "We try to have a finger in each of the different sectors because in our experience usually something is working and that one may save the bill," says Clarke.

4. Invest in multiple asset classes. Traditionally, a portfolio was considered diverse if it had a mixture of equities and bonds. As investors are becoming more sophisticated, other assets such as commodities, real estate and foreign currencies are receiving more attention. In order to reduce risk and enhance returns, investments in numerous asset classes help keep correlations among assets in check. Each class has its own drivers and its own speed bumps. Taken together, they help smooth out the ride.

5. Invest in multiple sectors within the asset classes. Just as investing in multiple asset classes reduces risk and enhances returns, so too does investing in multiple sectors within those asset classes. Just including equities, bonds and commodities is not enough as equities have sectors reaching from healthcare to industrial metals, bonds have a variety of maturations and commodities include energies, metals and foods. "You want to be allocated amongst the various market sectors and industries. Across asset classes, you want to have further diversification into the different segments," Loewengart says.

6. Own assets that do well in bull, bear and sideways markets. This point really stresses the need for owning a diverse array of assets. You do not want to place all your eggs in a basket that does well when the stock market is moving up, because that also means your portfolio will do very poorly when that bull market turns into a bear. Instead, it usually is advisable to own assets with a negative correlation in which one asset moves higher while the other moves lower. Examples of this relationship include the U.S. dollar and crude oil as well as stocks and bonds. It is often true that in times of crisis all correlations go to 1.0, but some strategies are more resistant to this. It is wise to look broadly at how various assets perform in different environments.
Commodity Trading Advisor Salem Abraham pointed out following 2008 that nearly all asset classes were long the economy. Managed futures, which are diversified in their own right through being long or short disparate sectors like agriculture, metals, energies, interest rates and currencies, also perform well in periods of high dislocation. Other diversified asset classes had the same negative response to the economic crisis but managed futures did well by taking advantage of fat tail events rather than being punished by them.

7. Have a disciplined plan for portfolio rebalancing. If you have constructed your portfolio properly, it is to be expected that some assets will outperform others and over time begin constituting a larger percentage of your portfolio. That is the time to rebalance and bring your investments back in check with one another. "If you have a disciplined plan for rebalancing in place, then you can capitalize on the different movements that will take place from the different assets in your portfolio," Loewengart says.
He explains that that discipline will enable you to automatically sell out of your outperforming assets and buy into those underperforming. Consequently, you will naturally be selling high and buying low.

8. No "borrowing" among classes except during rebalancing. Trading can become emotional and that can cloud your judgment. It may seem like a good idea to abandon an investment decision that is not immediately paying off or to bolster ones that are doing well. Proceed with caution, because that is a move that catches many investors. The reason for having a rebalancing plan is to remove that emotional element. "When you look at your portfolio, rebalancing with a stated framework is going to give you the discipline that many investors inherently lack," Loewengart says. That discipline helps you do the things that you may not want to do, but are in your best interest.

9. Backtest your portfolio, but consider current market conditions. Backtesting can help you see correlations that exist in your portfolio and can allow you to see how it would stack up in various market conditions. There is a reason, though, that investment advisors are required to say, "Past performance is not indicative of future results." Also, remember there will be periods in the past in which your portfolio would not have fared well.
Past events can provide a framework, but also consider current market conditions to better position your portfolio for future events. We can learn a lot from the past, but current events are shaping
tomorrow’s markets. 

10. Test asset correlations periodically. If there is one thing we can count on in the markets, it’s that they will never stay exactly the same. What was negatively correlated one year can move lock-step the next. Consequently, it is not enough to simply rebalance from time to time; you also need to test the asset correlations in your portfolio periodically to see if anything has changed. As markets change, you need to make informed decisions as to how you need to alter your portfolio to counter those changes. You can’t expect your portfolio allocation decisions to be a one-and-done event; as markets change, so to must your portfolio.

These rules leave a lot to personal judgment and that is the key to success. One additional item to point out is that any allocation to a less liquid asset should calculate that liquidity risk in addition to other risks to achieve the proper allocation.

Your portfolio should fit your needs. Unfortunately in the past not all potential asset classes were available to retail investors. Today, thanks to innovative exchange-traded funds (ETFs) and mutual fund structures, nearly every investor can access commodities, currencies, short and leveraged strategies as well as active strategies including managed futures. Now everyone truly can be diversified.

China steps up silver purchases

By Dr Jeffrey Lewis

Carefully hidden in the depths of a recent Forbes blog was perhaps one of the most important stories for all of 2011, at least for silver. Robert Lenzner wrote that “China’s Industrial and Commercial Bank (ICBC) reports purchases of physical gold and gold-related investments are growing at record setting rates.”

The post goes on, “In January alone ICBC sold 7 tons of gold– almost half the 15 tons it sold in all of 2010. It also sold 13 tons of silver in January– almost half the 33 tons of silver it sold to clients during the past year.”

Of course, it wasn’t much further in the article (it was actually the next sentence) that the media spin begins to show through in a quote from Zhou Ming, the head of the precious metals department of the ICBC. The quote essentially declares gold and silver to be the new speculative market in China after real estate was essentially shut down to leveraging.

Real estate vs. silver
While it is true that silver may be a replacement market for Chinese investors, the products aren’t exactly as much of a substitute for one another as the media would like. Most investors know that real estate is purchased primarily for income, while gold and silver are for wealth protection. That understanding gets lost on the press, even media that is supposed to be finance-related, but it can be shaken off.

The most important part of this story is that even if Chinese investors are finding silver and gold to be an applicable substitute for real estate, investors are obviously worried about inflation. Recently, China recalled information about the status of its real estate markets, and there is little doubt that China’s inflation numbers are equally fudged.

If we are to take China’s numbers at face value, it can be concluded that, at best, the rate of inflation is still several whole percentage points higher than current deposit rates, a sign that the currency is under serious stress.

Perhaps hilariously, though, is that while China inflates like there is no tomorrow, the value of the Chinese currency continues to rise against the US Dollar. It doesn’t get much more obvious. Inflation is an international sickness, and it is only those in metals that are truly shielded from its devastating effects.

Time is running out
While silver and gold are limited in supply, they will always exist. They will not, however, always exist at an affordable price.

While no one could expect that gold and silver would rally in spring, the season that is usually the most forgiving to both stores of value, it is becoming evident that historical trends are easily rewritten by trying times. Silver recently broke $33 per ounce, and gold is looking toward $1400, maybe even $1500 by the end of the weakest season.

It isn’t as though gold and silver are an anomaly, either. Take into consideration the fact that gas prices are at seasonally-adjusted records, despite record oversupply of oil. Shortage, or abundance, there is absolutely no shortage in the desire to inflate world currencies, and we’re already paying witness to the aftereffects.

Continue reading this article >>

Wheat Prices Are Outstanding


The sign on a bank in Western Oklahoma flashed “Wheat - $8.39” last weekend – a price not seen too often in or around the town of Watonga. And as spring-like temperatures in the 70s started bringing dormant wheat to life following a foot of snow only a week earlier, many growers were at a crossroads.

They pondered whether to move stocker cattle off wheat in early March to promote maximum grain development, or graze them out and cash in on high cattle prices. Grazing those steers to 750 lbs. would likely garner over $1,000 at the sale, based off their anticipated $130/cwt. price. And some good wheat yields could still be achieved. But pulling cattle off and pushing for those premium yields and powerful prices could help growers make up for those harvesttime 2010 sales at near $4/bu. before the market surged to $7 and beyond.

It’s a decision many growers make every year, but rarely are prices for wheat, other grains, cattle, hogs, cotton and just about every other commodity so high all at the same time. Wheat prices have remained strong after no changes were made earlier this month in the overall U.S. wheat supply-demand balance sheet for marketing year (MY) 2011-2012. That was despite some offsetting export and stocks changes were made in the supply-demand balance sheets for U.S. wheat classes, say economists at Kansas State University. 

Ending stocks and ending stocks-to-use of U.S. wheat for MY 2010-2011 were projected to be 818 million bushels. The U.S. stocks-to-use projection is markedly higher than the 60-year-low in MY 2007-2008 of 13%. Projected U.S. hard red winter wheat and white wheat exports for MY 2010/2011 were raised 10 million bushels, while hard red spring wheat exports were reduced 20 million. 

USDA projects wheat cash prices in the U.S. to be in the $5.60-5.80 range for MY 2010-2011, up 10¢ on the lower end. So that $8.39 on the Watonga, OK, bank sign reads pretty well. Other than deciding when to pull stockers off wheat pasture, growers must also decide when to make preharvest sales.

Melvin Brees, economist at the University of Missouri Food and Agriculture Policy Research Institute (FAPRI), regularly advises growers to monitor their profit potential for making sales when grain prices are strong. He points out that like with wheat, new-crop cash bids at most Missouri (and Midwestern) locations are also well above these early 2011-2012 average price projections for corn and soybeans.

“This suggests that, although prices seem headed higher, there is downside price risk as well,” says Brees. “Many other factors could contribute to price risk. These include energy prices, dollar value, economic conditions, policy decisions, etc. along with foreign political unrest, livestock disease outbreaks and other disasters to name a few. This creates a complex environment for managing price risk.”

Darrel Good, University of Illinois agricultural economist points out that domestic wheat stocks at the end of the current marketing year (May 31, 2011) are expected to be relatively large, accounting for 33.6% of expected use during the current marketing.  In addition, winter wheat seedings were reported to be 3.7 million larger than seedings in the fall of 2009, he says. 

“Even though the hard red winter wheat crop is not in good condition, there is potential for an adequate crop in 2011 with more favorable spring weather,” says Good, in his farmdoc outlook this week.  “Furthermore, wheat is produced in large quantities in a number of countries so there is opportunity for foreign production to rebound from the depressed level of the past year. 

“Under more favorable spring weather conditions, for example, wheat seedings in Canada could rebound from the low level of 2010.  Russian wheat production was also depressed in 2010 due to severe drought conditions.”

So a lot can happen to impact wheat prices this spring and summer. In fact, they took a 50¢ or better dive this week, possibly due to the recent snowfall over dry fields. No matter what decision growers make on pulling cattle off wheat to maximize grain development, or take advantage of high cattle prices and high wheat prices even with reduced yield from grazed pasture, price volatility remains enormous.

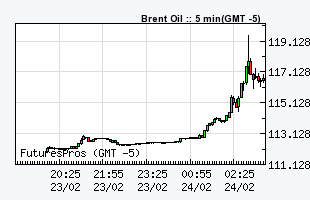
BRENT CRUDE TOPS $119 IN OVERNIGHT TRADE

by Cullen Roche
Big oil spike overnight as brent oil  surges over $8 to top $119.  The latest price was roughly $116, however, the price movements are extremely volatile.  There’s no telling how much higher or lower prices could be in the next 24 hours….


Continue reading this article >>

Stocks vs Managed Futures

Managed Futures Crisis Period Performance

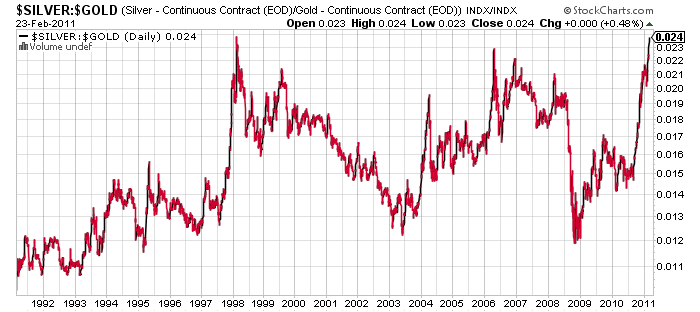
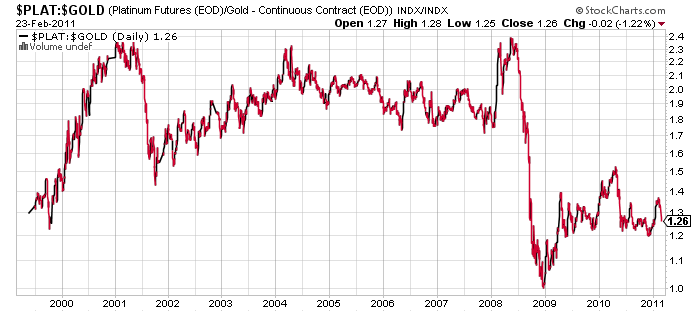
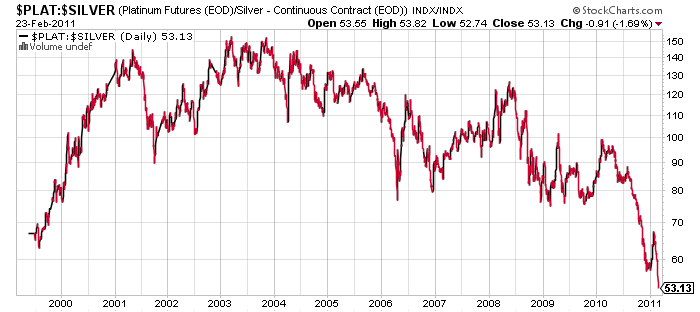
WHAT DO COMMODITY PRICE RATIOS TELL US TODAY?

by Cullen Roche

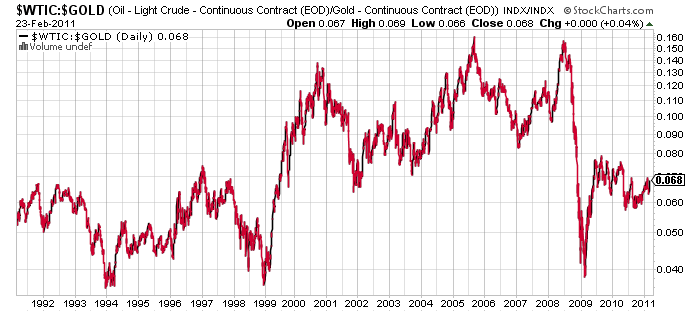
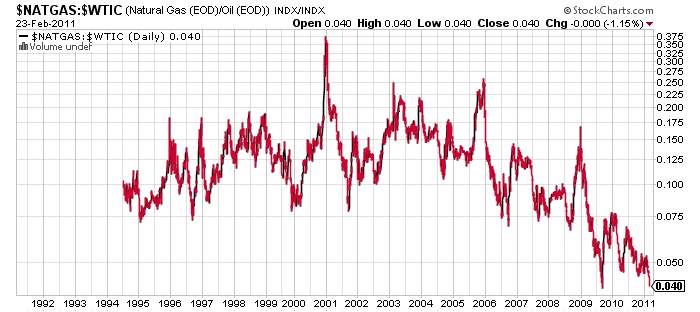
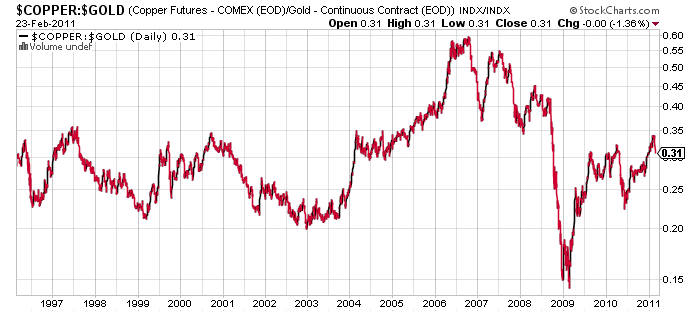
Commodities are notoriously difficult to value which is why commercial traders have a huge demand to hedge and also why many commodity traders prefer to use technical analysis.  Commodity price ratios use technical analysis to provide a glimpse into the historical perspective on prices.  This gives the trader a 30,000 foot view of the relative value of commodity price changes over long periods of time.

While no commodity is a perfect substitute of another it can be helpful to see how closely correlating commodities perform over long periods of time.  This rather simple technique can also provide valuable insights into pairs trades and just generally avoiding grossly over/undervalued positions.  For instance, a trader who is interested in being long precious metals might find the following silver:gold ratio helpful.  The recent surge in silver prices has created an unusual divergence in the two metals.  While a trader might not be inclined to short silver and go long gold, this same trader might conclude that gold is a better relative value long position:

Silver looks expensive compared to gold
Platinum looks moderately inexpensive compared to gold
Platinum looks inexpensive compared to silver
Oil looks fairly valued compared to gold
Natural Gas looks inexpensive compared to oil
Copper looks fairly valued compared to gold


Continue reading this article >>

Tech Dogs of the Dow

by Bespoke Investment Group
Hewlett-Packard (HPQ), Cisco (CSCO), Intel (INTC), Microsoft (MSFT), and IBM.  Aside from IBM, can you think of a bigger group of Tech duds lately?  Intel can't get above $22/share to save its life, Microsoft has been stuck in the $20s for a decade, Cisco has had four consecutive awful earnings reports, and HPQ lost 10% of its value today alone. 

The reason we're isolating these five tech stocks is because they're the five tech stocks currently in the Dow Jones Industrial Average.  Back in the day (the 90s), these names were high flyers, but because of their recent performance, we're now labeling them the Tech Dogs of the Dow. 

Below are two charts comparing the performance of the Tech Dogs to the Nasdaq 100 and the Nasdaq Composite.  As shown, from 1990 to the market peak in early 2000, the Tech Dogs soared 7,200%, blowing away the Nasdaq 100 and Nasdaq Composite.  If we chart the performance of the Tech Dogs versus the two Nasdaq indices during the current bull market, however, a different picture emerges.  As shown in the second chart below, the Tech Dogs are up 72%, while the Nasdaq 100 and Nasdaq Composite are both up about 120%.  While the Tech Dogs traded right inline with the two Nasdaq indices during the first half of the current bull, they have recently lagged significantly.  While the Nasdaq 100 is up more than 30% since last July, the Tech Dogs are flat.

The tech sector has been one of the drivers of the market during the current bull.  It has helped propel the Nasdaq 100 back above its 2007 highs, which is an impressive feat given how far we dropped during the financial crisis.  If only the Dow Jones Industrial Average had a different representation of names from the tech sector, we may be saying the same for that index as well. 

So now what?  Should the Dow drop a few of the five Tech Dogs from the index and replace them with some "new tech" names, or can these old Tech Dogs learn some new tricks and finally go up again?

Continue reading this article >>

Follow Us