 |
I have made no effort to hide the fact that I am very bullish of gold. I am, after all, writing this for a site called GoldStockBull, and in fact my debut submission to the site was a piece in which I make the case for $10,000/oz.+ gold.
But just because I am bullish long term doesn’t mean I don’t think that the price can drop further. Now generally I am reluctant to make shorter term trading predictions because that’s not the sort of analysis that interests me, yet I think there are various signs that indicate that gold bulls may have to endure one more capitulation to the downside before the next leg of the bull market begins. In what follows I will point these signs out for the reader, and I will follow them with some investment strategies.
What Could Send the Gold Price Lower?
1—Gold Didn’t Test Its 2009 Breakout Point
Gold has experienced two significant corrections since the bull market began at the turn of the century. The first was in 2008 and the second began in 2011 and many investors believe ended at the end of 2013. One thing that differs between the two besides their durations is that when the market bottomed in 2008 it hit a major support level—about $700/oz.—that had previously been resistance from April, 2006 through August, 2007. But we have not seen this in the recent bear market. The last breakout point was the resistance level of about $1,000/oz. where the market peaked in 2008 and under which the market consolidated until the end of 2009. The breakout led to the subsequent rally all the way to $1,900/oz. in 2011. Now if the pattern were going to repeat the gold market should test the $1,000/oz. level, but as you can see on the following chart of the SPDR Gold Trust (GLD) we haven’t seen this.
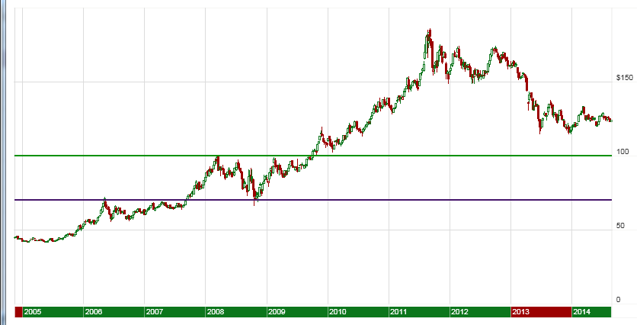
Technical analysts would argue that a test or even a quick breach of the $1,000/oz. level would wipe out the speculative money that entered the market after the gold price broke to its new all-time high, and that this would be needed in order to set the stage for a fundamentally driven leg higher.
2—Stocks and Bonds Remain In Favor
Broadly speaking I am not bullish of stocks, and I am downright bearish of bonds. But there is no denying that these assets have been performing well over the short and intermediate term. While the mainstream financial press would have you believe that these assets trade opposite to one another they are historically correlated. They are both financial assets, meaning that they are claims against another entity that owes something to the stock or bond holder (e.g. dividends or interest). Despite the fact that stocks and bonds are richly valued on an historic basis investors don’t seem to care. Bonds will remain expensive because central banks will see to it that interest rates remain low, and stocks respond to this: while stock may be historically overvalued on a price to earnings or on a dividend yield basis, when these earnings and yields are compared with bond yields they appear to be attractive, especially in the case of companies that can borrow money to buy their competitors or to buy back their own stock.
With financial assets in favor real assets are, by extension, out of favor. While we are seeing strength in select commodities such as zinc, palladium, coffee, and lean hogs, the broader complex is floundering.
Now financial assets are, broadly speaking, overvalued while commodities are generally undervalued, and this includes gold But the market is not at a point where these disparities really matter. So long as money remains cheap bond prices can rise and anything that has a yield can rise with them. At some point this situation will reverse itself, and this could happen very quickly in response to some black swan event. As investors we need to be prepared for this and I will address this in the next section, but for now it suffices to say that it makes sense to yield to Newton’s first law of motion, and acknowledge that financial assets will keep rising while tangible assets will keep falling.
3—Chinese Gold Demand Is “Falling”
I put the word “falling” in quotation marks because this is the narrative that we are seeing in the mainstream media from sources such as Bloomberg, and Reuters. Technically this is true—demand is down year over year. But in a broader context I feel that the claim that Chinese gold production is falling is disingenuous, and we can see this from the following chart.

From this chart we can clearly see that demand is down in the near-term, but it is up sharply over the past few years. Nevertheless the prevailing narrative is that Chinese demand is down, and this is generating bearishness and apathy among investors.
Now just to be clear I think this chart is extremely bullish, and furthermore the gold withdrawals data (the red, vertical lines) doesn’t tell the whole story, because Chinese gold production has been rising year over year and none of this gold leaves China.
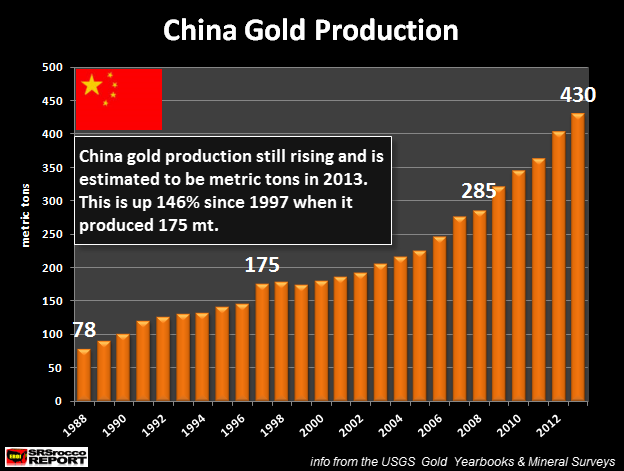
So, Chinese demand for gold is actually not down as much as the first chart would suggest.
Nevertheless, despite these caveats investors are concerned that Chinese gold demand is shrinking, and this could continue to keep them out of the market or even lead some speculators to take short positions.
4—Federal Reserve Tapering Is Perceived To Be Bearish for Gold
Many investors are concerned that if the Federal Reserve continues to taper and if it eventually stops pumping money into the market that this is bearish for gold. The intuition is that there will be less money in the financial system to bid up gold prices. While this makes sense it is misguided—the money needed to bid up gold prices dramatically from here is already in the system. Furthermore, as I’ve argued elsewhere there is a strong correlation between the Fed tightening and a rising gold price. Nevertheless, the misconception prevails, and when the Fed ends its quantitative easing program in October we could see a knee-jerk reaction in the gold price to the down side.
5—The Dollar Index Has Been Strengthening
One of the big surprises this year has been the strength in the Dollar Index, as you can see on the following chart.
This strength has led investors to believe that the Dollar itself is strong, and it leads investors to avoid investments in gold and in other commodities.
Now gold bulls know that Dollar Index strength is not the same thing as Dollar strength. The former simply means that the Dollar is increasing in value relative to a basket of currencies that includes the Euro, the Ye, the Pound, and others. But this doesn’t mean the Dollar itself is strong. For instance, the Dollar Index has gained about 15% since its 2008 low, but it has lost about a fifth of its value relative to gold.
Nevertheless in the short run perception can often trump reality, and a rising Dollar Index can be short-term bearish for gold.
What Should You Do?
On the one hand there are several catalysts that could drive the gold price lower in the near term, despite the fact that, as I’ve hinted above, many of these catalysts aren’t really bearish for gold. On the other hand gold remains undervalued, and furthermore, even if gold can fall another 20% or so its upside potential dwarfs this potential correction which might not even take place.
So if you’re an investor looking to accumulate gold what should you do?
1—Dollar Cost Average
Unless you’re in the business of trying to time the market don’t try to time the market. Allocate a consistent amount of money from your income or your savings to the gold market each week or month or whatever works best for you. This way you will be increasing your exposure on a regular basis so you won’t miss the upward move should the aforementioned correction never materialize. You will also be able to capitalize should we get such a correction. Chances are you won’t catch the exact bottom, but if you’re buying on a weekly or a monthly basis you’ll buy some near the bottom, and because you’re allocating the same amount of Dollars each time period you will buy more gold near the bottom and lower your average buy price.
2—Avoid Leverage!
The worst thing you can do in this environment is to use leverage. If you use leverage you might face a margin call near the bottom of the market and lose your position. You’re buying gold to protect your wealth, not to gamble. If you must have some leverage then devote some of your portfolio to out of the money call options or to the mining space, but options and miners are not gold, and they come with other risk factors.
As a corollary to this you should avoid gold miners that have a lot of debt or high production costs. These companies can easily go bankrupt if the gold price falls to $1,000/oz. and they miss an interest or debt payment. We saw companies with quality assets go bankrupt because they were leveraged and couldn’t contain their costs when the gold market was weak (e.g. Jaguar Mining). So unless you are gambling or an industry expert you should filter out any mining companies from consideration that have too much debt or that can’t turn a profit in this environment.
3—Finally, Ignore the Hype and Stay Disciplined
As the gold market remains weak and the stock market strengthens it becomes tempting to give up on gold. The media has demonized gold despite the fact that it has been one of the best performing assets this century. Banks and analysts have been paraded in front of the cameras at CNBC and Bloomberg espousing the new bull market in stocks and the end of the bull market in gold. But very little has changed over the past three years, and in fact the bull case for gold has gotten decidedly stronger while the financial system has become more indebted and stocks continue to trade at historically high valuations. All that has changed is the prevalent narrative and perception. With this in mind don’t get caught up in the bubble mentality that has swept across Wall St. that is willing to pay 50-100 times earnings for social media stocks (assuming they have earnings) and 20 – 30 times earnings for consumer staple stocks. Gold is undervalued, and under-owned. It might take a while longer for the market to realize this, but the upward revision to the gold price is likely to be significant once the top is blown off.
Get the Gold Stock Bull newsletter, model portfolio and trade alerts by becoming a premium member. You can try out the service for 3 months at only $99 and cancel at anytime if you aren’t 100% satisfied.
by Lance Roberts
Yesterday I was directed to read a piece by Brad Delong, Professor of Economics at Berkeley and a research associate at the National Bureau of Economic Research (NBER), entitled "The Greater Depression."
The entire piece is worth reading, however, here is the clincher:
"Meanwhile, in the US, the Federal Reserve under Janet Yellen is no longer wondering whether it is appropriate to stop purchasing long-term assets and raise interest rates until there is a significant upturn in employment. Instead, despite the absence of a significant increase in employment or a substantial increase in inflation, the Fed already is cutting its asset purchases and considering when, not whether, to raise interest rates.
A year and a half ago, those who expected a return by 2017 to the path of potential output – whatever that would be – estimated that the Great Recession would ultimately cost the North Atlantic economy about 80% of one year’s GDP, or $13 trillion, in lost production. If such a five-year recovery began now – a highly optimistic scenario – it would mean losses of about $20 trillion. If, as seems more likely, the economy performs over the next five years as it has for the last two, then takes another five years to recover, a massive $35 trillion worth of wealth would be lost.
When do we admit that it is time to call what is happening by its true name?"
Brad is absolutely correct. The chart below shows the current "gap" between real and potential GDP as estimated by the CBO.

The dashed "red" line is just an extrapolation of the current growth trend which corresponds very closely with Brad's assumptions of continued sluggish economic growth. However, I am going to suggest that even Brad's view may be a bit optimistic.
One of the major flaws in most analysis, including that of the CBO, is the lack of inclusion of normal business cycle recessions in the forecast. As shown above the CBO does not include in its projections any periods of negative economic growth for an entire 13-year span. As shown in the chart below, that the longest economic expansion on record was 119 months driven by a collision of massive debt expansion, falling interest rates and inflation, and a technological revolution. With interest rates and inflation at extremely low levels, consumers extremely levered and real employment and wage growth weak; it seems a bit naive to suggest that the current economic cycle could continue to "struggle along" for 159 months.

Therefore, if we make an assumption that a recession will likely occur between 2016-2017, it would equate to a period of economic expansion falling between 78 and 90 months. During a recession, where economic growth rates decline, the "gap" between real and potential GDP will widen. Such an event will extend the period for a "return to normalcy" far longer than currently expected.
Furthermore, to support Brad's point, the current "output gap" as a percentage of GDP still remains at levels normally associated with recessions as shown in the chart below.

While it has improved somewhat over the last five years, IF the economy was indeed improving as much as currently believed by the financial markets, the "gap" would be far smaller by now.
Real Employment Is The Real Problem
When it comes to economic growth, particularly in an economy that is almost 70% driven by consumption, employment is critical. Brad notes that the Federal Reserve is exiting its ongoing monetary interventions without evidence of a significant increase in employment. While jobless claims have indeed fallen, this has been a function of "labor hoarding" rather than increases in actual "full-time" employment.
"As I have discussed previously, much of the effect of the decline in jobless claims is not due to substantial increases in actual employment but rather to the effect of"labor hoarding." Since "initial" jobless claims are a function of "newly" terminated individuals filing for benefits it is logical that when companies cease terminations, and"hoard" their existing labor force, claims will fall."
The issue is that the only type of employment that really matters with respect to long-term economic prosperity is "full-time" employment. It is only full-time employment ultimately leads to higher rates of household formation. Unfortunately, since the financial crisis, full-time employment has been primarily a function of population growth rather than a strengthening economy. This is why the labor force participation rate remains near its lows.

Yet, the employment situation may actually be far worse than it looks based on a recent study from the Brookings Institute.
"Perhaps more striking, our research showed that the decline in new firm formation rates had occurred in every U.S. state and nearly every metropolitan area, in each broad industry group, and in all firm size classes – or the same patterns we have just reported for the share of mature firms. Figure 3 plots annual rates of firm entry and exit between 1978 and 2011.
As it shows, the rate of new firm formations fell significantly during this period—occurring because the number of new firms being formed each year (numerator) didn’t keep pace with the growth in the stock of total firms in the economy (denominator). The same was not true of firm exits, which did keep pace with the growth in total firms—allowing the firm failure rate to hold mostly steady before rising in the second half of the last decade."

Why is this important? Recent analysis at ZeroHedge provides an interesting clue:
"Starting in 2009, the Birth/Death adjustment alone has added over 3.5 million jobs..."
In other words, what the Brookings Institute found was that there were far more "deaths" than"births" of new businesses since 2009 which would be a net subtraction to the monthly employment reports. However, the BLS has been using the same methodology to adjust employment data higher assuming that the economy of today is the same as it has been in the past. This is clearly not the case which should be evident by the roughly 94 million individuals sitting outside of the labor force currently.

The inherent problems of a large and available labor pool is that it leads to suppressed wage growth which inherently translates into weaker consumption. My friend Doug Short recently showed this phenomenon in his analysis of median household incomes.

"In the chart above, the seasonally adjusted trough in August was 6.8% below the level in the month the recovery started. Following that low, there has been a trend of higher lows, as we begin to see an upward drift in the monthly highs beginning in June 2013. As of June 2014, the real median income has trimmed a bit over half the post-recession decline."
While median household income has recovered somewhat since the lows of 2011, it has been a very unequal recovery overall. Median incomes are still lower overall than they were prior to the financial crisis which speaks volumes about the "real economic recovery." The ramifications of this, simply, is that the cost of living is substantially higher today than it was six years ago. The"gap" between incomes and living requirements has crimped consumption for a large majority of the middle class which keeps economic growth subdued.
Brad has it right. It is time to call the current economic environment what it truly is, and to realize that it is likely to be with us for much longer than most currently expect.
By Chad Burlet

The month of August continued this summer’s pattern of excellent growing weather in the United States and for most of the northern hemisphere. By most accounts it has been the best weather in decades. We have now reached a point where the only thing that could prevent record U.S. corn and soybean yields would be an early frost. Not surprisingly, U.S. crop ratings have remained at or near record levels and most of Europe and Asia has maintained a steady flow of upward revisions to their crop estimates.
Excess rain during winter wheat harvest has led to a few quality problems in parts of the U.S. and France, but it has not hurt overall crop size. In fact, production estimates for corn, wheat and soybeans now reflect record global production for all three.
Wheat(CBOT:ZWZ4) and corn(CBOT:ZCZ4) prices had experienced the steepest declines during the late spring and early summer, so those markets consolidated in a sideways pattern throughout the month. The soybean(CBOT:ZSX4) market had been the slowest to break, but it began to catch up in August, losing more than 5% of its value. We still feel that soybeans are carrying a considerable risk premium and that they are the market with the greatest downside potential. Additional acreage switches from corn to soybeans have been confirmed for this fall in South America, and early U.S. surveys confirm that U.S. farmers will do more of the same next spring.
The market did get a small lift mid-month when U.S. Department of Agriculture’s Farm Services Agency released its “preliminary certified acres” report. There were as many different conclusions from the numbers as there were analysts, but the average estimate reduced corn plantings by 1.5 million acres and soybean acres by half that amount. We are reluctant to agree with that because the data is incomplete and also because it doesn’t explain what happened to those acres.
For a number of reasons Russia and the Ukraine remained a key area of focus for the wheat market. U.S. wheat futures(CBOT:ZWZ4) ebbed and flowed with each update of military activity or peace talks. Interestingly, the prices in the Black Sea never rallied. In fact, they ended the month slightly below where they started. The two key reasons for the price weakness were the size of the crop and currency weakness. Both Russia and the Ukraine enjoyed record yields and harvested crops that were 10% to15% larger than what was expected two months ago. Those yields, along with their weak currencies, created a windfall for farmers who quickly marketed their grain. Exporters were equally happy to move their stocks and both countries reported record shipments for both July and August.
The other country with a currency concern is Argentina. Years of misguided policies and an anti-agriculture tax regime have taken a severe toll on its economy. Now Argentina’s legal defeat in U.S. courts has put them in technical default. Their foreign exchange reserves are depleted and the unofficial “blue” exchange rate is 72% weaker than the official rate. The current administration would like to hold off devaluation until after the October elections, but they may not be able to hold out. When the devaluation does occur there will be a big round of selling by farmers who have been holding off sales as long as possible.
There have been a number of other factors that have contributed to the bearish tone in world prices. China continues to de-stock via weekly auctions of corn and soybeans, and they are using a variety of different means to block feed grain imports. The Indian monsoon improved greatly and Asian palm oil production far exceeded expectations. In addition, Brazil has initiated their Pepro program where the government buys cheap corn in the interior and subsidizes the transportation to move it to the ports.
Looking ahead to this fall we see a number of interesting opportunities. The continuation of the bearish soybean market will be a major theme. We also expect soybeans to lose ground relative to corn. In addition, wheat is starting to become expensive to corn and the financial incentive for farmers to double crop winter wheat and soybeans vs. planting corn is becoming meaningful. It is not yet time to place the “long corn” leg of any spread, in fact it maybe another 30 or 60 days before this record crop is fully priced.
by Sprout Money
It is slow season in the media and things have significantly calmed down on the financial markets as well. It is so quiet you could hear a pin drop, which is tremendously frustrating, because a market without direction is the last thing an investor wants. Investors are being lulled to sleep and in practice that usually leads to unpleasant surprises once tension returns to the markets. We are, moreover, in a sort of transition phase for the large group of retail investors who are getting sick and tired of the fear of a market correction; year after year they waited for a correction worthy of mention which should have followed in the aftermath of 2008. Even more, the most important market indices are at their highest levels… ever!
Investors are suffering from ‘crash fatigue’. They no longer fear a new market correction, because ‘it is not going to happen anyway’. Although their timing and attitude might be questionable - the current bull market has been going strong for more than 5 years - they are happily participating in the stock market. The fact that investors would pick this moment for a large scale change in sentiment is worrisome in our opinion, however. You know as well as we do that everyone is positive at the top of the bull market and, although we would not say that every investor is all-in at the moment, we are getting dangerously close to a consensus.
That is also the opinion of former Fed Chairman, Alan Greenspan. This man is responsible for the expansive monetary policy of the ‘90s, which was at the base of the hefty market correction around the turn of the century. Greenspan knows what he is talking about. In a recent interview with Bloomberg he pointed out that the surge in the stock market will inevitably lead to a strong correction, even more so because the equity risk premium (versus bonds) is not attractive enough. He did going into specifics about the possible timing of this correction, however.
More and more of the world’s top (hedge) fund managers are joining in. It will probably not be a surprise to you that the most critical investors, like Marc Faber, have been underlining this for a while already. It is much more interesting, however, to look at investors who felt positive until recently, among which is Jeffrey Gundlach. The ‘Bond King’ has clearly changed his mind about the markets and he is also one of the best market timers in the financial world. Gundlach has become increasingly cautious about stocks in particular and he feels that the stock market is generously valued in this economic climate. He foresees profits declining in the near future, which does not bode well for share prices. Gundlach also noticed that the masses are increasingly invested in the stock market; never before have investors taken on so much debt in order to buy stocks on the NYSE.

Source chart: Dshort.com
This is also an indicator that seems to have hit its ceiling. When ‘margin debt’ declines, you can expect a strong correction; another great point from Gundlach. However, talking the talk does not equate to walking the walk. That is something we do not see yet in his case. Especially not with regards to stocks. He is taking up a position indirectly by doubling down on a further increase in bond prices, however, which is obviously the area where the Bond King feels best.
A reknowned investor that did take action recently is George Soros. As a speculator, Soros became (in)famous for betting against the British Pound. The fall of the currency turned him into a billionaire and gave him premier status as a speculator. Over the last few years, George Soros was mostly enjoying the rise of the stock market and dabbled a little bit into commodities or commodity related segments (such as gold mining stocks). In his latest fund report it became clear, however, that Soros is increasingly protecting his capital from a future market correction (through put options on the S&P 500). He increased his short position on the S&P 500 index from 299 million USD to 2.2 billion USD, which is an increase of more than 600%. The size of the position within Soros’ total fund was raised from 2.96% to almost 17%! Of course, we have to add that the rest of the billionaire’s portfolio remains strongly invested in stocks. The purpose of this position is to hedge his current positions against a potential (and temporary) bad stretch on the market.
George Soros does have remarkable timing. Do not forget that the S&P 500 recently crossed the 2,000 points level, which was also our 2014 target for the index since the end of last year. From our point of view, there are 2 possible scenarios now. Either the rally pushes on and transforms into a true melt-up as a result of mass buying (from short covering) or the rally dies down and turns into a a swift correction. The former breakout level between 1,500 to 1,600 points would be the next station if that happens.
In our opinion no speculative positions in gold, silver and mining stocks are now justified from the risk/reward perspective. However, day-traders might consider a small speculative long position in silver.
The precious metals sector moved sharply lower yesterday--in tune with its medium-term trend. The decline was to a large extent connected with the breakout in the USD Index. It seems that it is the U.S. dollar that will determine the short-term moves in PMs and miners in the coming days and in today’s alert we focus on this relationship. The CCI Index seems to be in a particularly interesting position as well and this is something that gold & silver traders should be aware of.
Let’s start with the USD Index chart (charts courtesy of http://stockcharts.com).

The USD Index moved higher once again – this time it managed to move above the Sep. 2013 high. The RSI indicator suggests an extremely overbought condition and the cyclical turning point is upon us. The combination of the above suggests that a corrective downswing has become very likely.
The breakout indeed materialized yesterday, but it has not been confirmed yet (only 1 daily close above the Sep. 2013 high and we would like to see 3 of them before saying that the move is confirmed), which means that this makes the situation only a little more bullish. The combination of these factors seems more important than the unconfirmed breakout, so it seems quite likely that we will see a move lower shortly.
In yesterday’s Forex Trading Alert we commented on the possible reversal in the currency markets this week:
Please note that we will have a decision or at least more information regarding the European QE on Thursday - perhaps this will be the day when currencies reverse their direction for some time. We will keep our eyes open and report to you accordingly.
It could be the case that even if the decision that will be made on Thursday is bullish for the USD Index (big QE in Europe), we could see a “sell rumor but buy the fact” type of reaction. In other words, given the significantly overbought situation in the USD Index and the proximity of the turning point, we could see a reversal no matter what the officials say on Thursday.
The unconfirmed breakout in the USD Index translated into an unconfirmed breakdown in gold.

The decline in gold took place on huge volume which is a bearish factor, but, just as it was the case with the USD Index, until we see a confirmation of the breakdown, we shouldn’t get too excited. Yes, in our opinion the medium-term trend remains down, so the surprises will be to the downside, but at this time it’s not that certain that the decline has already begun. The breakdown (below the previous lows and the rising medium-term support line) is not confirmed at this time and gold hasn’t moved below the declining support line (the upper of them, based on the daily closing prices).
In other words, if the USD Index corrects, then we will be likely to see gold move higher in the short term. If, given the correction, gold stays above the rising support/resistance line, we will have a good possibility that the next big downswing will already be underway and it will probably be a great time to enter a short position.
While we’re at discussing the gold-USD link, we were asked if there [was] a chance that we could see a month long rally in gold with the likelihood of a falling dollar as we [were] at the cyclical turning point. In our opinion such possibility exists, but yesterday’s big-volume decline made it more probable that we will see a rather limited upswing. If gold soars more than $100 or so and mining stocks also rally, then it could change the medium-term picture to bullish. At this time, however, the volume suggests something opposite – we have been seeing higher volume with lower prices and low volume with higher prices. We will be monitoring the markets for signs of significant strength and report to you if we see them. For now – we think the medium-term remains bearish.

Commenting yesterday’s SLV chart we wrote that “we [could] expect the volatility to increase in the coming days based on silver’s cyclical turning point” and we didn’t have to wait long for this to become reality. However, the move lower might not be the thing that was likely to take place based on the turning point – since silver is still before it, we could actually see a sharp upswing based on it. In fact, it still seems quite likely given the situation in the USD Index. Also, please note that the RSI indicator is once again oversold, which has previously meant that we were at a local bottom or a very close to one.
Our yesterday’s comments remain up-to-date:
The most interesting thing about the turning points in the USD and silver is that the one in silver is several days behind the one in the dollar. This paints a picture in which the USD Index declines first, causing silver and the rest of the precious metals sector to rally, perhaps sharply, but then silver’s turning point “kicks in” and metals and miners reverse and start declining. Let’s keep in mind that silver tends to outperform in the final part of a given upswing, so we could see a jump in the price of the white metal right before a downturn. Naturally, there are no guarantees that the above scenario will be realized, but it seems quite likely in our view.
What can we infer from the mining stocks chart?

Not much. The decline hasn’t taken mining stocks below the declining support line, which means that there has been no breakdown. Therefore, the situation hasn’t really changed based on yesterday’s decline. We could still see some short-term strength, based mainly on the buy signal from the Stochastic Indicator. Similarly, to what we’ve seen in gold, the volume on which miners rallied last week was small, suggesting that this rally was just a temporary phenomenon.
Before summarizing, we would like to reply to another question that we have just received and we would like to provide you with one additional chart.
We were asked about our best approximation of the HUI Index if Dow was at 17,000 and gold at $1,100. Of course, there are no guarantees, but our best bet at this time is 150. The 17,000 assumption about the Dow doesn’t change much, as the HUI to gold ratio managed to slide in the past 2 years despite the rally in the former (despite short-term upswings, that is). It seems quite likely to us that when the precious metals sector finally bottoms, the HUI to gold ratio will move to its 2000 and 2009 lows – close to the 0.13 level. Multiplying this by 1,100 leaves us with 143 and 150 is the strong support that is closest to this level.

The CCI Index (proxy for the commodity sector) has just moved to the major, long-term support and stopped the decline at this level. That’s the upper part of our target area for this index – the one that we featured weeks ago. The commodity sector is likely to at least take a breather before declining once again, and this is a short-term bullish sign for gold as well.
Summing up, while the medium-term has been down, the short-term outlook for the precious metals sector seems rather favorable based on the extremely overbought situation in the USD Index. The latter is likely to correct sooner rather than later based i.a. on its cyclical turning point and it’s quite likely that it will cause a move higher in PMs and miners.
To summarize: Trading capital (our opinion): No positions Long-term capital (our opinion): No positions Insurance capital (our opinion): Full position
Argentine President Cristina Fernandez de Kirchner’s efforts to fortify the economy against the fallout from the country’s default are being undermined by a surge in demand for dollars.
Individuals bought $42 million yesterday, the most for a single day, after a monthly record of $260 million in August following the country’s July 30 debt default. Dollar sales by the government have drained $1.4 billion from international reserves this year, or about 5 percent of remaining funds used to pay foreign creditors and import goods.
Argentines are dumping pesos to buy dollars, shares or durable goods to shield their savings from inflation of 38 percent and a collapse in the currency. Since the default, the peso has fallen to record lows in unofficial markets. Fernandez, who imposed limits on dollar purchases and other capital controls after being re-elected in 2011, devalued the peso in January by the most since 2002 and has restricted imports in a bid to save hard currency.
“We’re seeing a growing gap between returns you get in pesos compared with dollars, and people are buying what they can on devaluation expectations,” said Luciano Cohan, the head economist at research organization Elypsis in Buenos Aires. He predicts dollar purchases will climb to as much as $400 million in the remaining months of this year.
The peso has lost 22 percent to 8.41 per dollar this year, the world’s third-worst performing currency. In the black market, the currency has weakened 30 percent to 14.25 pesos -- another indicator of how precious the greenbacks have become to Argentines.
Official Purchases
Under a system put in place in January, Argentines are allowed to make monthly dollar purchases at the official rate of as much as 20 percent of their salary, up to a maximum of $2,000.
According to tax agency figures, most people who buy dollars via the official channels opt to pay a 20 percent surcharge to hold bills instead of depositing the funds in an Argentine bank. That means they’re paying an effective rate of about 10 pesos for each dollar, still less than the black market rate.
A central bank press official declined to comment on the dollar sales.
Argentina defaulted on its foreign bonds after a $539 million interest payment was blocked by a U.S. judge, who said the country must first compensate holders of debt from the nation’s 2001 default that successfully sued for full repayment. Fernandez has said paying the so-called holdout creditors, led by Paul Singer’s Elliott Management Corp., would expose Argentina to additional claims that it can’t afford from investors who agreed to bond swaps in 2005 and 2010 at about 30 cents on the dollar.
‘Domestic Adjustment’
Before the most recent default, Argentina had been moving closer to reaching agreements that would allow it to return to overseas capital markets for the first time since its $95 billion default in 2001. Since October 2013, the government had settled arbitration cases at the World Bank, compensated Repsol SA for the nationalization of its stake in YPF SA and agreed to pay the Paris Club of creditor nations $9.7 billion in overdue debt.
The government has lost maneuvering room since the U.S. court ruling, making it more likely the government will be compelled to devalue the peso, according to Barclays Plc.
“Since the path to regain market access has been closed, your only option is a domestic adjustment,” Sebastian Vargas, an economist at Barclays in New York said. “There is a higher risk that reserves come under pressure, because domestic adjustment is politically and socially costly.”
Bank Reserves
Argentine dollar bonds due in 2033 rose 0.33 cent to 80.89 cents on the dollar as of 8:43 a.m. in New York.
Central bank reserves have fallen by more than a fifth in the past year to $28.5 billion. A record soybean harvest has failed to rebuild foreign currency reserves, as commodity prices tumbled to a four-year low and more farmers held onto a portion of their grains to get a better exchange rate in the future.
Currency traders expect the official peso to weaken 12 percent over the next three months to 9.5 per dollar, based on the market for non-deliverable forward contracts, which are used to speculate on future moves in the exchange rate.
Even with the economy in recession, annual inflation has accelerated to 38 percent, the highest since the end of a one- to-one peg to the dollar in 2002, according to estimates by Elypsis.
The government, which overhauled its inflation index in January, said accumulated inflation was 15.6 percent through July and hasn’t published an annual figure yet.
“It’s not clear in what direction policies are headed,” Vargas said.
Elliott R. Morss ©All Rights Reserved
In 1999, Sandy Weill, supported by a coterie of other bankers and lobbyists, got the US Congress to repeal Glass-Steagall. That Act had kept depository institutions safe since the '30s. With restrictions removed, US banks purchased, packaged and traded mortgages and their derivatives. In late-2008, the market for these financial packages disappeared resulting in the US banking collapse and the largest global depression since 1929.
Some claim there were other reasons for the '08 Depression. I argue that the banks losing track of what was actually in the mortgage packages they were selling was the primary reason the market for mortgage-backed securities suddenly disappeared. And this in turn led to the bank collapse et al.
Were the banks that caused the collapse acting legally? Apparently not. While the wheels of justice turn slowly, there have recently been a number of large fines and settlements won by governments and private firms against the largest banks. In most of the settlements, the banks have not conceded wrong-doing. Hard to believe - why would Bank of America (NYSE:BAC) agree to pay the Feds nearly $17 billion if they did nothing wrong? The answer: Bank of America committed numerous criminal acts. But admitting it would open the bank up to even more lawsuits and the Feds settled because they know how expensive lawsuits against the big banks can be.
This article provides detail on big bank crimes along with some thoughts on whether these large fines and settlements will be adequate to keep the banks in check going forward.
There is long list. The crimes generating the largest penalty fees/settlements are:
In frenzied efforts to make money on the trading of mortgage securities, large banks lost track of who actually had title to properties underlying mortgages they wrote, bought, packaged, and sold off. Banks engaged in criminal acts when they initiated foreclosures on properties they did not own or know who did.
Numerous settlements have been won against the large banks for fraudulent misrepresentations of the mortgage security packages they were selling. Goldman (NYSE:GS) actually urged its clients to buy mortgage packages while selling off its own holdings of the same securities. And while the banks were certainly at fault for fraud, it should be kept in mind that the buyers should have known better. Many of these packages were brought by the Federal Housing Finance Agency and its "offsprings" Fannie Mae and Freddy Mac. The well-paid officers of the Federal agencies buying this stuff should either have known or found out what they were getting before making the purchases. The reality is that as long as large commissions were made on these transactions, neither buyers nor sellers cared about product quality.
The US had financial sanctions in place against Burma, Cuba, Iran, Libya, and Sudan. The sanctions said all banks doing business in the US should not conduct transactions for customers in these countries. The following banks got caught and the fines they agreed to pay are: BNP Paribas (BNP.PA) (OTC:BNPZY) - $8.9 billion, HSBC (NYSE:HSBC) - $2 billion, ING (NYSE:ING) - $619 million, Credit Suisse (NYSE:CS) - $536 million, Lloyds TSB Bank - $350 million, Barclays (NYSE:BCS) - $298 million, and Standard Chartered (STAN.L) (OTC:SCDRF) - $227 million.
Large banks use depositors' monies to buy and sell huge blocs of financial assets. And they have used these funds to cause prices to rise and fall. Many have heard about the LIBOR scandal. But there have been others. For example, JPMorgan (NYSE:JPM) was fined $410 million for manipulating electricity prices in 2013.
For many years, Swiss banks aided Americans in avoiding US taxes. In recent years, the Swiss authorities reluctantly agreed to cooperate with the IRS on these matters. And not surprisingly, UBS agreed to pay a US fine of $780 million in 2009 for tax evading activities. But today, Switzerland is not alone. The Treasury reports that the Cayman Islands rank third behind the UK and Canada for US investments.
Table 1 provides data on the fines, penalties and settlements levied against the big banks. The final column gives fines, etc., for the 2011-14 period as a percent of reported income for 2011-13. There are several problems with these ratios1, but they are indicative of how significant the fines are relative to each bank's income.
(click to enlarge)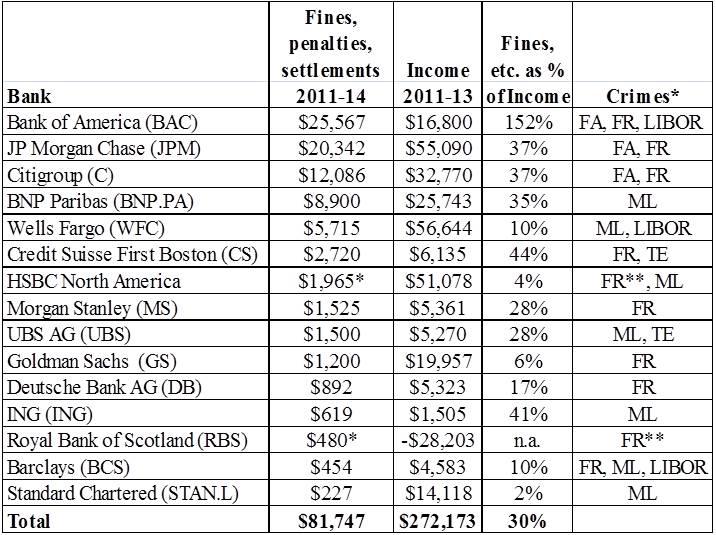
* Crimes: FA=Foreclosure Abuses; FR=Fraud; LIBOR = Manipulating Interest Rates and Prices;
ML=Money Laundering; TA=Aiding in Tax Evasion;
** Banks are in negotiation with Federal housing agencies - significant additional fines expected.
Sources: Newspaper reports and company SEC filings.
There is no question that since the 2008 depression, a new regulatory era has started. And part of that are much higher penalties. But will they have the desired impact of reducing bank crime? I talked recently to a senior executive in one of the big US banks. He said: "Big banks are in the risk business. One of those risks is that either governments or private firms will take us to court. In deciding what to do, we have to consider that risk. However, the returns on some activities are high enough to risk lawsuits. And when they are, the penalties we incur will be viewed as a cost of doing business."
Take another look at Table 1 where fines are compared to banks' income. I don't care how large a bank is. When your fines exceed $1 billion, your stockholders will sooner or later take note. And the fines are not the only costs that banks incur for illegal acts. In 2013, Bank of America paid $2.9 billion in "Professional Fees" (I am sure a significant segment of this is for outside lawyers); JPMorgan's tab for said fees was $7.6 billion!
Paul Volcker, the former Federal Reserve Chief, has for some time argued that banks should not be allowed to trade using depositor assets. He points out that the Glass-Steagall Act did not allow it and we had no major bank problems while it was in force. A significant feature of the "true" Volcker Rule is that banks cannot sell off the loans/mortgages that they originated, but instead hold them to maturity. The "incentive effects" of adopting the Volcker Rule would be significant: instead of trying to maximize commission income from the sale of loan/mortgage packages (the driving force behind the 2008 collapse - nobody cared about the quality of loans), banks would instead focus on making sound loans.
At one point, Volcker had some influence in the White House. That ended when Larry Summers and Tim Geithner took over. Both Summers and Geithner, looking for paychecks from the finance industry in their next jobs, effectively eliminated Volcker's influence. However, Barney Frank and others in Congress insisted that the Dodd-Frank Bill does include a Volcker Rule. Unfortunately, just how it would be defined was left to the regulators. And the bank lobbyists have been at work. Open Secrets estimates that banks spent more than $60 million on lobbying in each of the last 3 years (2011-13).
So where are we today? I quote from the most recent JPMorgan annual report to the Security and Exchange Commission:
"On December 10, 2013, regulators adopted final regulations to implement the Volcker Rule. Under the final rules, "proprietary trading" is defined as the trading of securities, derivatives, or futures (or options on any of the foregoing) as principal, where such trading is principally for the purpose of short-term resale, benefiting from actual or expected short-term price movements and realizing short-term arbitrage profits or hedges of such positions. In order to distinguish permissible from impermissible principal risk taking, the final rules require the establishment of a complex compliance regime that includes the measurement and monitoring of seven metrics. The final rules specifically allow market-making-related activity, certain government-issued securities trading and certain risk management activities."
The banks' lobbyists have done a good job. The agreed-upon rule only applies to a segment of short-term trading. And "a complex compliance regime" that involves "seven metrics"? The banks will just hire a few more accountants and lawyers and again befuddle the regulators. And the banks have negotiated things so they will be able to "hedge". In sum, the banks got just about what they wanted, a very distant relative of the Volcker Rule.
In its SEC report, JPMorgan stated, "The Firm has ceased all prohibited proprietary trading activities." This is intended to convince the SEC and JPM's stockholders that the London Whale incident will not be repeated: speculative trading by a staffer in London that resulted in trading losses of $6.2 billion, and 2012 fines of $1 billion.
Senator John McCain made an apt comment on the incident: "JPMorgan's chief investment office increased risk by mislabeling the synthetic portfolio as a risk-reducing hedge when it was really involved in proprietary trading".
So will the "watered-down" version of the Volcker Rule have a meaningful impact? Table 2 provides data on the trading assets and income of banks at the end of 2103. It remains a big business and will continue as such.
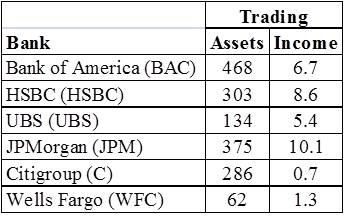
Source: SEC Submissions
Just after the 2008 bank collapse, there was considerable concern expressed about certain banks being "too big to fail". Congress's solution was to ask the big banks to write up plans for "orderly bankruptcies" that would not set off wider panics. This sounded like a dead-end, losing proposition from the start and it has proven to be just that. The banks have submitted their initial plans and the federal regulators have reacted. The Federal Deposit Insurance Corporation has determined that the living wills were "not credible." Thomas M. Hoenig, the vice chair of the FDIC, concluded: "Despite the thousands of pages of material these firms submitted, the plans provide no credible or clear path through bankruptcy that doesn't require unrealistic assumptions and direct or indirect public support."
We do not deposit money in banks so banks can gamble. We put money in banks for safe keeping. Depository institutions should not be allowed to trade any assets. Too risky. Let hedge funds, private equity funds, and venture capital funds take the risks. The simple and only solution that will make banks safe: limit FDIC insurance to banks that hold their own loans to maturity and do not engage in trading on their own accounts.
Given the bad press big banks have been getting, perhaps the best way to view them is like sin/vice investments. For example, the Vice Fund (VICEX)2 only invests in tobacco, alcohol, defense, and gambling companies. It has done well (5 year average return - 17.7%) .
There is an interesting literature on sin/vice investing3. In essence, the studies find that in the long run, sin stocks outperform the overall market. Why? Because some institutional investors shy away from sin stocks, sin industries have high entry barriers, and companies within sin sectors often have considerable pricing power.
However, you want to view large bank investments, I offer one recommendation: before investing in a big bank, take a look at its annual filing with the SEC. In particular, find and read the "Litigation" note to its Consolidated Financial Statements. For example, JPM's Litigation note appears on pg. 326-332 of its 2013 10-K Report to the SEC. It describes 37 major actions that have been investigated with numerous cases coming forth from them.
I end with a quote contained in JPM's Litigation note:
"The Firm has established reserves for several hundred of its currently outstanding legal proceedings….During the years ended December 31, 2013, 2012 and 2011, the Firm incurred $11.1 billion, $5.0 billion and $4.9 billion, respectively, of legal expense. There is no assurance that the Firm's litigation reserves will not need to be adjusted in the future."
1. The fines, etc. data reflect what has actually been settled on, either in court or in out-of-court settlements. Just when, how and if these fines, etc. will be collected remains uncertain. The banks set aside reserves (and in so doing, reduce income) for what they expect they will have to pay annually. That means their incomes are somewhat lower than they would have been in the absence of the fines, etc.
2. The "Vice Fund" was recently renamed the "USA Mutuals Barrier Investor Fund".
3. See F.J. Fabozzi, K.C. Ma, and B.J. Oliphant, "Sin Stock Returns", Journal of Portfolio Management, Fall, 2008, and H. Hong and M. Kacperczyk, "The Price of Sin: The Effects of Social Norms on Markets", Journal of Financial Economics, April, 2009.
The ECB meets tomorrow. The combination of soft inflation data and Draghi's speech at Jackson Hole has raised expectations for a policy response.
Many observers have played up the risks of an asset-backed securities (ABS) purchase scheme for which Draghi said preparations are moving forward quickly. We are more skeptical that the ECB is prepared for this. There are many moving parts, and not all of them are controlled by the ECB. Moreover, the issuance of ABS varies greatly through the eurozone, though if the ECB did announce a purchase plan, we could envision banks manufacturing more.
Rather than an ABS purchase program or an outright QE, we expect more modest measures by the ECB. We think a 10 bp rate cut to bring the repo rate to 5 bp is likely. The deposit rate, which is already set at minus 10 bp could be cut further, and the top of the corridor, the 40 bp lending rate could also be shaved.
Recall that in June in response to the last rate cut, including the negative deposit rate, the euro initially sold off and then rallied to a two-week high. There was marginal follow through buying the following day, but then the euro slipped lower. Still, it did not take out the low set initially on the ECB announcement until late July.
ECB officials seem focused on the Targeted Long Term Repo Operation (TLTRO) that will be launched toward the middle of this month. Some observers share our concern that for various reasons the participation may be as strong as hoped. The purpose of the TLTRO is to boost private sector lending, and demand is not particularly strong. Banks are still paying down the LTRO borrowings. The carry opportunity is not as great. There are more reporting requirements.
The ECB may announce more details of what it has called "modalities" or rules of engagement for the TLTROs. Some small banks, which do not have access to the ECB's facilities, could participate in the TLTRO through a larger bank, for example. Although the ECB has indicated this, few have focused on the implication. Since the cost of TLTRO funds 10 bp above the repo rate, a repo rate cut on the eve of the TLTRO may also help encourage stronger participation.
The purpose of the TLTRO funds are to facilitate lending to the private sector and not buying sovereign bonds (carry trade), there are not penalties for using the funds for precisely that. Our understanding is that if a bank's net lending is below the benchmark as of April 2016, the bank will simply have to repay the TLTRO funds in September 2016 instead of September 2018.
That is to say; banks will get to have two-years of low cost funding regardless of the evolution of their loan portfolio. On the assumption that banks will be reluctant to take on fresh maturity mismatches, we suspect that the prospect for a repo rate tomorrow and TLTRO borrowings has been a key factor behind the rally short-end of the euro area coupon curves. The two-year yield in Germany and the Netherlands are negative. France also flirted with negative territory in recent days.
Given the rally rally in European bonds, the carry trade is not as attractive as it may have been previously. However, the cost of the funds is still cheap and, if we are right about a repo rate cut, practically for free (5 bp annualized). This is, of course, cheaper than any other funds that banks can source. This is doubly true for smaller and weaker banks.
What about a full fledged QE program from the ECB? With the OMT issue still before the European Court of Justice, we do not think there is a critical mass necessary to support the effort. Moreover, given the euro's decline, about 3% against the dollar since the negative deposit rate was introduced, and a little more than trade weighted basis over the past six months, which is tantamount to some easing of monetary conditions, we suspect there is a reasonably good chance that inflation bottoms in the September-October period. This may be reflected in the new staff forecasts that will be published tomorrow (and won't be updated until December.
On the other hand, if inflation does continue to fall and deflation looms, we can envision a scenario for QE. In order to win the acceptance by Germany and other creditor members, a European-style deal would have to be arranged. Consider that Italy's President Napolitano wants to step down. He was persuaded to stay in office longer than he intended. He turns 90 in the middle of next year, and reports make it clear that he would like to retire before then.
Draghi may get German support for QE if Germany could oversee its implementation. And recall that with Lithuania joining EMU, a new voting regime at the ECB will be instituted in January 2015. Not only are the number of policy meetings reduced, but also, not all members, including Germany will vote at each meeting. This is ruffling more than a few feathers in Germany.
The proverbial circle can be squared if Draghi steps down as ECB President and takes the high profile post of Italy's president. Germany's Weidmann is the obvious choice as his successor. After Trichet, it was supposed to go to the Bundesbank's Weber, who resigned over the ECB's SMP scheme in which sovereign bonds were purchased (and turned out to be quite a profitable investment).
Some observers have stressed the poor economic performance as a reason for more aggressive ECB action. We disagree. While we recognize the weakness of the region's economy, we do not think European central banks generally see monetary policy as the instrument to address it. At Jackson Hole, Draghi called for fiscal flexibility. This apparently, according to some press accounts, raised the ire of senior German officials. The German concern is not only over the well-worn moral hazard arguments, it is about debt in the first place and the rejection of Keynesian demand management. We have suggested it is very revealing that in German, the word for debt and guilt is the same.
Structural reforms and the promotion of risk-taking and profit-seeking behavior over the traditional rent-seeking is necessary. This does not necessarily mean embracing neo-liberalism. Germany instituted key reforms several years after the Berlin Wall fell, for example. Spain appears to be engaging in a similar effort now.
In fairness, the EU has shown willingness to explore the fiscal flexibility that is embedded in the Stability and Growth Pact. Has not France, Italy, Spain and others been given more time to reach the 3% deficit target? Perhaps Draghi's comments were not so much about the debtor countries, but the surplus countries, like Germany. With the German economy slowing, is there really a compelling reason for it to strive for a budget surplus?
We also take exception with arguments that contend that the problem in Europe is the lack of private investment. We think the problem is one of aggregate demand. The large trade surplus shows that the EMU is producing more goods than it consumes. Moreover, capacity is under-utilized. I cannot think of a major country that has had an economic recovery that was led by investment for at least several decades. Public investment in a different story. Here it does not appear that all of the funds, including EU funds, that are for infra-structure spending have been used. European countries are their own worse enemies in this context.
European officials pride themselves on the rule-based approaches, but the rules are respected often only in the breach. One area of public investment that euro area countries consistently miss is their pledge to spend 2% of GDP on defense. Greece is one of the only EMU members that does, and it is probably among the least able to do so (though it buys its weapons primarily from Germany and France, which participate in lending it funds). In light of the events in Ukraine, and on the eve of the NATO meeting, an increase in defense spending may turn out to be a more viable path. To be sure, this is not to advocate military Keynesianism, just merely to recognize that it is an area that may be explored on political, economic and ideological grounds.
The euro has fallen for seven consecutive weeks coming into this week. The gross speculative short euro position in the futures market is within a stone's throw of the record set just before Draghi uttered his famous pledge in July 2012. While we expected the interest rate and growth trajectory to sustain the downtrend in the euro, we are concerned about the risks of either disappointment with the ECB or "sell the rumor, buy the fact" type of activity. Medium term investors should be prepared for the a counter-trend move, which should seen as a better opportunity to get with the trend by reducing euro exposure directly or through hedges.
by Koichi Hamada
TOKYO – Last April, Japan’s government implemented a long-planned consumption-tax hike, from 5% to 8%, the first in a two-step increase that is expected to bring the rate to 10% by 2015. The hike – a key feature of “Abenomics,” Prime Minister Shinzo Abe’s three-pronged strategy to revive Japan’s economy – signals the government’s long-term commitment to fiscal consolidation. But it has also dealt Japan a heavy macroeconomic blow.
Preliminary GDP data show a 6.8% contraction year-on-year in the second quarter of this year – the largest since the 2011 earthquake and tsunami that devastated the country. Moreover, consumer spending fell by a record amount, contributing to a total real (inflation-adjusted) decline of 5.9% from last July.
But it is not all bad news. Expansionary monetary policy – the second of three so-called “arrows” of Abenomics, after fiscal stimulus – has brought down the unemployment rate to just 3.8%. The ratio of job openings to applicants has exceeded parity, and the GDP deflator narrowed to close to zero.
Such data have given rise to two opposing views. Some economists worry that negative second-quarter data will dampen inflation expectations, thereby undermining Abe’s plan for boosting growth. Meanwhile, the Bank of Japan (BOJ) is emphasizing the positive outcomes of its monetary policy – and is hesitating to continue its expansionary measures.
If the first view proves correct, the BOJ will need to ease monetary policy further to counter falling inflation. If the BOJ is right, it should maintain its current approach, while the government should either postpone the next consumption-tax increase or implement it in two 1% increments, instead of a single 2% hike.
Of course, the second-quarter GDP data show the economy’s immediate response to the hike. But no decision should be made until the third-quarter results are released, providing a clearer picture of what will happen to Japan’s economy after it absorbs the first rate increase. Fortunately, that is precisely what Abe intends to do.
In any case, the success of monetary policy is difficult to deny. As the deflation gap narrows, however, the overall impact of monetary policy will weaken, as it increasingly influences prices more than output.
That is why it is time for Japan’s leaders to shift their focus from the demand-focused first and second arrows to the supply-oriented third arrow: a new growth strategy.
When there is sufficient excess supply in the economy, promoting supply-side productivity is practically useless without efforts to boost demand. That implies that it was not appropriate to focus on growth until the deflation gap narrowed considerably – that is, until now.
The third arrow is not a traditional industrial-policy-based approach. On the contrary, it emphasizes reform of the labor market, deregulation, and a reduction in the corporate-tax rate.
A key component of Abe’s growth strategy is to expand the workforce – a major challenge, given that Japanese society is aging rapidly. One logical solution would be to integrate more foreign labor into the Japanese economy. But efforts to promote immigration face considerable social and cultural barriers.
A simpler solution would be to mobilize working-age women who already – or plan to – stay at home. By removing the barriers to employment that women face – whether practical obstacles, like insufficient childcare services, or social constraints – Japan could substantially increase women’s workforce-participation rate, creating an invaluable buffer against the growing labor shortage.
The second imperative for boosting growth is the removal of excessively cumbersome government regulations. Under the current system, it took 34 years to approve the establishment of a new medical school – the result of collusion between government officials and doctors.
Abe’s plan calls for introducing a series of less strictly regulated special economic zones, each with a specific objective – for example, adopting new medical technologies or attracting foreign businesses. Such a move promises to help prevent damaging obstructionism by the authorities. At the same time, the government should work with the country’s trade unions to boost the flexibility and efficiency of the labor market.
Finally, Abe’s growth strategy demands a corporate-tax reduction – a powerful tool for increasing the tax base in a world in which countries are competing to attract multinational companies. Indeed, lower taxes are vital to increase foreign and domestic investment in Japan.
Some of these initiatives, particularly deregulation, will undoubtedly face resistance from bureaucrats concerned about losing their influence. But, as long as Abe, backed by Chief Cabinet Secretary Yoshihide Suga, remains committed to his stated objectives, Japan’s economic future will remain bright.
by Agrimoney.com
US corn harvest prospects recieve rare downgrade
US corn production prospects received a rare downgrade – albeit to a still-high figure – in a spate of revised harvest estimates implying scope for large upgrades when US officials next week revisit their own forecasts.
Analysis group Lanworth trimmed by 0.8 bushels per acre to 173.7 bushels per acre its forecast for the US corn yield this year, and by 200m bushels to 14.6bn bushels its estimate for production.
The downgrade contrasted with the upward trend of most crop forecasts, including from INTL FCStone, which overnight raised its estimate for the yield by 1.7 bushels per acre to 174.1 bushels per acre, and for production by 140m bushels to 14.595bn bushels.
Strong US Department of Agriculture data on the condition of the US corn crop, rated by far the best since at least 1994 for the time of year, prompted Futures International to lift its forecasts too.
East vs west Corn Belt
| Lanworth, which employs satellite data significantly in its analysis, said that its downgrade reflected evidence of "moderately suppressed crop vegetation density over previously dry areas of Iowa, Minnesota, and Nebraska". Nonetheless, its estimate remains well above a USDA forecast of 167.4 bushels per acre, which is up for revision next week with the release of the monthly Wasde crop report. In eastern Corn Belt states a "combination of favourably cool temperatures, near-average precipitation and timely crop development indicate corn could yield 8-16% above trend and well above USDA's August estimates", Lanworth said. Separately, Allendale released the results of a farmer survey showing a yield forecast of 171.9 bushels per acre, and production estimate of 14.409bn bushels. | US corn yield, (production) forecasts FCStone: 174.1 bushels per acre, (14.595bn bushels) Lanworth: 173.7 bushels per acre, (14.6bn bushels) Allendale: 171.9 bushels per acre, (14.409bn bushels) Futures International: 170.8 bushels per acre, (14.280bn bushels) |
Acreage threat
| US soybean yield, (production) forecasts FCStone: 47.6 bushels per acre, (4.00bn bushels) Lanworth: 46.7 bushels per acre, (3.85bn bushels) Allendale: 46.4 bushels per acre, (3.884bn bushels) Futures International: 46.2 bushels per acre, (3.880bn bushels) | Lanworth added that weather forecasts "do not yet indicate risk for early freeze across the northern production region" which would pose a threat to harvest prospects in potentially bringing the growing season to an end. However, it did highlight the potential for a downgrade to its production forecast from a revision to acreage estimates, with data from the Farm Service Agency gleaned from insurance returns indicating "a loss of 1m acres or more from our current estimate of US corn plantings". Lanworth, which revealed an estimate for harvested US corn area of 84.328m acres, a little above the USDA forecast, said that it was continuing to review its forecast. |
China downgrade
The group restated an estimate for the US soybean yield of 46.7 bushels per acre, with production pegged at 3.85bn bushels, down 10m bushels from the previous forecast.
"Minor yield reductions in Iowa, Kansas, Minnesota, and Nebraska are largely offset by higher yield in Indiana and Delta states," Lanworth said.
The comments came in a report in which the group also reduced its estimate for the Argentine wheat crop by 700,000 tonnes to 12.1, tonnes, citing "excessive precipitation" in parts of the major producing province of Buenos Aires.
The forecast for China's corn harvest was downgraded by 2m tonnes to 218m tonnes, after "below average precipitation fell across the Northeast provinces of Jilin and Liaoning, and much of the North China Plain" last month.
"In spite of recent precipitation, current soil moisture remains well below average across Hebei, Shandong and Henan and slightly below average in Jilin and Liaoning," the group said.
"Drought impacts are likely to be as severe as 2002 for Hebei (-5%) and Shandong (-13%), and 2009 for Liaoning (-22%)."
The USDA estimates Chinese corn output this year at 222m tonnes.
By Sofia Horta e Costa
The Standard & Poor’s 500 Index rally isn’t over and the gauge could jump 50 percent more by 2020 as the U.S. economic recovery heads for a record winning streak, according to Morgan Stanley.
A slower though sustained period of growth could help the equity benchmark gauge peak near 3,000, according to a report dated today. The U.S. economy, which began recovering in July 2009, may continue growing for five years or more, making it the longest period of expansion, Morgan Stanley said. The S&P 500 fell 0.1 percent to 2,001.87 at 10:03 a.m. in New York.
Three rounds of stimulus have helped spur growth in the world’s largest economy. The S&P 500 almost tripled from its low in March 2009, sending the value of U.S. shares to a record $23.9 trillion on Aug. 26. A report showed last week that gross domestic product rose in the second quarter more than forecast, pushed by the biggest gain in U.S. business investment in more than two years.
“Equities should benefit from a scenario where the probability of a cycle peak remains low for some time,” Adam Parker, chief U.S. equity strategist at Morgan Stanley, and economist Ellen Zentner wrote in the note. “As the prolonged expansion becomes more visible, we’d expect a materially higher U.S. stock market.”
The S&P 500 rallied 3.8 percent in August, the most since February, as investors bet central banks will continue to underpin global economies. Minutes from the Federal Reserve’s July meeting released last month reinforced the central bank’s commitment to supporting the recovery even as some policy makers indicated a willingness to raise rates sooner than anticipated.
The U.S. economy will grow 2 percent this year and 3 percent next, which would be the most since 2005, according to the median forecast in a Bloomberg News survey.
As major economies across the world -- from China and Japan to Europe and Mexico -- are at different stages of growth, central banks are likely to keep interest rates lower for longer, according to the report. This will keep the cost of corporate financing low and help extend the economic expansion.
And, amid lower levels of household and corporate debt, and brighter confidence on the part of American consumers, the economy may be just half way through a period of sustained growth, with company profits following, Morgan Stanley said.
If earnings for S&P 500 companies increase about 6 percent every year from 2015 to 2020, profits will be close to $170 a share, Morgan Stanley said. Should the equity index trade at 17 times its companies’ reported earnings, its peak level could near 3,000, the bank said. The gauge currently trades at a multiple of 18 times, data compiled by Bloomberg show.
Earnings for S&P 500 companies will climb 8.1 percent in 2014, according to the average analyst estimate compiled by Bloomberg as of Aug. 29. Profits will grow 11 percent in both 2015 and 2016, the projections show.
by Harold James
PRINCETON – As Scotland prepares for this month’s referendum on independence, the United Kingdom – indeed, all of Europe – must brace itself for the impact of a successful bid. Scottish independence would revolutionize the British and European constitutional frameworks, and give a tremendous boost to other European separatist movements, from Catalonia to northern Italy. The economic impact of independence, however, is far less certain.
Advocates of independence have long insisted that they are motivated primarily by the distinctiveness of Scottish identity. But Scotland’s history and traditions, while undoubtedly its own, have been shaped by centuries of interaction with England and other parts of the British Isles.
The more immediate issue for Scots is money. The question of whether an independent Scotland could or should continue to use the British pound has dominated discussions over the last few months of the referendum campaign. The outcome – for Scotland, the UK, and Europe – could vary widely, depending on which path Scotland chooses.
So far, Scottish nationalists have insisted that an independent Scotland would retain the pound. But, given how much easier it would be to make the case for a separate currency – not to mention the fact that Chancellor of the Exchequer George Osborne has explicitly rejected Scottish First Minister Alex Salmond’s proposed currency union – such declarations amount to an own goal.
The problem with the Scottish nationalists’ vision is a mirror image of the eurozone’s main shortcoming. Given that a single currency cannot function without a common monetary policy, and that economic conditions across the currency union differ, individual members will, at times, be subject to unsuitable policies.
For example, during the construction boom of the 2000s, Ireland and Spain should have had tighter monetary conditions, higher interest rates, and lower loan/asset ratios. But their eurozone membership meant that government and private-sector borrowers alike benefited from very low interest rates. After the financial crisis erupted, and policymakers began seeking ways to compel banks to revive lending in these and other struggling countries, it became apparent that there were no available tools to employ.
Today, the UK faces a similar dilemma. The property boom in the London area demands tighter monetary conditions. But higher rates would wreak economic havoc on the rest of the country, where the recovery remains anemic.
Moreover, like Germany, London maintains a huge current-account surplus (8% of GDP) – a potentially serious problem, given the deflationary effect that Germany’s surplus has had on the rest of the eurozone. Already, the rest of the UK runs an external deficit that is higher than that of any industrialized country.
The behavior of a currency can be driven by one powerful and preeminent sector of the economy; in the pound’s case, it is the financial sector. Some viewed the pound’s rapid decline in 2007 and 2008 – a 30% depreciation in trade-weighted terms – as a much-needed economic stimulus, given the boost that it implied for export competitiveness. The UK’s independent monetary policy provided it with a level of flexibility that the eurozone economies lacked.
But the revival of confidence in the financial sector has caused the pound to rebound sharply (by 18% since the end of 2008), eroding the UK’s competitiveness gain. What is good for the City of London is not necessarily good for the rest of the economy.
There is thus an unmistakable appeal in escaping an economic arrangement that shackles Scotland to London – an appeal that the great Scottish economist Adam Smith would have recognized. Indeed, his most influential work, The Wealth of Nations, was motivated by the belief that the interests of the London merchant community were distorting British commercial policy.
The alternative to retaining the pound, however, presents its own challenges. According to the Scottish economist Ronald MacDonald, an independent Scotland should have its own currency, which would behave like a petro-currency, owing to the economy’s dependence on North Sea gas and oil.
But replacing one dominant sector with another is probably not good for the rest of the Scottish economy, which would lose competitiveness whenever surging energy prices pushed up the exchange rate. As less competitive industries were driven into loss and insolvency, economic activity would become even more concentrated and specialized.
Placing the burden of adjustment on the exchange rate is not the answer. The small, open economies of Switzerland and Norway – important models for Scotland – struggled with sharp currency appreciation during the global financial crisis. For Switzerland, the solution was to implement a ceiling on the franc’s exchange rate against the euro.
This should inspire Scotland to pursue association with a larger currency area and a more diversified economy. How about adopting the euro?
The new crop beans tested both ends of last week’s range to begin the week. Initial weakness was seen on the overnight market while the strength came during the day session. Late in the session the new crop beans managed to take out last week’s highs (filling a gap on the chart) but were not able to close above them.
The September beans and meal contract continue to find strength on the tight old crop supplies. As harvest moves north we would look for the old crop cash market to weaken as more beans come available. I had a customer near Covington, Indiana report that harvest of some beans would begin in his area next week.
There continues to be talk of Sudden Death affecting some areas of the Midwest but we do not believe it is wide spread enough to have a major effect on the nations yield.
Friday’s commitment of traders report showed that the funds were short 21,940 contracts which was biggest short trade position since 2006. In 2006 they maxed their short position out with about 55,000 contracts. In China last night, their weekly auction of government stocks saw 132,135 tonnes of soybeans purchased out of the 337,539 offered. This would imply a 39% participation rate, above the 30% from the previous week. Weather continues to be viewed bearish as the warm wet forecast will allow for the bean plants to add pods and fill them out to the max.
The trade was anticipating crop ratings to stay stable tonight at 70% G/E. The five-year average for this date is only 55% of the crop being rated g/e. The actual ratings counter seasonally improved by 2 points and are now rated 72% g/e. Allendale continues to look for beans to fall to the $9.50 area when the fall low is scored and would recommend not chasing rallies and for producers to sell into a price rally if it were to occur. Allendale will release the results of our 25th annual crop survey tomorrow morning.

Corn (CBOT:CZ15)
Corn saw a mainly calm trading range today. Coming back from the 3-day weekend the weather remained mainly the same with no cold threats to offer a bounce from. Given that the news remained mostly the same, corn traded in a range that was mostly the same as well. There were plenty of buyers today in the low 360s and there were just as many sellers in the high 360s. Corn was reported 74% good-to-excellent, up 1% from last week. Eventually news will be seen which breaks this market out of the recent small range but without a cold weather threat or Midwest yield reports this market remains mainly stuck on a grind sideways.
Bulls:
Bears:
Wheat (CBOT:WZ14)
Wheat finished lower today. The lack of new news out of Ukraine and Russia is pressuring the market. We continue to suggest this market is trading sideways and with this recent Russia Ukraine confrontation giving us reason to bounce, we would expect to continue this moving forward. Ratings for spring wheat came in at 63%, down 3% from last week.
Allendale is releasing their yield results tomorrow morning. We are expecting to see this be a market moving event and would expect to find support or selling pressure based on what the results are going to be. There has been some talk about quality concerns in the spring wheat growing areas which would suggest we could see the Minneapolis wheat gain some premium against the Chicago contract moving forward.
Funds are still actively short wheat and this would still suggest we could see some defending of their position until we break above the August highs. On a feed basis we could see corn harvest pressure the wheat market but would expect the spread between the two to widen. Continue to look for sideways to higher trade moving forward and we continue to struggle on higher moves as it doesn’t appear the Black Sea confrontation is giving the market enough reason to buy into new highs.
Follow Us
