Monday, July 8, 2013

How to Survive a Plane Crash

By Marc Lallanilla

survive-plane-crash

Your chances of surviving an airplane crash, like the recent crash of Asiana Airlines Flight 214 at San Francisco International Airport, are surprisingly good.

More than 95 percent of the airplane passengers involved in a crash survive, according to the National Transportation Safety Board (NTSB).

Despite this reassuring statistic, many people adopt a fatalistic attitude toward plane crashes — which can result in a dangerous level of apathy, especially regarding preflight safety briefings. [5 Real Hazards of Air Travel]

"One reason passengers do not pay attention to the briefing may be their belief that accidents are not survivable," according to a 2001 NTSB report.

But not only are plane crashes survivable, there are things you can do to ensure your safety, experts say.

Dress for survival

Before you leave for the airport, dress appropriately. In the event of an emergency, you'll want to be wearing practical shoes and clothing.

"Imagine having to run away from a burning plane," Cynthia Corbett, a human factors specialist at the Federal Aviation Administration (FAA), told WebMD. "If you have to do that, how well are your flip-flops going to perform? How well are your high-heeled shoes going to perform?"

It's also smart to wear long pants and long-sleeved shirts to protect your skin from flames and sharp objects. According to the NTSB report, 68 percent of passengers killed in plane accidents died as a result of injuries sustained during post-crash fires.

"We like to see tie-on shoes that you're not going to run out of and long pants," Corbett told WebMD. "Jeans are good. I know in the summer that's really tough, but short shorts are just real dangerous."

Choose your seat wisely

An oft-cited analysis performed by Popular Mechanics in 2007 found that passengers in the rear of an aircraft were significantly more likely to survive than passengers near the front.

In looking at fatal airplane crashes since 1971 where seating charts were available, the analysis revealed that people sitting behind the wing had a 40 percent greater chance of surviving than passengers in the front of the plane (where first-class seats are generally located).

Of course, all airplane crashes are different, and in a few crashes, passengers in the front of the plane fared better.

Regardless of which section of the plane you're sitting in, try to sit in or near an exit row. Professor Ed Galea, a fire safety engineer at the University of Greenwich in England, found that most crash survivors moved five rows or fewer before exiting a burning plane.

Galea also determined that aisle seats were somewhat safer than window or center seats, according to ABC News.

Takeoff and landing

Safety experts have found that the most accident-prone times of an airplane flight are the three minutes after takeoff and the eight minutes before landing, ABC News reports. [The 10 Leading Causes of Death]

During these times, it makes sense to keep your shoes on, keep your tray table up and make note of the two nearest exits (both in front of and behind you).

Experts also recommend placing a carry-on item under the seat in front of you. "That gives a block there, so the feet and legs can't go up under the seat in front," Corbett said, noting that broken bones in feet and legs are common in crashes.

If an impact is imminent, it's important to remain calm and assume a survival position: If you have a seat in front of you, cross your hands on the seat back and place your forehead on top of your hands.

If you don't have a seat back facing you, bend forward and hug your knees with your head down. Passengers should also take sharp objects, like pens and keys, out of their pockets — these can stab through skin in an impact.

The 90-second rule

The first 90 seconds after a crash are the most important — if you can stay calm and move out of the plane quickly, your odds of survival are much greater.

Some passengers are in such a state of panic that they can't unbuckle their seat belts: NTSB reports have found that many crash victims are found in their seats with their seat belts still buckled.

"That's why it is important to know what to do, even without the orders," Corbett told WebMD. "Some people sit and wait for orders, and if they don't hear any, then they sit right through the disaster."

One reason so many passengers survived the Asiana crash was their ability to exit the airplane quickly. "If people had dawdled getting off this airplane, that would have put them at increased risk," John Hansman, director of the International Center for Air Transportation, told USAToday.

Gathering luggage and other personal belongings can be a fatal mistake. "You might get stuck on that plane with your luggage," Corbett told WebMD.

As safe as an escalator

One thing safety experts are quick to emphasize is the remarkable safety record of commercial airlines.

Only one in 1.2 million flights ends up in an accident, according to NTSB statistics. Vast improvements in safety training, in nonflammable aircraft materials and in firefighting equipment have made flying much safer than driving.

The odds of dying in a plane crash are about one in 11 million, according to Discovery, while the odds of dying in an auto accident are about one in 5,000.

"Riding on a commercial airplane has got about the same amount of risk as riding on an escalator," Hansman told ABC News.

"Flying the friendly skies is, I believe, the safest mode of travel," Corbett told WebMD. "That doesn't mean we should take it lightly and that we shouldn't be prepared. Don't let it scare you. Just have a plan."

See the original article >>

Gold & Silver Elliott Wave Count

by Pater Tenebrarum

A Wave Count Update Ahead of the Jobs Data

We occasionally show wave counts by different practitioners here, and thought it would be a good time to update the gold and silver wave structure. Keep in mind that it is of course always possible that a wave count will have to be altered and replaced by an alternate count, since these exercises are probabilistic. However, one of our 'guest Elliotticians', P.N., did quite good job with his last wave count update on gold which some readers may remember (the chart can be seen here). We'll see if the part that hasn't played out yet will also play out as anticipated at the time. Incidentally, P.N.'s SPX wave count  update made at the same time also continues to look good so far.

On Thursday we had the ECB and the BoE doing their 'dance of the doves', which has helped the US dollar to strengthen a bit (maybe they just wanted to annoy Bernanke by showing him they also know how to devalue their currencies?), so gold enters the trading day with a slight handicap. However, as we have pointed out last week the reaction to the payrolls report will be of interest, and not even necessarily the immediate reaction, but rather what transpires over the next week or so. In other words, we don't even believe that the report as such will matter much, unless it is an extreme outlier far beyond expectations.

In this context, we want to show two slightly different gold wave counts by another occasional  guest e-waver, B.A. Both of them have gold in the latter stages of a C-wave of a large A-B-C correction. One of them (the first one shown below) has a missing 5th wave, which if it were to eventuate would likely produce a low in the $1,150 region. That is incidentally a target that was inter alia mentioned by Martin Armstrong and a few others if memory serves. Of course, if we are considering such technical targets one could just as well argue that the recent dip to just below $1,180 may have been enough (it is not possible to make such a forecast with precision). Anyway, here is what the chart looks like that is implying one more wave down to complete wave C:


Gold wave count-1

Gold wave count by B.A., a large A-B-C correction, with the 5th wave in C still missing – click to enlarge.


An alternate count of gold offered by B.A. shows the possibility that wave C may have found its low already. What speaks in favor of this interpretation is how deeply oversold the gold stocks have recently become, but one must be careful, since it is not yet certain that the sector has really made a durable low. The sector has recently been subjected to serial downgrades – in fact it was such a barrage of downgrades that one felt reminded of someone stomping on a victim he has just killed to make absolutely sure nothing but a red stain on the asphalt remains. If the index fails to make new lows in the wake of that, it would actually buttress the idea that a significant low has been put in. However, confirmation is obviously still lacking (see also the HUI chart further below).


Gold wave count-2

Here is the alternate wave count gold bulls will probably hope is the correct one. This one does contain one 5th wave of lesser degree that is a bit long relative to the other waves in that subdivision (the gray colored labels), but then again, gold has a habit of  producing long 5th waves and is isn't against the rules as long as wave three isn't the shortest in the sequence. We must admit though that the first wave count at the moment look like the one with the higher probability to us – click to enlarge.


One reason why wave count number one (incomplete wave C) looks somewhat more likely is that silver too appears to require one more wave down, as can be seen on the weekly chart below. It did on the other hand dip into an area of very strong lateral support, namely the region from whence it broke out prior to its 2011 blow-off rally. It is possible that after a wave 4 upward correction it will dip again toward the lower channel rail (which will by then be below the recent price low), but we'll have to wait and see. If this support area is very strong, the fifth wave could end up truncated, as a 'retest' of the previous low.


Silver wave count

Silver weekly, another big picture wave count by B.A. that is looking at the bear market since the 2011 high – click to enlarge.


Regarding the HUI index, the recent low occurred in conjunction with notable momentum divergences, then the biggest up day in an eternity was seen, but subsequently initial gap resistance once again couldn't be overcome. We have marked out the 'downgrades' day on the chart and the subsequent 'inside day', which denotes uncertainty.


HUI

The HUI index. The best thing about this chart are the divergences between price and momentum oscillators. Other than that it is still inconclusive – click to enlarge.


Obviously the index has to rally quite a bit to overcome even the first level of technical resistance. This looks like it could become a long hard slog, but we'll see.

Addendum: Producer Hedging?

We recently came across the idea expressed by several people that producers have allegedly begun to hedge again. This would be quite idiotic considering current low interest rates and the consequently squashed forward curve of gold; not to mention that if someone who didn't hedge at $1,900 starts doing it at $1,200, he really needs his head examined anyway. However that is not the point we actually wanted to make.

The main point we want to make is that even if it turns out to be true (and according to industry sources it isn't – we picked this up grapevine-wise), it would hardly matter to the gold price. Total annual production by mines adds about 1.4% to the world's existing stock of gold. If 20% of it were sold forward, the supply of gold would temporarily increase by 0.28% in one year. We wouldn't think this to be a very good reason to be shaking in one's boots. Incidentally, the same irrelevance attaches to various stories about big buyers, like e.g. central banks. The amounts involved are ridiculous relative to the total stock of gold. In fact, we regard central bank buying as a contrary indicator. The proof is in the pudding – as long as they remained net sellers, the gold price kept going up. Ever since they have become net buyers, it has either gone nowhere or down. Don't get distracted by such stories – what matters to gold's price can only be inferred from the fundamental drivers we have previously discussed.

See the original article >>

Central Banker Thinks ‘Central Banks Are Helping’

by Pater Tenebrarum

'Pessimists' (i.e., Critics) 'Should be Ignored'

David Miles, an external member of the BoE's MPC has published an editorial in the FT (where else?) defending the John Law school of central banking which he evidently belongs to. He manages to contradict himself two paragraphs into his screed, and thereafter goes on a tirade about central bank policies supporting 'demand', as though we could consume ourselves to prosperity. Been there, done that, is actually all one can say to that. It's as if the central bank policy induced bubble that collapsed in 2008 had never happened. In other words, Miles apparently believes his audience has the attention span of a mayfly (about this point, he may actually be right for all we know). The funny thing is that he contradicts himself even while asserting that it is the critics of money printing who contradict themselves.

“Much of the most vocal and opinionated analysis of the impacts of central bank asset purchases – quantitative easing – strikes me as somewhat contradictory. But it is also important and may explain the recent reaction, quite probably an overreaction, to limited news from the Federal Reserve on asset purchases.

Some people seem to believe that large-scale asset purchases by central banks have created bubbles in many markets and that stopping such purchases (let alone reversing them) must cause big falls in prices. Others take the view that these central bank purchases are ineffective in stimulating demand in the wider economy. I think the evidence for either of these positions is weak. But some people believe both things – a position that I think is also contradictory as well as being profoundly pessimistic.

The first claim – that QE has artificially boosted prices to bubble levels – does not stand up. It is certainly true that in purchasing financial assets, central banks – certainly the Bank of England’s Monetary Policy Committee – has deliberately and consciously raised the demand for these assets and that will have supported their price.

Supporting asset prices helps to support growth. It means that many companies find it easier to raise funds, and that many household borrowers face lower longer-term interest rates. And by keeping the value of portfolios of wealth higher than it would have been, the spending of many of the people who own that wealth is supported. Does anyone doubt that many of the households that have seen the value of their savings accounts and other stocks and bonds rise over the past year or so would have been less inclined to spend had these instead fallen sharply in value?”

(emphasis added)

So central banks have not blown another bubble, they have only 'deliberately and consciously supported asset prices'. In other words, they have blown another bubble. No contradiction there at all. The very same argument could have been made after central banks 'deliberately and consciously' created the housing bubble in 2002-2007. It sure 'raised the prices of financial assets', and 'supported demand'. It also led almost to a catastrophic systemic collapse, a severe recession and eventually a sovereign debt crisis, among other things. Why is this time going to be different?

Before we get to that, a brief remark on the fact that Miles continues to stress 'demand', i.e., increased spending in his article. The term 'demand' is mentioned six times. The term 'production' isn't even mentioned once. This is in fact the cardinal error underlying Anglo-Saxon central banking socialism. In order to exercise demand, one must first produce something. Demand that is set into motion by printing money that is enabling exchanges of nothing for something – i.e., consumption without preceding production – only weakens the economy structurally. It falsifies economic calculation and thereby creates phantom profits and phantom wealth, even while real capital is consumed. Evidently, central bankers still haven't realized that. In Miles' imaginary simplistic world, capital is a homogenous blob that springs into action as soon as there is 'demand'. In the real world, things are a tad more complicated.

No Bubbles in Sight Anywhere …

So why is it not a bubble this time? Wasn't the mantra hitherto that central bankers should ignore bubbles because they are supposedly unable to recognize them? We seem to recall that this was an argument forwarded by Alan Greenspan that has been employed as an excuse ever since. Central banks are only supposed to deal with the 'fallout' once a bubble bursts, since they allegedly cannot tell the difference between a fundamentally justified increase in asset prices and a bubble. Apparently Mr. Miles can tell. Not only that, he is convinced that letting the market deal with correcting the errors induced by the previous central bank induced bubble is definitely not the way to go. See, without intervention, there would be a 'self-reinforcing spiral' that would never, ever end. Without central planners distorting interest rates and prices, we would obviously forever be stuck in economic depression.

“One of the ways that financial crises can have drawn-out consequences is when debtors’ balance sheets deteriorate as the assets that they hold lose value. This runs the risk of a negative self-reinforcing spiral – a worsening economic situation pushing down on asset prices further depressing demand. By supporting asset prices, QE has helped to ensure that this sort of negative spiral has not happened in the UK.

If QE had created a bubble, there would be a big risk that values will soon crash. And asset prices have fallen sharply over recent weeks as people reassess the scale of purchases by the Fed. Yet the evidence for a general bubble in asset prices is not very convincing. It is true that until the very recent sell-off the FTSE All-Share index was about back where it was in the summer of 2007 – having fallen by about 40 per cent between mid 2007 and early 2009. But in real (inflation-adjusted) terms, stocks were still down by about 20 per cent from the level they reached in 2007. Price to earnings ratios on those stocks do not look unusually high. Average house prices in the UK are – according to some national measures – only 5-10 per cent lower than the levels at the peak of early 2008. But, in real terms, they are down by about 25 to 30 per cent. Yields on government debt – both in nominal and real terms – are unusually low.

Part of that reflects a belief that central banks are likely to keep short-term interest rates at low levels for some time yet. Part of it is likely to reflect a substantially higher perceived level of risk now relative to before the financial train wreck of 2007-8. That puts a premium on relatively safe assets – such as gilts. So there are good reasons why yields on less risky government debt should be low.”

(emphasis added)

His argument seems to boil down to: “relative to the speed with which we have impoverished people by devaluing the money we issue and which they are forced to use, asset prices are not in bubble territory just yet.”

Well, thanks for nothing. Here is what those who don't own any of the assets the prices of which the central bank has driven higher are facing:


Real Incomes, UKChange in UK real incomes, 2002-2012.


Essentials, UKUK price increases of essentials compared to the nominal rise in wages


In other words, by devaluing its money, the central bank has redistributed wealth from the poor to the rich. We're supposed to be grateful for that why exactly? Oh yes, because otherwise we would be in a 'permanent depression', in a 'never-ending downward spiral' and there would be 'no demand' (needless to say, that idea mainly springs from the overactive imaginations of central bankers and their advisors).

Regarding stock market valuation, let us look at the US stock market and see if we can discern any difference between current trailing price-earnings ratios and those at the 2007 peak, since Miles so confidently assures us that 'stocks are not expensive'.


S&P p-e-range currentThe S&P's trailing P/E ratio today versus that of 2007: difference = zero – click to enlarge.


It actually looks like stocks are just as expensive today as they were then. As an aside, stocks were only marginally more expensive at several of the biggest market peaks in history, such as in 1929, 1973 and 1987. They were cheaper than today at the peak of 1937 (which was followed by a near 60% crash) and the only time in history when stocks went to significantly higher valuations was during the late 1990's bubble. As the chart above shows, the SPX would have to fall by 46% to reach a p/e ratio of 10. At historical secular bear market lows, the index has fallen to mid to high single digit p/e ratios (e.g. in 1932, 1942, 1949, 1974, 1980 and 1982). It is important to keep in mind that this happened both during times of low and times of high interest rates – in other words, low interest rates are not a guarantee it won't happen again.

In closing, Miles remarks that:

“Furthermore, to think that asset purchases do nothing to support demand in the economy you would also have to believe that investment was not at all responsive to a greater availability of funding at lower interest rates. Is that plausible?

A rather less sensational view on the effects of QE is far more plausible. Central bank asset-buying has supported a wide range of prices and this has caused spending to be higher than it would otherwise have been.”

(emphasis added)

The man seems to be harboring the delusion that critics of central bank money printing are arguing that such printing does 'not boost demand' or doesn't 'cause higher spending'. That isn't the argument at all. The argument is: it is an error to believe that sustainable economic growth is the result of 'more spending'. Central bankers are putting the cart before the horse. In reality, it is production that enables consumption, not the other way around.

There is also no question that keeping interest rates artificially low spurs investment – the problem is that a large portion of this investment will at a later stage be unmasked as malinvestment of capital that will likely require an even bigger bust to be liquidated. The balance between investment and consumption is destabilized by throwing more fiduciary media on the market and artificially lowering the interest rate. Nothing good can come of it, even if aggregate economic data can for a while create the false impression that things are going well (just as happened from 2002 to 2007, a time when central bankers were almost gasping for air from all the self-congratulatory back-slapping they engaged in). Central banks don't create wealth, they destroy it.

Conclusion:

We will keep calling the apologists of central banking out (admittedly it's not difficult to demolish their arguments). The central planners at the heart of our economies have obviously learned nothing. By sticking to economic theories that should have long been discredited, they will only create an even bigger catastrophe down the road. Moreover, their policies continue to impoverish the very people – from the poor to the middle class – they purport to be 'helping'. We can only repeat: central banks are a threat to civilization. When will people finally wake up to the fact that central planning just doesn't work?

See the original article >>

Cotton works higher but demand turning soft

By Jack Scoville

COTTON (NYBOT:CTV13)

General Comments: Futures were higher on follow-through buying. It was a low volume session with the holiday yesterday, and today could be a low volume session as well. Futures held the short term range. It is possible that futures can work lower again as demand has turned soft. Ideas of better production conditions in the U.S. caused some selling interest. Texas is reporting light precipitation, mostly in southern areas. Dry weather is being reported in the Delta and showers and storms are seen in the Southeast. The weather should help support crop development in the Delta and Southeast, and could help in Texas. Weather for Cotton appears good in India, Pakistan, and China.

Overnight News: The Delta should be dry and Southeast will see showers and rains. Temperatures will average near to above normal. Texas will be mostly dry. Temperatures will average above normal. The USDA spot price is now 82.78 ct/lb. ICE said that certified Cotton stocks are now 0.602 million bales, from 0.597 million yesterday. ICE said that 53 notices were posted today and that total deliveries are now 2,515 contracts.

Chart Trends: Trends in Cotton are mixed . Support is at 86.20, 85.20, and 84.00 October, with resistance of 88.00, 88.20, and 89.70 October.

FCOJ (NYBOT:OJU13)

General Comments: Futures closed higher for one more day. There has been little selling pressure on the market since the dramatic move lower, but some may develop son as futures are closer to resistance areas. Better weather in Florida seems to be the big problem for the bulls at this time. Showers are reported and conditions are said to have improved in almost the entire state. Ideas are that the better precipitation will help trees fight the greening disease. No tropical storms are in view to cause any potential damage. Greening disease and what it might mean to production prospects continues to be a primary support item and will be for several years. Temperatures are warm in the state, but there are showers reported. Brazil is seeing near to above normal temperatures and mostly dry weather, but showers are possible later this week.

Overnight News: Florida weather forecasts call for showers. Temperatures will average near to above normal. ICE said that 0 delivery notices were posted today and that total deliveries for the month are now 0 contracts.

Chart Trends: Trends in FCOJ are mixed. Support is at 130.00, 125.00, and 122.50 September, with resistance at 135.00, 138.00, and 139.00 September.

COFFEE (NYBOT:KCU13)

General Comments: Futures were lower on a weaker Brazilian Real, but held relatively well because of almost nonexistent offers from origin. The cash market remains very quiet. Sellers, including Brazil, are quiet and are waiting for futures to move higher. Buyers are interested on cheap differentials, and cheap futures. Brazil weather is forecast to show dry conditions, but no cold weather. Current crop development is still good this year. Central America crops are seeing good rains now. Colombia is reported to have good conditions. Robusta prices are holding stronger as the Vietnamese export pace has really dropped. Producers are said to have sold to exporters already, and exporters sold a bit in the last couple of weeks with losses.

Overnight News: Certified stocks are a little lower today and are about 2.744 million bags. The ICO composite price is now 116.50 ct/lb. Brazil should get dry weather except for some showers in the northeast. Temperatures will average near to above normal. Colombia should get scattered showers, and Central America and Mexico should get showers, and rains. Temperatures should average near to above normal. ICE said that 1 delivery notice was posted against July today and that total deliveries for the month are now 810 contracts.

Chart Trends: Trends in New York are mixed. Support is at 120.00, 117.00, and 116.00 September, and resistance is at 123.00, 125.00, and 126.00 September. Trends in London are mixed to up with objectives of 1835 and 1900 September. Support is at 1790, 1755, and 1720 September, and resistance is at 1825, 1855, and 1870 September. Trends in Sao Paulo are mixed to down with no objectives. Support is at 140.00, 137.00, and 134.00 September, and resistance is at 150.00, 151.00, and 155.00 September.

SUGAR (NYBOT:SBV13)

General Comments: Futures closed lower on a weaker Brazilian Real on Friday. Ideas are that mills had not had time to produce more Sugar due to a delayed harvest in Brazil because of rains and also because they are concentrating on producing ethanol. However, the data from Brazil last week showed that there was plenty of Sugar around, anyway. Futures might try to work lower again this week as trends have turned down again and new contract lows were made. There is still a lot of Sugar around, and not only from Brazil. The Indian monsoon is off to a good start and this should help with Sugarcane production in the country. But, everyone is more interested in Brazil and what the Sugar market is doing there. Traders remain bearish on ideas of big supplies, especially from Brazil. Traders in Brazil expect big production to continue as the weather is good.

Overnight News: Showers are expected in Brazil, mostly in the south and southwest. Temperatures should average near to above normal.

Chart Trends: Trends in New York are down with objectives of 1580 October. Support is at 1620, 1600, and 1570 October, and resistance is at 1650, 1665, and 1690 October. Trends in London are mixed to down with objectives of 465.00 and 448.00 October. Support is at 470.00, 466.00, and 463.00 October, and resistance is at 480.00, 485.00, and 490.00 October.

COCOA (NYBOT:CCU13)

General Comments: Futures closed lower on ideas of good harvest weather and active movement of beans to ports in western Africa. Internal prices are reported weak in much of Africa on ideas of weak demand. The weather is good in West Africa, with more moderate temperatures and some rains. Some showers are appearing again in Ivory Coast this week, and the rest of the region is in good condition. Ivory Coast will need more rain soon. The mid-crop harvest is about over, and less than expected production along with smaller beans is reported. Malaysia and Indonesia crops appear to be in good condition and weather is called favorable.

Overnight News: Scattered showers are expected in West Africa. Temperatures will average near to above normal. Malaysia and Indonesia should see episodes of isolated showers. Temperatures should average near normal. Brazil will get mostly dry conditions and warm temperatures. ICE certified stocks are lower today at 4.873 million bags. ICE said that 0 delivery notices were posted today and that total deliveries for the month are 372 contracts.

Chart Trends: Trends in New York are up with objectives of 2260 September. Support is at 2170, 2130, and 2100 September, with resistance at 2250, 2280, and 2300 September. Trends in London are mixed. Support is at 1510, 1500, and 1460 September, with resistance at 1550, 1560, and 1600 September.

See the original article >>

The One Chart That Proves We’re Not in a “Recovery”

by Graham Summers

The US economy continues to fall to pieces, though accounting gimmicks make our employment numbers look better than reality.

As I’ve alerted subscribers of our Private Wealth Advisory newsletter, most of the new “jobs” being created are part-time, not full time positions. Indeed, we’ve added over 500,000 part-time jobs to the US economy in 2013 so far. An incredible 360,000 of this came last month. And all in all we’ve now got a record 28+ million people working part-time in the US.

As for full-time jobs, well, we LOST 240,000 last month. And despite all the rhetoric coming out of Washington about a “recovery,” we’ve actually only added 130,000 in 2013 so far. To put this into perspective, we need to create at least 90,000 new full-time jobs PER MONTH to maintain employment levels based on population growth.

This is why the employment population ratio (take the number of people employed and divide it by the number of people who are of working age) hasn’t really moved in the four years since the Great Recession allegedly “ended.”

This is the #1 reason all the talk of “recovery” and “jobs growth” is totally bogus. If you are willing to fudge numbers and adjust measurements, then sure, things look much better. But the reality is that since 2009, there hasn’t been anywhere NEAR the job growth needed to claim we’re in a recovery.

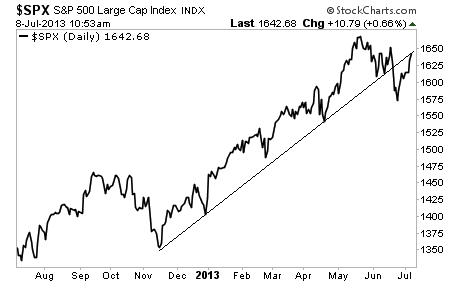
With that in mind, the US stock market has rallied to retest its former trendline. This is a classic breakdown pattern. If we do not reclaim this line and go to new highs then the markets are set for a sharp decline, like to 1,550 if not more. And if you account for where stocks should be based on bonds, the S&P 500 should be down near 1,200.

I warned Private Wealth Advisory subscribers in our most recent issue that the stock market was on borrowed time. The markets tend to stage summer rallies into the Fourth of July weekend, but with interest rates rising and the bond bubble beginning to burst, things are going to get much worse in a hurry.

This could easily become truly catastrophic. The world is in a massive debt bubble and the Central banks are now officially losing control. The stage is now set for a collapse that could make 2008 look like a joke.

See the original article >>

Losing $317 billion makes U.S. debt safer for Mizuho to HSBC

By Anchalee Worrachate and Emma Charlton

The biggest investors in Asia and Europe are keeping their money in Treasuries even after the steepest two-month loss for the securities erased $317 billion of market value.

Mizuho Asset Management Co., which oversees $32 billion, added Treasuries due in 10 years (CBOT:ZN.C) or longer to its holdings in the past month. HSBC Private Bank, with $480 billion in assets, bought U.S. notes when 10-year yields rose to 2.5%. Deutsche Asset & Wealth Management, which manages about $1.3 trillion, is holding debt maturing in less than four years, betting American interest rates will remain subdued.

After doubling holdings of Treasuries to $5.6 trillion in the past five years, overseas investors are resisting the market’s 3.2% slump in May and June and last month’s record $79.8 billion of withdrawals from bond funds. Since the Federal Reserve signaled it may slow the pace of asset purchases this year, the world’s biggest and most-actively traded debt market now offers the highest yields relative to other developed nations in three years.

“It’s the most liquid market in the world,” Yoshiyuki Suzuki, the head of the fixed-income department in Tokyo at Fukoku Mutual Life Insurance Co., which oversees $57.1 billion in assets, said in a phone interview on July 2. “The market has been volatile and some investors may not like it, but there is no reason to avoid U.S. Treasuries. The current movement is an overreaction.”

Holding On

Suzuki said he purchased Treasuries maturing in about 10 years in May, and added to that position in late June.

Benchmark 10-year note yields rose to 2.74% last week from this year’s low of 1.61% on May 1. The price of the 1.75% security due in May 2023 fell 2 2/32, or $20.63 per $1,000 face amount, to 91 1/2 last week.

The yield rose to as high as 2.75% today before dropping seven basis points, or 0.07 percentage point, to 2.67% at 10:03 a.m. New York time.

Yields have risen 32 basis points since June 19, when Fed Chairman Ben S. Bernanke said policy makers may begin to reduce $85 billion in monthly bond purchases should the world’s largest economy meet the central bank’s goals. The average yield in the past five years was 2.74%.

Treasuries maturing in 10 years and more yielded 85 basis points more than non-U.S. sovereign debt on July 5, according to Bank of America Merrill Lynch indexes. Similar maturity non-U.S. government debt yielded more a year earlier.

Comfortable Level

Benchmark U.S. 10-year notes yielded 102 basis points more than similar-maturity German bonds on July 5, the most since July 2006. The spread with U.K. gilts rose to 25 basis points on July 5. As recently as January, U.S. Treasuries yielded 23 basis points less than British government bonds.

“Yields are now getting closer to a level that we are comfortable with,” Willem Sels, the London-based U.K. head of investment strategy at HSBC Private Bank, said in a July 3 phone interview. “Treasury rates may head higher in a longer run, but we don’t envisage a bond bear market scenario. We are not as optimistic as the Fed in terms of growth outlook. Therefore, we think that it’s likely the extreme spike is behind us.”

While the Fed may be preparing to cool quantitative easing asset purchases, other central banks are ready to step up stimulus. European Central Bank President Mario Draghi said last week that there are no plans to end its low-rate policy until economic recovery is assured. The Bank of Japan announced plans to double the monetary base in two years.

Tremendous Increase

The ECB kept its benchmark interest rate at 0.5%. In the U.S., the Fed’s target for overnight loans between banks has remained at zero to 0.25% since the end of 2008.

“We interpret this tremendous increase in yield as an overreaction to Bernanke’s statement,” Yusuke Ito, a money manager at Mizuho Asset Management in Tokyo, said in a phone interview on July 2. The Fed said “it will slow down quantitative easing, not raise interest rates,” Ito said. “The market is expecting an interest-rate hike to come soon. We don’t think that is going to happen. We are positive on Treasuries.”

MEAG Munich Ergo Asset Management GmbH’s Reiner Back, who helps oversee $305 billion as head of fixed income and foreign exchange in Munich, said July 3 that he remains positive on Treasuries. The increase in yields has “re-established value,” he said.

Fund Withdrawals

Deutsche Asset & Wealth Management in Frankfurt favors shorter-term notes, betting that subdued inflation will deter the Fed from raising rates before 2015. Amundi Asset Management, which has an equivalent of $970 billion in assets, said it would consider 10-year Treasuries “on a tactical basis” if yields approach this year’s highs.

The threat of reduced bond buying by the Fed caused the $10.5 trillion Treasuries market to lose 2% in May, the worst month since December 2009. It fell another 1.3% in June, according to a Bank of America Merrill Lynch index.

Investors who poured $1.26 trillion into bond funds in the past six years pulled $70.8 billion from mutual funds, typically owned by individuals, last month through June 27, according to TrimTabs Investment Research. They withdraw $9 billion from exchange-traded funds, which both institutional and private investors buy, in the same period.

Japanese investors sold a record 3 trillion yen ($29.7 billion) in May, figures from the nation’s Ministry of Finance showed today, the most in data going back to 2005.

Employment Report

Yields don’t reflect the improving U.S. economic outlook, according to Paris-based Carmignac Gestion SA, which oversees $70 billion. Policy makers on June 19 raised their growth forecasts for next year to a range of 3% to 3.5% and reduced their prediction for unemployment to as low as 6.5%. The growth forecast is higher than the 2.7% expansion estimate of economists in a Bloomberg News survey.

Employment increased more than forecast in June, with payrolls climbing by 195,000 workers for a second straight month, the Labor Department reported on July 5.

“U.S. rates are going to normalize and will grind higher,” Sandra Crowl, a member of Carmignac’s investment committee, said in a phone interview on July 3. “Rates in the U.S. as they stand currently are too low for the growth level, because of the effect of the quantitative easing.”

The money manager expects 10-year rates to rise to about 3% by the end of the year and owns a smaller percentage of Treasuries than is recommended by its benchmarks, she said.

Consumer Confidence

With yields this low, some investors say returns on Treasuries will remain suppressed for years to come, ending the three-decade bull market in bonds. The rate on 10-year notes is less than half the 6.4% aggregate earnings yield of stocks in the Standard & Poor’s 500 Index and the gap is about double the average of 1.9 points since 2000.

Evidence of a U.S. economic recovery has dimmed the allure of government assets and may trigger further bond funds outflows, said Donald Ellenberger, who oversees about $10 billion as co-head of government and mortgage-backed securities at Federated Investors in Pittsburgh. U.S. consumer confidence climbed in June to the highest level in more than five years. Home prices have increased 12% since April 2012, according to the S&P/Case-Schiller Composite Index.

“The biggest risk to the bond market right now is continued outflows from mutual funds and ETFs,” Ellenberger said in a phone interview on July 5. “The outflow in June might only be the tip of the iceberg.”

Foreign Ownership

Ellenberger said if retail investors continue to sell bonds to cut duration, a move aimed at reducing an impact of higher interest rates on bond investments, yields will climb further.

Bulls say Treasuries will remain attractive because they form the world’s most liquid pool of securities. The $10.5 trillion market compares with $1.8 trillion in Germany and Britain. Primary dealers traded $504 billion of U.S. government debt the week ended June 13, according to Fed data. Daily turnover of French government bonds was around $18 billion.

China’s holdings of U.S. government securities rose 157% since the start of 2008 to $1.3 trillion, or 22% of total U.S. government securities owned by foreigners, according to the most recent data compiled by Bloomberg. Japan’s $1.1 trillion was up 88% from five years ago.

Analysts forecast Treasuries will rally from current levels. Ten-year note yields will drop to 2.41% by year- end, according to the median forecast of 78 strategists surveyed by Bloomberg.

Preclude Recovery

The selloff lifted the Treasuries term premium, a model that calculates the risk of longer-duration debt. The measure, which includes expectations for interest rates, growth and inflation, climbed to 0.46% on July 5, the most since July 2011, according to asset manager Columbia Management Investment Advisers LLC. That compares with an all-time low of negative 0.64% a year ago. A negative reading suggests investors are willing to accept yields below what’s considered fair value.

Higher yields could backfire and damp economic growth, according to Deutsche Bank AG. HSBC Holdings Plc, Europe’s biggest bank and the parent of HSBC Private Bank, predicts that 10-year yields approaching 3% will slow the U.S. by hurting the housing market. That, and sluggish emerging economies, will underpin demand for haven assets, the bank said.

Safe Haven

“This is a selloff that is more likely to preclude, rather than reflect recovery,” Deutsche Bank analysts including Dominic Konstam, the head of rates research, wrote in a note dated June 28. “Market turbulence could short circuit any virtuous circle dynamic that would ultimately lower unemployment and raise wages.”

Developing nations expanded 4% in the first quarter, the least since 2009 and down from the average 6.4% over the past decade, according to Capital Economics. Investors pulled money from emerging markets at the fastest pace in two years as cooling growth and the prospect of less U.S. stimulus sapped demand for financial assets from India to Brazil.

“We had periods of selloff which involved both Treasuries and higher-risk assets,” said Eric Brard, the global head of fixed income at Amundi in Paris. “It’s likely that increased risk in some market segments such as emerging-market debt will drive demand for Treasuries. We tend to be more interested in safe-haven assets than higher yields in that environment.”

See the original article >>

It’s all about the data

By Louis Lovas

For the first quarter of this year, equity markets soared on a sugar high; market indices regularly hit new highs as exhibited by the S&P 500’s (CME:SP.C) 12% rise since the end of last year. The debate rages on how long this will continue. There are numerous factors that could make this year different from the past three, ranging from the continuation of central bank easing policy to improved economic conditions. How do we know this? It’s all in the data as the major economic indicators and market indices are tracked, scrutinized and compared to past results.

Yet the undercurrent of the equity market’s exuberance is a continued downward trend in volumes and trader-loving volatility. NYSE’s volume composite index (MVOLNYE) has been on a slow slide reaching all the way back into last year, down nearly 10% year-over -year and the VIX too hit a six-year low. Again, how do we know this? It’s all in the data or more specifically, the analysis of the data over time.

For the professional trader, volumes are a reflection of money flows, achieving margins hinges on total volume and a sprinkle of volatility, all the while maintaining an accurate audit trail of trading activity. With the crush of compliance with increasing regulatory actions cascading from Dodd-Frank, the Consolidated Audit Trail (CAT) and the repercussions of Knight Capital’s mishap in the SEC’s proposed RegSCI (Regulation Systems Compliance and Integrity), we live under a cloud of market uncertainty and regulatory oversight. It is a new normal, a fait accompli that is shaping the future and forcing firms to elevate their game. And how do we know this? It’s all in the data.

The new normal may represent a dearth of (market) data but also mandates an imperative that firms recognize that its intrinsic value impacts the bottom line. Sluggish reactions to dynamic markets lead to business decision missteps that can result unknowingly in risk-laden exposure.

Disruptive power of innovation

Amid the cacophony of the narrative of algorithmic trading unfolds the story of Complex Event Processing (CEP), a new breed of technology and a tool for understanding data.

CEP is a story of the disruptive power of innovation, a nice segue to understanding data, specifically temporal analysis of time-series data. It excels at exacting data consistency from trades, quotes, order books, executions and even news and social sentiment which can instill trader confidence for ensuring profit and minimizing risk.

With so many liquidity sources – having a consistent and uniform data model across fragmented markets enables effective analysis for trade model design, statistical pattern analysis and understanding order book dynamics. This spans real-time, historical and contextual content – practically speaking it’s hard to separate them. This starts with an understanding of what is a time series.

In techie-speak time series refers to data that has an associative time sequence, a natural ordering to its content such as rates, prices, curves, dividend schedules, index compositions and so on. Time Series data is often of very high velocity. The UTP Quote Data Feed (UQDF) provides continuous time-stamped quotations from 13 U.S. market centers representing literally hundreds of terabytes annually.  The data’s temporal ordering allows for distinct analysis revealing unique observations and patterns and the possibility for predicting future values. Time series often are called data streams that represent infinite sequences (i.e. computation that does not assume that the data has an end) or simply real-time data, such as intra-day trades. CEP is a temporally-sensitive programming paradigm designed for calculating and extracting meaningful statistics that are unique to and dependent on the data’s temporal nature. This includes not just the notion of duration and windows of time, but also temporal matching logic of a fuzzy nature such as trade prices to the nearest or prevailing quote.

Consider the scenario where there is a need to understand historic price volatility to determine accurate statistical thresholds of future price movements. It’s not simply a matter of determining price spikes but discerning when they occur, for how long and when a high (or low) threshold is crossed. It is CEP’s intrinsic sense of time that makes it uniquely suited to analyzing time series for achieving data consistency, the foundation for accurate trade decisions. Consistency is also about eliminating anomalous and spurious conditions, bad ticks if you will. But the trick is recognizing a bad tick from a good one. Historical precedence, ranging from the last millisecond to the previous year provides the benchmark for the norm and the means to recognize deviations. CEP’s analytical effectiveness is relative to the depth of the data set. The further back you look the more confidence can be achieved going forward. Of course this assumes that the future behaves like the past.  This is the basis for back-testing algorithmic trading models.

Data can be an ally for back-testing, simulation, valuation, compliance, benchmarking and numerous other business critical decisions. It is the fodder for understanding the global economy and the markets. The natural temporal ordering of time series data draws analysis distinct from any other and has given rise to a whole field of study and discourse. For understanding complex event processing, it’s all in the data.

See the original article >>

Gold bear-market history signals second-half hope after rout

By Nicholas Larkin

Investors in gold funds, whose value slumped a record $44.7 billion in the second quarter, may do better in the second half of the year if history is any guide.

Gains averaged 1.3% in the second half from 1981 to 2000, when gold (COMEX:GCQ13) endured a two-decade bear market, data compiled by Bloomberg show. First-half losses averaged 3.9% in the period. Investors sold 404.4 metric tons from exchange-traded products backed by the metal in the second quarter as prices tumbled into a bear market in April.

Gold is poised for the first annual drop in 13 years after some investors lost faith in the metal as a store of value. The rout already strengthened demand for jewelry and coins around the world and the second half of the year usually sees gains in physical demand for wedding seasons and religious festivals in Asia, including India and China, the biggest buyers.

“The physical trend has always been very seasonal,” said Bernard Sin, the head of currency and metal trading at MKS (Switzerland) SA, a bullion refiner in Geneva. “Physical players are a different breed. They are always buying on the dip. Physical support will continue to be present and it will definitely trigger interest.”

The metal returned an average of 11% in the second half of the year during the bull market that began in 2001, more than double the average first-half increase. Demand was stronger in the second half in nine of the past 12 years, according to data from Thomson Reuters GFMS. Bloomberg competes with Thomson Reuters in selling financial and legal information and trading systems.

Richard Nixon

Gold for immediate delivery dropped 26% to $1,235.32 an ounce this year in London. The metal fell 23% in the second quarter, the most since at least 1920, according to data compiled by Bloomberg. Former U.S. President Richard Nixon severed the dollar peg to gold in 1971 and the government lifted curbs on citizens owning gold at the end of 1974.

Investors accumulated a record 2,632.5 tons through ETPs by December amid unprecedented money printing by central banks. Federal Reserve Chairman Ben S. Bernanke said June 19 that asset purchases may slow if the economy improves. The U.S. Dollar Index reached the highest level since 2010 today.

Gold plunged 11% in June as India, the biggest buyer, imposed curbs on imports to trim its trade deficit. The country’s imports may drop 52% in the third quarter, according to the All India Gems & Jewellery Trade Federation.

Turkey Demand

Imports into Turkey, the fourth-biggest consumer, more than doubled to a 4 1/2-year high of 45.5 tons in April. They held above 43 tons in May and June, the longest run in data on the Istanbul Gold Exchange’s website going back to 1995. Jewelry represented about 60% of the country’s consumer demand for gold last year, according to the World Gold Council.

Bullion for immediate delivery in China, the second-biggest user, averaged about $37 more than the London price since mid- June, Shanghai Gold Exchange data show. It was about $21 this year before then. The increase signals strengthening demand, Standard Bank Group said July 3.

While lower prices will make physical purchases more attractive and mining less profitable, there’s been a “dislocation” between the physical and investment market in gold over the past several months, said Ole Hansen, head of commodity strategy at Saxo Bank A/S in Copenhagen.

“Given the size of the paper market in ETFs and futures, the physical market is often having more of a psychological than actual impact,” Hansen said. “For now though, rising interest rates and a stronger dollar will keep gold under pressure no matter how strong the physical demand.”

See the original article >>

Sugar: Out of sync with fundamentals?

By Sholom Sanik

After a brief relief rally, the sugar market (NYBOT:SBV13) has returned to its bearish ways. Over the past year, the market has rallied leading up to — and sometimes after — the expiry of the front-month contract, as seen in Chart 1. In all likelihood, the rallies were the result of covering by shorts who wanted to book their profits and did not wish to roll over their positions. The expiry of the July 2013 contract on June 28 was certainly due to short covering, as evidenced by the over-100,000-contract drop in open interest and  the contraction in the net-short position held by funds (Chart 2).

There have been some developments on the fundamentals front.

Wet weather in Brazil during the first half of June hampered sugar crushing, prompting larger-than-expected ethanol production. It’s been drier over the past few weeks, but sugar output was down enough for analysts to revise their sugar output forecasts. Some estimates for 2013-14 output have fallen by more than 2 million tonnes.

Unless there is an unexpected shift in the ethanol/sugar ratio as the crushing season develops, we are no longer looking at record sugar production. Original estimates called for over 35 million tonnes, but the tally now looks to be closer to last year’s output of about 34 million tonnes.

The government incentives for ethanol producers – not to mention competitiveness spurred by the fact that crude oil is trading over $100 per barrel – have been effective. Output in the center south region, where 90% of Brazilian cane is grown, will be 25.7 billion liters, up from an earlier forecast of 24.5 billion liters, and compared with only 21.4 billion liters for the 2012-13 season.

The ethanol/sugar ratio is estimated at 55.2%/44.8%, above a previous forecast for 53.5%/46.5%, and compared with 50.5%/49.5% in 2012-13.

Last season we saw wild swings in the estimates for Brazilian sugar production because of alternating favorable and unfavorable weather systems, and there is no reason not to expect the same this year. So while the change in the outlook for Brazil is clearly bullish at the moment, it is not carved in stone. Certainly this is the view of traders who have pushed front-month October to new lows in recent days.

Another potentially bullish factor down the road – also, which has made no impression at all on bears – is early forecasts for 2013-14 Indian production. Fears of a poor monsoon have passed. The monsoon arrived on time in early June, and the rains have been at above-average levels in cane-growing regions. Still, Maharashtra province, the largest-producing region in India, continued to suffer from last year’s drought, and cultivated area fell by 25%. That would draw down Maharashtra province output by about 2 million tonnes, to 6 million tonnes.

Overall, Indian sugar output is estimated to fall to about 22 million tonnes in 2013-14, down from 24.6 million tonnes in 2012-13. Last year’s consumption was 23.6 million tonnes, and with a growing population, it is inconceivable that usage will not be at least as much. This will leave India with a production/consumption deficit and the need to tap into inventories.

The government’s liberal export policy facilitated exports of over 3 million tonnes in 2011-12 and 2012-13. For this coming season, however , analysts have acknowledged that new supplies will be much tighter than in recent years. Exports are estimated to be negligible, at about 500,000 tonnes in 2013-14.

At this point, the global balance sheet is still expected to show a production/consumption surplus for 2013-14, but all the major sugar analysts have been inching their forecasts down. The average estimate calls for a surplus of about 4 million tonnes, compared with close to 10 million tonnes for 2012-13.

Finally, as we’ve mentioned many times in these pages, the cost of production has moved up substantially over the past few years. If the world sugar price at 20¢ per pound proved to be a disincentive to sugar cultivation, it has certainly become a much larger factor at 17¢ per pound.

We continue to believe that the purchase of out-of-the money calls will prove to be rewarding, even if repeated several times.

See the original article >>

Key 3rd-Quarter Pivot Levels

by Tom Aspray

Stocks celebrated the 4th of July with some low-volume fireworks of their own. The minor mid-week correction does look like a dip that should have been bought even though just the initial support levels were tested.

Asian stocks were under pressure on weak data out of China as the Shanghai Composite was down over 2%. In contrast, the European markets are strong in early trading with the German Dax up over 2%. The US futures are showing nice gains in early trading and a close above the June highs will confirm that the correction is over.

Pivot point analysis can be an important tool in helping determine the short-, intermediate-, as well as the longer-term trend. As I discussed in The Most Powerful Pivot Level, the quarterly pivots introduced to me by John Person provide some valuable insights into the market’s trend.

The Spyder Trust (SPY) started off the year by gapping above the quarterly pivot on the first trading day of the year and held well above the quarterly pivot for all of the 2nd quarter.

chart
Click to Enlarge

In the above table, I have listed the quarterly pivot levels including the R1 & R2 resistance, as well as the S1 & S2 support levels for 13 of the key ETFs along with the cash S&P 500.

Though SPY traded below its 3rd quarter pivot briefly last week, it closed Friday well above it. All of those markets highlighted in green ended the 2nd quarter above the 3rd quarter pivot level. The Consumer Staples Sector SPDR Fund (XLP), Materials Select Sector SPDR Fund (XLB), and Utilities Select Sector SPDR Fund (XLU) closed on Friday below their 3rd quarter pivot levels and they are highlighted in red.

A look at how some of the key markets acted with regard to their quarterly pivot levels will help you navigate this new quarter. I suggest that you print out this table and refer to it this quarter as these ETFs often turn once their pivot levels are reached.

chart
Click to Enlarge

Chart Analysis: The weekly chart of the Spyder Trust (SPY) shows that the April low at $153.55 held well above the 2nd quarter pivot at $152.65.

  • The decline in late June took the SPY to a low of $157.42 and closed June at $160.42.
  • The July 1 open was above the 3rd quarter pivot at $161.01 and it closed last week over 1% above its pivot.
  • The R1 resistance is at $168.48, which is just below the May high of $169.07. The weekly starc+ band is at $170.57.
  • The weekly on-balance volume (OBV) closed back above its WMA last week and it needs to continue higher this week to complete its consolidation formation.
  • The S&P 500 A/D line (not shown) rose sharply last week and now has moved well above the June highs.
  • The 20-week EMA is now at $158.97.

The PowerShares QQQ Trust (QQQ) ended June at $71.27, which was above the 3rd quarter pivot at $71.03.

  • There is next resistance at $73.72-$73.76 with the R1 resistance at $75.19, which is just above the May highs at $74.95.
  • The weekly starc + band is at $76.21 for this week.
  • The weekly relative performance appears to have completed its bottom formation as it has closed above the resistance at line b (see arrow).
  • The RS line had formed higher lows, line c.
  • The weekly OBV is back above its WMA but is still below the long-term resistance at line d.
  • On a drop below the quarterly pivot at $71.03, the 20-week EMA is at $70.74 with the recent low at $69.15.

chart
Click to Enlarge

The iShares Russell 2000 (IWM) closed June at $97.00, which was well above the 3rd quarter pivot at $95.50, and it closed the weekly just below the key swing high of $99.70.

  • The May high was $100.38 with the R1 resistance for this quarter at $101.88.
  • The weekly starc+ band is at $103.91.
  • The relative performance has closed above the resistance at line a, that goes back to early 2012.
  • This indicates that the small-cap Russell 2000 is now outperforming the S&P 500.
  • The RS line is well above its WMA and the longer-term support at line b.
  • The weekly OBV is now above its WMA after breaking its uptrend (line c) four weeks ago.
  • This makes the close this week more important as it would be good to see higher volume than last week’s levels.
  • There is initial support at $97.45 and then the quarterly pivot $96.60.
  • The 20-day EMA is at $94.89.
  • The chart shows that the 2nd quarter pivot at $91.50 was violated for nine days in March (see circle #1) as the low was $89.21.

The iShares Dow Jones Transportations (IYT) ended June at $109.89, which was below the 3rd quarter pivot at $110.53.

  • IYT did close last week on its highs but is still well below the June highs at $114.41.
  • The R1 resistance is at $116.66 with the May high at $117.30 and weekly starc+ band at $119.17.
  • The relative performance still shows a pattern of lower highs, line c, and is below its WMA.
  • The daily RS line (not shown) appears to be bottoming but it has not been completed yet.
  • The weekly OBV held above its WMA on the recent correction and a move above the prior peak would be even more bullish.
  • The daily OBV (not shown) is still below its WMA.
  • The June low was at $106.30, which was above the 2nd quarter pivot at $105.99.

What it Means: All of the markets except the Consumer Staples Sector SPDR Fund (XLP), Materials Select Sector SPDR Fund (XLB), and Utilities Select Sector SPDR Fund (XLU) are positive based on the quarterly pivot analysis.

If the iShares Dow Jones Transportations (IYT) can become a market-leading sector, it will be a further positive for the overall market. I still cannot rule out one more sharper one-two-day pullback before the market challenges the previous highs.

How to Profit: For the PowerShares QQQ Trust (QQQ), go 50% long at $71.34 and 50% at $69.78, with a stop at $68.67 (risk of approx 2.7%).

For the iShares Russell 2000 Index (IWM), go 50% long at $97.68 and 50% at $96.36, with a stop at $93.69 (risk of approx 3.4%).

Portfolio Update: For the iShares Dow Jones Transportations (IYT), should be 50% long at $110.18 and 50% long at $109.42, with a stop at $105.44 (risk of approx. 3.7%).

See the original article >>

Analysts boosting S&P 500 target 11% reduce earnings growth

By Inyoung Hwang and Katie Brennan

The same equity analysts who lowered second-quarter profit growth predictions to almost nothing in 2013 are raising price forecasts, convinced the economy is growing fast enough to lure more investors and boost valuations.

Standard & Poor’s 500 Index (CME:SP.C) earnings rose 1.8% last quarter, down from a projection of 8.7% six months ago, according to more than 11,000 analyst estimates compiled by Bloomberg. At the same time, share-price targets for companies from GameStop Corp. (NYSE:GME) to Goldman Sachs Group Inc. (NYSE:GS) are rising at the fastest rate in two years. The U.S. equity gauge will increase 8.9% to a record 1,777.91 should the forecasts prove accurate.

Bulls say expectations for higher valuations show analysts share Federal Reserve Chairman Ben S. Bernanke’s view that the economy may gather enough momentum to expand on its own. Getting to their target would raise the index’s earnings multiple to 16.4, still about 12% lower than its 25-year average. Bears say price appreciation without profit gains shows the five-year bull market is fading and declines are inevitable. Second-quarter earnings season begins today.

“There’s a tight relationship between confidence and multiples,” Joseph Tanious, a New York-based global market strategist at JPMorgan Funds, which oversees $400 billion, said by telephone on July 3. “Confidence at these levels, while still depressed, is clearly rising,” he said. “You have an improving U.S. economy albeit at a slow pace.”

Earnings Season

Stocks advanced last week, with the S&P 500 climbing 1.6% to 1,631.89 after U.S. employers added 195,000 jobs in June and manufacturing rose more than forecast. While the index has fallen 2.2% since the May 21 record, it’s up 14% for 2013. The U.S. equity gauge climbed 0.7% to 1,643.02 as of 10:47 a.m. in New York.

Alcoa Inc. (NYSE:AA), the biggest U.S. aluminum producer, is the first Dow Jones Industrial Average company to report quarterly earnings today.

Even as the S&P 500 rallied 60% in the last three years, its price-earnings ratio remained below the long-term average of 18.6, according to data compiled by Bloomberg and S&P that begins in 1988. Valuations have held steady as profit growth matched gains in share prices since the bull market began in March 2009.

Reaching analyst price forecasts would send the S&P 500 more than 6.5% above the all-time high of 1,669.16 set May 21. Operating profits projected to reach a record $108.40 a share this year would give the index a valuation of 16.4, compared with 17.5 when the market peaked in October 2007.

Investor Sentiment

“If we were to say people were dipping their toe in the water on the economy a few years ago, now they are mid-thigh,” Joe Kinahan, chief derivatives strategist at TD Ameritrade Holding Corp., said in a July 5 phone interview from Chicago. His firm has $499.3 billion in client assets. “There is every reason to believe that the multiples should also increase.”

After three years of growth, earnings increases are slowing. Income in the S&P 500 advanced an average of 4.3% in each of the last five quarters, compared to the 28% average for 2010 and 2011, Bloomberg data show.

“You will need a strong acceleration of earnings in the third and fourth quarters for the full-year estimates to come through,” Robert Royle, a manager at the North American Trust fund of Smith & Williamson Investment Management LLP, who helps oversee $21 billion in London, said July 2. “You’ll have multiple expansion in an economy that’s not really growing fast enough.”

Slower Growth

U.S. gross domestic product will increase 1.9% this year, down from 2.2% in 2012, according to the median projection of 86 economists. The recovery since the 2009 recession is the slowest since World War II, data compiled by Bloomberg show.

While analysts say profits in the third and fourth quarters will rise 5.5% and 11.2%, respectively, their forecasts usually come down as the reporting season approaches. Since 2009, projections have declined 6.2 percentage points in the six months leading up to a quarter’s end, according to data compiled by Bloomberg.

Lower expectations helped about 73% of the companies in the benchmark measure exceed forecasts by an average of 5.1% for the first three months of the year, according to data compiled by Bloomberg. At the same time, 51% of companies reported sales that trailed estimates.

Lower Bar

Analysts are looking past profit growth this year and predicting improving investor sentiment will push stocks higher. They’ve boosted price estimates for the S&P 500 by 11% from 1,608.50 on Dec. 28, the fastest rate since July 2011, according to data compiled by Bloomberg.

U.S. equity volume, in retreat since 2009, is showing signs of picking up. Trading on all American markets has averaged 6.77 billion shares a day since the start of June, compared with 6.35 billion between January and May and 6.42 billion in 2012, according to data compiled by Bloomberg.

Shares of the three biggest public discount brokerages have rallied an average of 51% this year as individual investors buy and sell more equities. Daily average revenue-generating trades increased an average of 14% in May, compared to a year ago, according to data from Charles Schwab Corp., TD Ameritrade and E*Trade Financial Corp.

Economic Outlook

Economists are growing more optimistic after consumer spending rebounded in May, new home sales climbed more than estimated and durable goods orders beat forecasts. Growth estimates for the July-through-September period rose to 2.3% from 2.2% in May, according to data compiled by Bloomberg. U.S. gross domestic product will expand 2.7% next year, the most since 2006, estimates show.

The Fed may taper its bond purchases, or quantitative easing, if the U.S. economy improves in line with forecasts, Bernanke said June 19. The central bank has been buying $85 billion of bonds as part of an unprecedented stimulus plan after it cut interest rates near zero% December 2008.

While the size of the S&P 500 rally since 2009 is comparable to the gain in the late 1990s during the Internet bubble, valuations are about half as high. Of the 500 companies in the index, 448 stocks trade lower than their price estimates, the most since December, Bloomberg data show.

Analysts boosted price estimates for GameStop 46% this year, even as they slashed second-quarter earnings estimates 80%, according to data compiled by Bloomberg. The largest video-game specialty retailer, based in Grapevine, Texas, trades at 13.6 times earnings in the past year, or 23% less than its average over the last decade.

GameStop Price

“The share price completely looks through this year,” said Michael Pachter, a Los Angeles-based research analyst at Wedbush Securities Inc., said during a July 3 phone interview. He rates the stock the equivalent of a buy and predicts computer game releases in 2014 will fuel gains. “They’re going to have a really big start of the year next year and that should be a big positive.”

Second-quarter profit estimates for Goldman Sachs have fallen 5.4% in 2013 yet forecasts for shares of the Wall Street bank have increased 21%. Shares will rise 5.2% to $161.19 in the next year, bringing its price-earnings ratio to 11.2, or 7.1% higher than today.

Goldman Earnings

“I don’t really care what the company earns in the quarter,” Richard Bove, a bank analyst with Rafferty Capital Markets LLC who estimates the stock will reach $185, said in a July 3 phone interview. “It would appear that in each one of Goldman’s core businesses, underwriting and trading, the outlook over the next couple of years is quite strong.”

Hess Corp., the New York-based energy company, trades 10% below its decade-average multiple of 13. Hess will jump 18% to $80.21 in the next 12 months, up from an earlier forecast for $65.86, according to data compiled by Bloomberg. With second-quarter earnings estimates down 13% from six months ago, the price multiple would expand to 12.8, almost to the historic average.

“We are still going higher,” Phil Orlando, the New York- based chief equity strategist at Federated Investors, which has about $380 billion in assets under management, said by telephone on July 2. “We’re only halfway through the multiple expansion I would expect.”

See the original article >>

Why Are We Still in Debt?

By tothetick

It seems sometimes these days that we (or rather some out there) might have just forgotten the real definition of the word ‘debt’. So, for their benefit: in other words, ‘debt’ is an obligation to pay back or to render something to someone else for a service or good that has been provided. It’s a liability and an obligation, but the debt that we are running up (whether that be in the US or in the EU or elsewhere) doesn’t seem like it is ever going to be paid back. Have people forgotten what the word means or are they just blatantly flouting the rules and regulations that have been set up?

Wasn’t debt supposed to be a temporary measure that was meant to enable us to do things that we wouldn’t have otherwise been able to do? Yes, right! But, did it mean that we would give ourselves the permission to do whatever we wanted, however we wanted and never have to be answerable and liable for the money that was spent? Why are we even bothering to make make-believe reality by telling everyone that just round the next corner there is going to be some recovery lurking behind a tree waiting to jump out at us and say ‘yoo-hoo, I’m over here’? Trouble is the ‘yoo-hoo’ has turned into ‘boo-hoo’, hasn’t it? Shouldn’t we just go the whole hog and admit that we are not knee-high in that debt today, but that it’s up to our necks right this minute and that we are just not going to be able to pay it back, whatever happens?

We might have cut down in our own personal expenses in the past few years. The state has imposed austerity measures in the finger-wagging speeches that tell us ‘the coffers are empty, people…we have to do this, despite the fact that we want to do everything else’. Our states have gone bankrupt and the money has fled to healthier climes. If it hasn’t fled, it has been diluted into a wishy-washy mess of liquidity by pumping currencies into those economies to feed the thirst of the people, before they vote out the governments that is!

So, why are we still in debt? Why haven’t those governments changed what they promised to change and why haven’t they given us what they pledged they would do? Why, oh why, are we still in debt?

Student-Loan Debt

Debt: Student Loans

Debt: Student Loans

The average student-loan debt stands at $32, 054 today in the USA. That’s a total of $992.7 billion if we add all the student loans together. This is an increase of 7% in comparison with last year. So, more and more students are taking out loans, unable to pay their own way to go through further or higher education these days. The vast majority of that money (all but give or take about $150 billion that has been financed by private companies) is federal debt. There are about 37 million students that currently have loans and about 14% (an increase from 2012’s figure of 11%, which was already a 2.1% increase from the previous year) of those have defaulted on a repayment schemes (which is roughly $85 billion). About 41% are considered as delinquent (defaulting on their repayment plans) within the first five years!

Credit-Card Debt

Debt: Credit Cards

Debt: Credit Cards

When people don’t have enough money to meet their daily needs they resort to credit. US credit debt stands at $15, 216 per household in 2013. Six months into the financial crisis of 2008 and the USA had reached its peak in terms of indebtedness of US households. Credit-card companies were cashing in on the crisis and providing easy (unchecked) access to credit. It was fast and simple. But, it was also bad for the economy. There was a fall from the heights of 2009, when credit-card companies were forced to write off debt for some households. But, credit-card debt stands at almost $700 billion today in the USA. Although, we have seen a fall in the first-quarter statistics for the delinquency rate (ratio of borrowers that are 90 days past their payment dates), with a national average of 0.69%. That’s down from 2012’s figure of 0.73%.

Payday Loans

Debt: Payday Loans

Debt: Payday Loans

Payday loans are bigger business than they ever were in a bid to get around the austerity and the cut backs that are being imposed. For about $15 borrowers can get an advance on their pay checks and then agree to pay that back when they get their next one. There is about $39 billion that is being loaned out at any one time in this way in the US at the present time. Short-term cash-flow problems are currently being experienced by about 19 million households in the USA. Sometimes due to the fact that such loans are so short in length, households end up never being able to pay that money back and it just keeps rolling over. Except interest rates over a year might just end up working out for those households at the 400%-mark! That increases the debt-laden lives of people. But, hey can you blame them? They are taking the example that has been set by successive administrations for the past thirty-odd years.

Medical Debt

Debt: Medical Costs

Debt: Medical Costs

According to statistics provided by the Commonwealth Fund (a nonprofit medical-research foundation), there are 24% of US citizens that are aged between 19 and 64 that currently have medical debts. 62% of those people that have credit-card debt put down medical expenses as part of their debt. Nearly two-thirds of those that are declared bankrupt households have medical bills that make up about half of their total debt.

Conclusions?

Before Ronald Reagan was elected President of the US gross national debt stood at under $1 trillion, which meant 33% of Gross Domestic Product. That soon changed as a new era of spending was ushered in.

Reagan added another 20% on to that bring debt to 53% of GDP (at $2.9 trillion). George H.W. Bush notched up another $1.1 trillion and brought the USA to debt of 64% of GDP. There was really no point stopping now, as the era of spending had begun, with no controls over the economy in a bid to make more money by throwing good (if ever there was good money, once upon a time) after bad in the hope that the former would pull it off. Needless to say that it didn’t since under Bill Clinton the USA had a national debt of $5.6 trillion. However, he did manage to reduce that in terms of a percentage of GDP (it fell to 56.5%), for the first and last time ever! By the time George W. Bush had finished with his stint in office, the USA had reached 77% of GDP in terms of national debt and it stood at $10.6 trillion. Under Barack Obama, the USA has seen that increase to 105% of GDP, and the country is nearing $17 trillion today. Outstanding public debt currently stands at $16.749 trillion today. That works out to $52, 970 per person in the USA, and the national debt is increasing by $2.44 billion every 24 hours (since last year). It seems very much like a disease that has no known cure at the moment. It will top $17 trillion by this fall according to analysts. Well, quite honestly, you don’t even need to be an analyst to know that we aren’t going to halt that debt between now and then.

So, either we allow our debt to accumulate more, or alternatively, the US government folds and refuses to spend a single cent for the next year, as well as raise takes by about 10% for everybody since the first would not be enough if done on its own. All of that money would then pay off the $17 trillion that the country has notched up over the past thirty-odd years. Obviously, the scenario is not going to happen, is it? So, we’ll opt for the first choice, and make out that we are going to pay it back, without ever actually having to do so!

But, is there any other solution? Surely, admitting that the debt won’t get paid back would lead to anarchy. What’s the point in working if the state can just print money and bail us out if it all goes south (or rather, east)? Admitting that our debt is so big today and that we are not going to counteract anything that is making that situation worse means that the only thing left at our disposal is to patch over the cracks with rice paper. Trouble is with rice paper, it’s see-through and never lasts.

See the original article >>

Yield differentials point to lower yen futures

By Marcus Holland

The combination of better than expected data in the U.S. and an accommodative central bank in Japan has pushed Yen futures (CME:J6U13) lower.  The Bank of Japan (BOJ) is only at the beginning of its quantitative easing plan, and the repatriation of funds by Japanese investors has created headwinds for the BOJ, which is hampering the growth process.  With growth in Japan just beginning to show signs of traction, Yen futures should decline in the months to come.

The yield differential is usually a strong driving force behind the movements in the currency market.  The yield differential is the difference between one country’s yield on government bonds and another country’s yield on government bonds.  The yield differential between U.S. 10-year bonds (CBOT:ZBU13) and Japanese 10-year bonds has climbed to 182 basis points, allowing long term investors to benefit from holding U.S. bonds relative to Japanese bonds.  The differential is rising because the U.S. economy is starting to show signs of growth, which is driving up yields across the interest rate curve.

The most recent data point of note was the July 5 Employment report released by the Department of Labor.  According to the BLS, nonfarm payrolls increased by 195,000 jobs compared to the 150,000 expected by economists.  April and May’s numbers were also revised.  April increased by 20,000 jobs while May saw an increase of 50,000 jobs.  In addition to the positive report, average hourly earnings increased by .4%, which was more than expected.  In a separate report, generated from a household survey, the unemployment rate remained unchanged at 7.6%.  This was largely due to an increase in the participation rate from 63.4% to 63.5%.  Almost immediately after the government employment report, U.S. 10-year yields increased 11 basis points reaching a three-year high.

The increase in U.S. yields is somewhat concerning to the Federal Research, which is purchasing $85 billion a month of bonds in an effort to keep rates low and spur on lending.  The Fed has used rhetoric to attempt at keeping long term rates low, but growth in the economy will be difficult to counteract.

One of the headwinds that have been capping the rise in USD/JPY, which would benefit Japanese exporters, is the record amount of selling of foreign bonds and repatriation of Japanese wealth. Japanese investors sold a record amount of foreign notes and bonds in June. The most recent Ministry of Finance report shows a net sale of ¥2.957 trillion worth of notes and bonds. Japanese investors also sold ¥377.7 billion of foreign stocks.  When Japanese investors sell U.S. stocks they need to sell dollars and buy yen, which is seen as a headwind for the USD/JPY.  Currency exchange between the pair is expected to attract much interest over the coming months.

Click to enlarge.

Yen futures have been a short term down trend over the past month, and are poised to test support near 0.9700.  A break of this level could lead to a test of weekly support at 0.9500.  Momentum continues to point to lower futures prices with the MACD printing in negative territory.  The RSI (relative strength index) is printing near 36, which is on the low end of the neutral range.

See the original article >>

Follow Us