by Tom Aspray
The US stock market was not impressed with the details of the ECB stimulus plan and then sold off sharply Friday in reaction to the very strong jobs report.
For February, 295,000 new jobs were added, considerably more than the estimate of 230,000. Bond yields rose sharply on the news and interest rate sensitive stocks bore the brunt of the selling.
The impact of weaker crude oil prices and the strong dollar on earnings had many again questioning the strength of the US economy. After the jobs report, the focus has turned again to what language, if any, the Fed may change at their March 17 meeting. Investors should not let this change their strategy.
Many have likely panicked over similar concerns in the past only to have the market move higher after the weak longs have been shaken out of the market. This obsession with the Fed’s verbiage creates more uncertainty and should increase the bearish sentiment as I hoped last week (Calling All Bears).

Click to Enlarge
The recent ETF flow data from Markit shows that-so far in the first quarter-$16.8 billion has moved out of US equity funds. The big beneficiaries have been the Japanese and the EuroZone markets where a looser monetary policy is being pursued. One needs to remember that over $100 billion moved into US equity ETFs in the last quarter of 2014.
The German Dax has been very strong so far in 2015 as it is up almost 18%. As pointed out on January 23, the Dax (see chart) had completed its continuation pattern. This bullish action suggested that the US markets would also soon breakout to the upside as they did in February.
Many are therefore wondering whether they should be shifting into the overseas stocks markets or making other changes in their portfolio. Let’s look at the overseas stock markets first.

Click to Enlarge
Since the start of 2015, the Spyder Trust (SPY) is up just about 2%, but it is lagging well behind the iShares MSCI EMU Index (EZU) which is up over 5%. EZU has total assets of $7.93 billion with an expense ratio of 0.48%. There are 236 stocks in the ETF with just 24.6% in the top ten holdings and it has a yield of 2.94%.
The Vanguard FTSE Pacific (VPL) is doing even better as it is up over 7.5% so far in 2015. This ETF has an expense ratio of 0.12% with 812 stocks in the ETF. In addition to having 56.4% of its holdings in Japan, it has 19.3% in Australia, 11.3% in Korea, 8.9% in Hong Kong, and 3.7% in Singapore. It has a yield of 2.56%.
In last month’s European ETFs on Sale I recommended both EZU and SPDR STOXX Europe 50 (FEU) in light of their discounted price, based on the cyclically adjusted price/earnings ratio. As of the end of January, the discount was over 25% below the long-term average.
Neither of the European ETFs have had enough of a pullback to reach the previously suggested buying levels. It is my view that this week’s lower close is the start of a correction in these two overseas ETFs. Therefore, I would not chase them at current levels as I think there will be a better entry point in the next few weeks and the weekly charts explain why I have this opinion.

Click to Enlarge
The iShares MSCI EMU Index (EZU) looks ready to close the week lower and the 20-week EMA is now at $37.71. There is further support in the $37-$37.40 area with the quarterly pivot at $36.38.
The relative performance broke its downtrend at the end of January and is trying to hold above its rising WMA. The weekly OBV completed its bottom formation in January as resistance at line b, was overcome. Investors should go 50% long EZU at $37.59 and 50% long at $36.88, with a stop at $35.27.
The Vanguard FTSE Pacific (VPL) has been trading near its weekly starc+ band for the past few weeks as it is back to strong resistance from $61-$62. The monthly projected pivot support and the 20-week EMA are now at $58.94. There is additional support at $58.25 with the quarterly pivot at $57.51. A completion of the weekly trading range, lines c and d, has upside targets in the $70-$72 area.
The weekly relative performance is above its WMA, but is still well below the downtrend, line e. A strong new uptrend is needed to indicate it is outperforming the S&P 500. The OBV has surged sharply to the upside breaking through the resistance (line f) in early January. Investors should go 50% long VPL at $59.24 and 50% long at $58.36 with a stop at $56.83.

Click to Enlarge
There has been some improvement in the EuroZone economies and it has been my view since last summer that their economy would turnaround in 2015. The EuroZone PMI hit a seven month high and is very close to breaking its downtrend, line a. A move above the 55 level would be very positive and job creation has just hit a three year high. A drop below support at line b, would be a sign of weakness.
The euro dropped sharply last week at the 1.09 level and this will continue to drive the exports from the EuroZone. Denmark cut their deposit rate last month as it joins the long list of countries that are lowering their rates.

Click to Enlarge
Things are not nearly looking as good for the Russian economy as its PMI is in a well established downtrend after a brief bounce back above the 50 level last year. This is likely to put more pressure on Putin and may be enough to cut into his support at home or slow down his overseas aggression. Let’s hope so.
For the US, the manufacturing data is still mixed as last week the PMI Manufacturing Index was better than expected while the ISM manufacturing Index was a bit weaker. It has declined steadily from last October’s peak at 57.9.
This week’s economic calendar is light with Retail Sales, Import and Export Prices, as well as Business Inventories coming out on Thursday. The Producer Price Index will be released on Friday along with the mid-month reading on consumer sentiment from the University of Michigan.
What to Watch
The strong jobs report certainly shook the market on Friday and the sharply lower weekly close likely sets the stage for more selling this week. The light economic calendar will turn the focus on the bond market as well as the EuroZone.
In Thursday’s daily column I reviewed the daily technical studies and pointed out that an increase in bearish sentiment was needed before the market could move higher. The drop on Friday should create more fear as CNN’s Fear and Greed Index has dropped 16 points. On a short-term basis, Friday’s drop has created an oversold condition that should lead to a sharp rebound this week.
In last weeks trading lesson Avoiding Bear Markets, I took a look at past bear markets to point out what warning signs the market and the economy give you before the start of a bear market. There are no such signs at this time and they would take many months for the economic indicators to top out.
There are also no signs yet of a sharp 15-20% correction at this time as the warnings signs are also not in place now. The patterns that one typically sees in the A/D line would take three to five weeks or more before they could develop.
There are some divergences in the weekly volume analysis that is contrary to the positive signs from the weekly A/D lines. The new highs in the NYSE, Nasdaq 100, and S&P 500 A/D lines suggest that this is a correction.
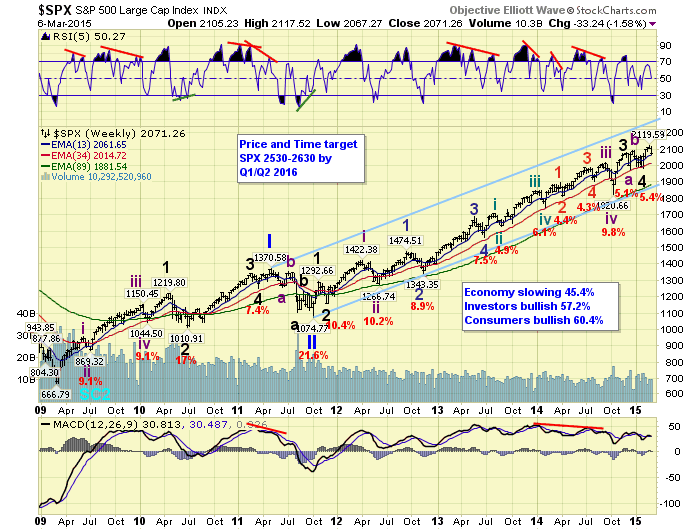
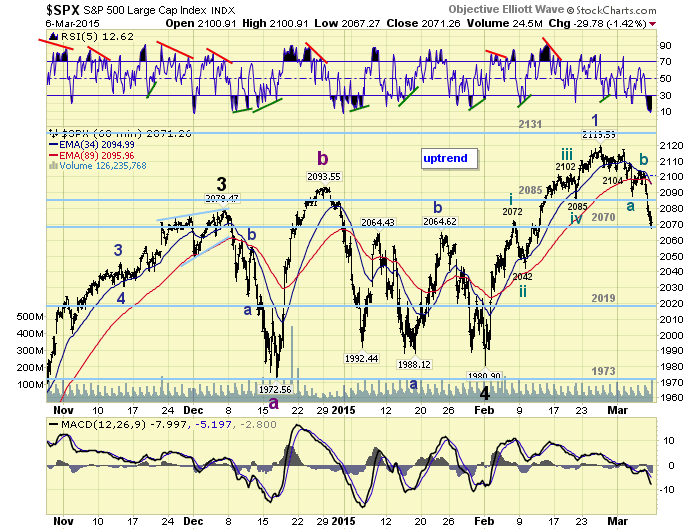
Now that the S&P 500 has decisively broken the support in the 2085-2090 area, the next likely support is in the 2060-2068 area. The market should bounce from this level this week. If the rally back to the 2080-90 area is weak, then a drop to the 2020 level becomes a possibility. This would be a correction of 5% from the highs.
Sentiment is mixed, as while the put/call ratios are positive, the small speculators are heavily long the S&P futures according to COT Expert John Person.
I still view this correction as a buying opportunity, as while the market is concerned about higher rates, the jobs data is sending a strong message that the economy continues to improve. Therefore, stocks continue to be the best bet, though yields did rise last week.
There are many stock charts that continue to look better than the market indices and the strong A/D numbers is a healthy sign for the market. Some stocks are already starting to buck the trend as Apple (AAPL), which was discussed last week, was up on Friday.

Click to Enlarge
One of the negative signs comes from the % of S&P 500 stocks above their 50-day MAs as it has turned down after failing to make it to overbought levels. The lower highs, line a, are also a reason for concern.
The weekly chart of the NYSE Composite shows the sharply lower close last week as the 20-week EMA at 10.823 is already being tested. The monthly projected pivot support is at 10,658 with the quarterly pivot at 10,597.
A weekly close below 10,400 at line a, would be negative with the weekly starc- band at 10,358.

Click to Enlarge
The weekly NYSE Advance/Decline made a new high just two weeks ago as it moved through the longer-term resistance at line b. The A/D will be lower once the final weekly numbers are in, but it still will be above the support at line c and the WMA. It is a positive sign that the WMA is still clearly rising.
The weekly OBV did not make a new high with prices and it will close the week back below its WMA. The support, at line e, is much more important as a weekly close below it would start a new downtrend.
S&P 500
The weekly chart of the Spyder Trust (SPY) reveals that a low close doji sell signal was triggered last week with the close below the doji low of $210.48. The close Friday was below the daily starc- band with the 20-week EMA at $206.05. There is additional support now at $204.50-$205 with the monthly projected pivot support at $201.60.

Click to Enlarge
The weekly S&P 500 A/D line made a new high the week of February 20 and its WMA is still rising. There is more important support going back over a year at line b. As I noted on Thursday, the daily A/D line (see chart) gave a short-term warning of Friday’s drop.
The weekly on-balance volume (OBV) dropped below its WMA on Friday and also failed to make a new high with prices two weeks ago. There is next strong support at the January lows and then at line c, which connects the lows from 2014.
There is first resistance now at $210.50 and the 20-day EMA.
Dow Industrials
The SPDR Dow Industrials (DIA) also closed well below the prior week’s lows with the 20-week EMA now at $176. The monthly projected pivot support is at $173.45 with the
The weekly relative performance is trying to again turn higher as it has just tested the uptrend, line d, that goes back to the middle of last year. The weekly OBV is still above its WMA but does show a pattern of lower highs. A drop below the late January low would confirm the negative divergence.
Nasdaq 100
The PowerShares QQQ Trust (QQQ) did hold up better on Friday than the other major averages. There is next minor support at $106 with the sharply rising 20-week EMA at $103.43. This also corresponds to the breakout level, line a.
The weekly Nasdaq 100 A/D made a new high last week and is still above the breakout level, line b. The A/D line has next support at its WMA with further at the long-term uptrend (line c).

Click to Enlarge
The weekly OBV is acting much weaker than the A/D line as it has been diverging from prices since late 2014, line d. It has now dropped back below its WMA but is still above the January lows.
There is short-term resistance now at $108.50-$109 with the daily starc+ band at $110.26.
Russell 2000
The iShares Russell 2000 (IWM) looks ready to close down 1.7% on Friday but is still barely above the three-week lows at $120.90. The rising 20-week EMA is just above $118 with the monthly pivot support at $116.85.
The weekly Russell 2000 A/D line is still above its WMA, but has turned down after forming lower highs. The A/D line now has important support at line f.
The weekly OBV shows a similar negative divergence, line g. A drop below the recent lows, line h, would confirm the negative divergence.
We are still long both SPY and IWM from our January recommendation . I adjusted the stops last week but will be watching any rally this week closely. If there are signs of a rally failure, I will likely take profits. If so, I will let you know via my Twitter feed.
