By tothetick
The 20th century could be categorized as THE century when communications took off and we started living in each other’s pockets. Lives had been ruined by war, trouble and strife. Wealth had been redistributed beyond belief. There were no longer just a few that were making the profits, but there were growing classes of people that wanted recognition.
They might not have got it until the second half of the 20th century, but the way things unraveled in the first half meant that people were not prepared to sit back and let things go into the hands of the rich landlords and the factory owners.
Rights had been acquired and they were being demanded. Women, workers, whoever they were, everybody wanted a piece of the cake. It wasn’t until the second half of the twentieth century that dabbling and buying shares, thinking you could strike it lucky and make a million, was going to become part and parcel of most people’s lives. Maybe that’s the whole problem. People betting on investments as if that was nothing more than a couple of whippets running round the race track on a Saturday afternoon, bag of chips in one hand and a pint of ale in the other. Flat cap and everything.
The markets don’t act like that. But, we allowed people to think that they could make a quick million bucks by investing what they had hidden under the mattresses for decades. Why did they need to worry anyhow, social security had been invented, we were looking after the destitute and not locking them behind the gates of Victorian workhouses and mental asylums. There was a safety net that had been created in society by the advent of the National Health Services (1948 in the UK) that we pride ourselves for inventing or the retirement schemes that we say will make pensioners’ lives better (Dankeschön, Mr. Bismarck).
As time went on in the 19th century the number of stock-market crashes increased.
That number increased even more in the 20th century. Information was accessible. Telecommunication technology was entering our lives as a daily piece of equipment. I could start to be absent and yet present at the same time. I didn’t have to be literally somewhere physically; I could be there almost in person via the transmission of my voice or an image. It was reserved for the elite at the start, but as the century progressed, it became more and more democratized. Later in the century, it would be possible to be completely present, and yet physically absent and I would be able to do it from the comfort of my own living room. Education was becoming more and more widespread. Newspapers were being read even by those that had not been able to read in the previous century (total circulation was at over 27 million in 1920 and households had papers delivered both in the morning and in the evening). Access to information meant the learning of events almost in real-time.

Stock Markets: Interconnected
The 20th century saw an explosion in the number of stock market crashes. Here are a few of them. The ones that bit us from behind as we scrambled out of the markets sometimes to be left without a cent. One thing about it all was that the dream of the self-made man, the entrepreneur, the idea of striking it rich had really come into its own in this century! This is just the first half of the 20th century!
1. Panic of 1901
We entered the 20th century with a panic. The turn of the century has always been equated with great change, either good or bad. The Panic of 1901 was due to some extent to the fight for the control of the Northern Pacific Railway.
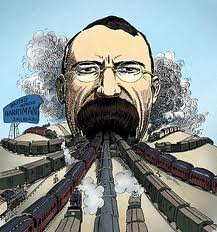
Stock Market: Edward Henry Harriman
- The Northern Pacific was a transcontinental railway (1864-1970).
- Edward Henry Harriman who was the Chairman of Union Pacific attempted at all costs to monopolize the railway sector.
- He attempted to buy stock en masse belonging to Northern Pacific Railway to take control of the company.
- The NYSE was said to look more like a football field as the panic started and prices began to fall as people started to sell in sheer panic.
- The market crashed and brought down with it the majority of US railway companies (Burlington and Missouri Pacific, for example).
- The only one that was left still standing was the Northern Pacific. The run on their shares by Harriman had meant that people were selling all other shares like they were going out of fashion and attempting to buy into Northern Pacific.
- One company’s loss became another companies gain and Northern Pacific increased by 16.5 points.
The crash spread to other companies. It brought the country into recession and was the first stock-market crash of the 20th century.
2. Panic of 1907
The Panic of 1907, is the Bankers’ Panic. The NYSE dropped by 50%. The reasons? Lack of confidence in the market and retraction of market liquidity by NY banks. The banks had lent out too much money in an attempt to purchase the United Copper Company and this caused loss of confidence and bank runs ensued.
- The US had no central bank that would act as a lender of last resort at the time. President Andrew Jackson had let the charter of the Second Bank of the United States lapse in 1836. Money supplies fluctuated only in line with agricultural cycles. Money left NY in the autumn to purchase harvests and the only thing that made that money come back was a raise in interest rates.
- J.P. Morgan shored up the banks and bailed them out; otherwise there might have been an even worse situation.
- There was an attempt to corner United Copper, by purchasing large quantities of the stock of the company in a bid to be able to manipulate the price of copper afterwards.
- Shares rose in the beginning from $39 to $52 per share. They reached $60 before they began to collapse.
- Within just a few days, they ended up at $10.
J.P. Morgan had managed to shore up the banks for a while as they were suffering from lack of liquidity, but he was unable to do so indefinitely. The bankers tried to call a press meeting to persuade the papers that they were controlling everything. Even the city of New York needed $20 million otherwise it would go bankrupt.
Morgan said “if people will keep their money in the banks, everything will be all right”.
The banks were not willing to make loans (short-term) to brokers to carry out daily trading, worried that the stock would fall even more. Prices fell as a consequence on October 24th 1907. The President of the NYSE requested that the stock exchange be closed early to halt more losses. Closing the NYSE would mean even greater loss of confidence. So, J. P. Morgan decided to call the banks to a meeting. He requested $25 million and it was raised in 10 minutes flat! Not bad, really! But, it didn’t stop the free-fall.
- 1907 caused the highest number of bankruptcies to that date in the US.
- Production was estimated to have fallen by 11%.
- Imports were down by 26%.
- Even immigration dropped. The US was no longer the land of plenty (fall from 1.2 million immigrants to just ¾ of a million in one year).
- Unemployment rose to over 8%, whereas it had been at under 3%.
3. Wall Street Crash 1929
Probably the most famous stock market crash of the entire history of the economy (apart from the one that we are living right now). The Wall Street Crash is also known as Black Tuesday. Since this date we have used Black days throughout our stock market crashes (Black Monday in 1987, or Black Wednesday in 1992, for example).
Just like in the period that preceded the stock-market crash of 2008, there was a time of wealth, success, making money, sandwiched in between World War I and just before World War II. The roaring twenties. Innovation, dynamism, liberation, freedom.
Motion pictures abounded, the automobile became commonplace, electricity entered the homes of the middle-classes. Culture and lifestyles changed drastically. Everything became possible. Modernity had arrived. It’s strange that the period that preceded the stock market crashes of the 21st century was also a time of great change. We had invented and democratized communications to a point where we could carry it around in our pockets. We had changed the way we accessed information and we had it at our finger tips like no other generation had had before via Internet.
Speculation became the order of the day in 1929. The world investors were on a roll and it wasn’t going to end. Money could be had and it was short-time financial gain that was important. Making money and making it fast. But, even though we might not always apply the same knowledge today, what goes up must come down.
- On March 25th 1929, it began with a mini-crash. This was only an omen of what was to come.
- The National City Bank tried to shore up the losses by injecting $25 million into the market, stopping is descent into hell. But, it was all temporary.
- The USA was showing signs of waning economically. The steel market was on the slippery slope and construction wasn’t anything more than just sluggish. The peak had been reached.
- There were already 20 million cars on the roads, for example in 1929 in the US. Automakers sold 4.5 million cars in the US market alone in that year before the crash.
- General Motors had a net profit of $248 million. But, the peak had been reached, 1929 saw a dramatic drop. It was only selling 1/3 of the cars it had been selling prior to the crash on the domestic market. It took ten years to come back to the same level of profit and the number of car sales as in the period before the crash of 1929.
- Although, it has to be said, even then, it was the shareholders that counted. The shareholders got dividends every single year from GM between 1929 and 1939.
The roaring twenties had roared on from 1920 until 1929. The Dow Jones Industrial Average had been multiplied by ten. Some even said that it was a “permanently high plateau” in September 1929. Very few are able to predict what the market will do, but nobody today, at least, would suggest for a second that we are going to be on a permanent high. That lesson has been heard loud and clear. The Dow jones reached its peak at 38.17 on September 3rd 1929.
The London Stock Exchanged collapsed when a British investor (Clarence Hatry) became the most hated man in the UK when he was jailed for fraud. Hatry was a London insurance clerk that had amassed immense wealth by profiteering during WWI. He was about to merge his companies into a $40-million affair called the United Steel Companies. But, the Stock Exchange Committee discovered that he had been borrowing ($1 million) without anything to back it up.
- It was on October 24th 1929 that Black Thursday occurred. The NYSE plummeted 11%. Bankers managed to stop the landslide and purchase large quantities of stock well above the market price in blue-chip companies. It halted the free-fall. But, temporarily. The NYSE closed at -6.38 points.
- The newspapers managed to report the news and Monday 28th became known as Black Monday.
- Black Monday saw the DJIA spiral out of control. The US market lost 12.8% as trading opened up on the NYSE. It plummeted 38.33 points and closed at 260.64.
- Black Tuesday, October 29th had 16 million shares being traded. The DJIA fell 30.57 points, to just 23.07. It lost 11.7%. In three days of trading the DJIA had lost over 30%.
What went horribly wrong? Speculation and certainly the belief that things would never end. Brokers were lending 2/3 of the face value of stocks that they were purchasing and that meant that in 1929 there was more money that was on loan than the entire currency in circulation in the USA ($8.5 billion). That smacks of something familiar when we think about the sub-prime crisis. The belief that housing prices could never fall and that we would always be on an upper, lending money left, right and center.
One other thing that we learned is that our worlds were interconnected. Falls in London, Tokyo and New York happened at the speed of light in 1929. What one did the other followed suit with. Only 16% of the US population had money invested in the stock market in 1929, but it was probably those that had the companies that employed the people that worked. The knock-on effect was enormous.
But people like Joseph Schumpeter and Nikolai Kondratieff believed through their economic-cycle theories looking at the way the market reacted that the 1929 crash was just acceleration in the cycle and it enabled moving towards the next one.

Stock Market: Nikolai Kondratieff
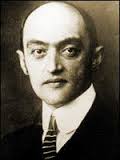
Stock Market: Joseph Schumpeter
4. Recession 1937
Spring 1937 saw the US economy get back on its feet and the levels of economic activity were similar to pre-1929 ones. Unemployment was still relatively high, but that was nothing compared to the vertiginous heights of 1933 (25%!). In 1937 things went haywire for just over a year causing an economic recession in the US, with a knock-on effect in the rest of the world.
- Unemployment was at 14.3% in 1937. It increased to 19%.
- Manufacturing output fell by 37%.
- Spending decreased and incomes fell by 15%.
- GDP fell by 11%.
Economists fail to agree on the reasons (nothing surprising) as to the economic recession of 1937. Depends where you stand. If you are a Keynesian, you will believe that federal spending cuts brought about the recession, coupled with increased taxation. If you are a Milton-Friedman man then it’s the money supply and the Federal Reserve’s tightening of it that is the instigator.
The 1937 recession was called the ‘Recession within the Depression’.
Conclusions
Some might say that the benefits of what we have gained over the past century are far better than the relatively few times that we had to wade through the nightmares on Wall Street and the Stock Market crashes that hit us full in the face at times.
Some might say that it was worth it as the market generated the wealth on which we prospered in the 20th century. But, they also resulted in depression, recessions and slumps. Recessions that brought about the rise to power of some of the worst dictators that the world had seen.
Recessions that brought about a fight for greed and a closing in upon ourselves in protectionist fear. But, the 1st half the of the century was nothing compared to the stock market crashes that were waiting in store for us once we would become really industrially connected and inter-connected. When we went global, when we reduced our barriers, when we travelled from point A to point B at supersonic speed, and when one push of a fat finger on a keyboard sent millions across the other side of the planet.
Stock markets were going to run in the second half of the 20th century at supersonic, virtual speed. We would enter the Big-Bang world of deregulation of the financial markets, abolishing fixed commission charges. But, behind the big bang was a black hole…
What reasons do you think could explain the stock-market crashes of the 20th century?
Take a look at the Stock Market Crashes Through the Ages – Part I – 17th and 18th Centuries.
Take a look at the Stock Market Crashes Through the Ages – Part II – 19th Century.
In the next installment, we’ll take a look at the historical stock-market crashes in the 2nd half of the 20th century.
See the original article >>

 Wolf Richter


