

Projecting from the rate of territorial decline over the last two centuries, experts predicted Thursday that the British Empire will be reduced to an area of eight acres surrounding Buckingham Palace by as early as 2050.See the original article
“Considering the loss of its colonial possessions around the world over the years, as well as Scotland’s current independence campaign, we project that the once vast and mighty British Empire will soon reach only a few hundred feet beyond the property lines of the royal palace,” said Oxford University political science professor Patrick Withers, adding that within 35 years, the sum total of British-held territory will likely extend from Upper Belgrave St. a few blocks west of Buckingham Palace to just a small fraction of St. James’s Park to the east.
“According to even the most generous estimates, the England of 2050 will no longer include the British Museum, most of the River Thames, or the Houses of Parliament, which will present extraordinary difficulties in governance and sustaining British identity at all.”
Withers went on to say that within 100 years, the British Empire may be reduced to the Queen’s throne room and part of the hallway outside.
By Ian Talley
Looking at Italy’s ballooning debt, Germany’s reluctance to allow the European Central Bank free rein on the cash lever makes some sense.
The International Monetary Fund on Thursday cut its outlook for the Belpaese again, forecasting a 0.1% contraction instead of 0.3% growth this year. That means a third consecutive year of economic shrinkage.
Absent Teutonic market pressures that ECB action relieves, Rome may keep on its current path. (The failure of the government to move ahead with needed policy adjustments has led to a short term for Carlo Cottarelli, the IMF’s former Fiscal Affairs chief, as Italy’s budget watchdog. He’s announced an October departure.)
Perhaps like others in Europe, the IMF has consistently been optimistic about Rome’s ability to make the tough economic changes necessary to spur growth and cut debt levels. As a result, the fund’s also been consistently wrong. Its median forecast error for the past eight years is 1.6 percentage points above actual gross domestic product growth.

“While growth outcomes in Italy have sometimes tended to be worse than projected, the current growth projections are in line with consensus but below the authorities’ forecasts,” the IMF said in its latest annual economic review of the country.
At least for now. But the fund is honest about the risks. Deep structural changes—such as simplifying labor contracts and a more efficient judicial system—are urgently needed to secure a recovery and spur growth, the fund warns.
“The risks are tilted to the downside,” it adds. “Italy’s high public debt, large public financing needs and elevated [nonperforming loans] leave the economy vulnerable to financial contagion and/or low growth and inflation.”
Three years of Europe’s third-largest economy shrinking has pushed debt levels dangerously ever higher. It’s not a negligible risk for the rest of the continent, or for the global economy.
The IMF has had to repeatedly push its forecasts of peak debt higher and farther into the calendar, a mountain of obligations that risk overwhelming the country’s ability to pay in the years ahead, especially if the government can’t generate the political momentum for a raft of economic policy reforms.

Without structural changes to the economy, the fund projects Italy’s debt will continue to rise:

And so will the country’s need to raise more cash:

Italy has been somewhat insulated. First, by Europe’s bailout facilities and the ECB’s vows to “do whatever it takes.” Secondly, Italy’s debt has a long-term structure, meaning there aren’t immediate financing needs.
But, the IMF warns, the country remains vulnerable to a loss in market confidence given the size of its refinaning needs, which would push up borrowing costs. As the past several years have shown, it’s also exposed to growth shocks such as those that could come from the Ukraine/Russia crisis.
“In addition to being a drag on economic growth for the region and beyond, further unrest could also trigger large spillovers on activity in other parts of the world through a renewed bout of increased risk aversion in global financial markets, higher public spending or revenue losses, or disruptions to commodity markets, trade, and finance,” the IMF told global finance leaders Wednesday.
In stress tests, the IMF estimated that Rome’s debt trajectory could hit nearly 150%—up 15 percentage points from current levels—if Italy’s economy were to contract by an average of 1.3% over the next couple of years or if a banking crisis forced the government to bail out the financial industry.
Given that such a scenario would likely send shockwaves around the world, Italy’s sluggish efforts to restructure its economy are likely to be a topic at the Group of 20 meeting this weekend in Australia.
A senior U.S. Treasury official recently told reporters Europe’s lackluster growth would be a top priority at the meeting. “We’ve emphasized the need to boost domestic demand in Europe, and we’ve underscored that it will require implementation of more accommodative measures across the full range of macroeconomic policies,” the official said.
by Jesse
What is even more clever than lining your pockets by ballooning the financial system into a great bubble by fraud and bad governance?
Getting the victims and bystanders to pay the price of your perfidy, and shifting the anger of the people to some unfortunates, while 'reforming' the system to make it even more efficient at looting so that you can do it all over again.
No wonder that any movement that threatens the status quo in the least bit gets these white collared reivers and their pampered princes in such a lather. It is important to make people think that no one else cares, and that they are alone.
Such a parcel of rogues in a nation.

"The sudden explosion of European sovereign debt is the direct and indisputable result of all our political parties deciding they would safeguard their mates’ and their own personal wealth (it is the top 10% who hold the bulk of their wealth in the financial products which would be destroyed in a bank collapse. NOT the rest of us!) by bailing out the private banks and piling their unpaid debts on to the public purse.
So whatever the trigger of the next crisis may be, they know any solution which saves the wealth and power of the over-class will have to involve piling new, private-bank bad-debts on to already indebted sovereigns and that, our leaders must be keenly aware, will not be easy to force on an already angry public. They know a whole range of the assurances they might like to give us about what must be done when the next crisis hits and how those things will undoubtably save us, will not be so easy to shove down people’s throats...
I think one of the cleverest things the 1% have done over the last few years is the way they have created a relentless public discourse, via their paid political front-men and women and their media empires, to insist on the need to ‘fix’ and protect the system, and the extreme danger to us all should the system not be ‘saved’. This has served as a perfect cover for making sure that not enough people have noticed that the system is, in fact, being gutted and replaced by something that better serves the interests of the 1%. We have not been fixing the banks, we have been feeding them."
by Tom Aspray
The markets appear to have survived the long awaited FOMC meeting as the financial media has been obsessed over what the Fed may or may not say. Much of the selling in the past week seems to have been related to speculation that the wording of their announcement would change.
Some may end up regretting their selling as I speculated Monday that it was maybe “a sell the rumor and buy the news situation.” Having a plan and sticking to it will help you avoid emotional selling. Though the major averages did close higher, they gave up much of their post meeting gains. The S&P 500 was showing double digit gains but closed up just 2.60 points.
The market internals were pretty much flat as the McClellan oscillator rose only slightly to -108. A strong close above the +40 level would be bullish. In early trading, the S&P futures are showing nice gains as are the EuroZone markets. With Wednesday’s close, the technical evidence had not confirmed that the correction was over but in my estimation the odds are about 60/40 that it is over.
A strong close either Thursday or Friday will shift the balance of evidence in favor of a new uptrend. Let’s look at the technical evidence and also how the market leading PowerShares QQQ Trust (QQQ) has reacted to the other FOMC meetings in 2014.

Click to Enlarge
Chart Analysis: The Spyder Trust (SPY) shows Wednesday’s wide range and the formation of a doji.
The SPDR Dow Industrials (DIA) made a new high yesterday as the resistance at line e, was overcome.

Click to Enlarge
The Powershares QQQ Trust (QQQ) is up 14.9% YTD as it made new highs for the week on Wednesday.
What it Means: It will be important for the next two days to keep an eye on the market internals as one day with 3-1 positive A/D numbers will be a strong sign that the correction is over.
Conversely, if the market rallies on just slightly positive A/D numbers, it will suggest that the trading range is not over yet.
How to Profit: Should be long the PowerShares QQQ Trust (QQQ) $86.88 and would add a 25% long position in at $97.52 or better, stop at $92.89.
by Lance Roberts
One of Fiedler's Forecasting Rules states:
"Always be precise in your forecasts: Economists state their GDP growth projections to the nearest tenth of a percentage point to prove they have a sense of humor."
The Federal Reserve has certainly proved both points; they have been very precise in their forecasts and have consistently overstated economic strength as shown. For example, in January of 2011, the Fed was predicting GDP growth for 2013 at 4.0%. Actual real GDP (inflation adjusted) was just 2.19% for the year only missing estimates by roughly 50%. The estimates, in 2011, for long run economic growth, was 2.7%, which has now fallen to just 2.2%.
Unfortunately, 2014 is not shaping up very well either. At the beginning of 2013, the estimates for the full year of 2014 averaged 3.2%. With the first quarter of 2014 declining 2.1%, even the sharp rebound in Q2 has left the economy average only roughly 2% growth so far. Of course, since that time, the Fed has continually lowered its estimates for 2014 from that 3.2% growth rate to just 2.05% today. That doesn't suggest a massively strong rebound through the last two-quarters of the year.

Importantly, the Fed added a projection for 2017 which is just 2.3% annualized real economic growth. As shown in the chart inset, economic growth projections by the Federal Reserve are showing a continued slide in economic prosperity in the years ahead.
This view very much aligns with statements I have repeatedly made over the last three years which is that in a consumption based economy excess debt, structural unemployment and stagnant incomes retard economic prosperity. The simple fact is that when it requires roughly $4 of debt to create $1 of "real" economic growth - the engine of growth is broken.

Economic data continues to show signs of sluggishness, despite intermittent pops of activity, and the global economy remains drag on domestic exports. With higher taxes, increased healthcare costs and regulation, the fiscal drag on the economy could be even larger than expected.
What is very important is the long run outlook of 2.2% economic growth. That rate of growth is not strong enough to achieve the "escape velocity" required to improve the level of incomes and employment to levels that were enjoyed in previous decades. Also, it is important to realize that NOWHERE in these forecasts is the onset of a recession considered. Has there been a recovery in the economy? Of course, but much of it has only been statistical.
There are two very important misconceptions by the media about investing. The first, is that if an advisor/manager has a conservative or negative view on the market then that means they are sitting in cash and have missed the rally. That is simply not the case. As I addressed in "Bulls And Bears Are Both Broken Clocks:"
"In the end, it does not matter IF you are 'bullish' or 'bearish.' The reality is that both 'bulls' and 'bears' are owned by the 'broken clock' syndrome during the full-market cycle. However, what is grossly important in achieving long-term investment success is not necessarily being 'right' during the first half of the cycle, but by not being 'wrong' during the second half."
The chart below shows the complete full market cycles throughout history.

The important point that Bill is trying to make is that even if he has missed some of the gains in the market, the devastation to investors during the completion of the full market cycle will completely eviscerate any potential short-term performance lag. However, this is why media driven advice has always led investors into taking on excessive risk that eventually devastates long-term investment returns.
The second misconception, and much more important to this discussion, is that having a "sell discipline" means that you are a "market timer." This also is a fallacy.
"Market Timing" is when an individual attempts to time market movements and is either "all in" or "all out" of the market. The reality is that while some investors may be successful in such an endeavor over a short term period, it is unlikely that they will be successful over the long term. Furthermore, most individual investors have neither the time, discipline, tools or skillset necessary to attempt such an operation.
Moreover, as investors we are SUPPOSED to "buy low and sell high." Without a "sell discipline" how would one accomplish such a task? More importantly, without selling high, how is one supposed to have capital with which to buy low? This does not mean "selling everything" which is what is often believed, but rather trimming back on winners, and disposing of investments that are not working. I like to call this "portfolio management" and am contemplating patenting what is apparently a novel concept. The problem with the majority of investment advice given today is that investors should only "buy and hold." This advice is fine as long as markets are rising, however, as discussed above; it is the completion of the full market cycle that leaves individuals wanting.
"As you are already aware, I agree with the premise that as long as the markets are in a positive trend, portfolios should remain near full allocations. However, being fully allocated currently does not mean that it should always be the case. This is why I spend so much time pointing out the potential risks that exist. It is never a rising market that hurts us; it is when it stops that does."
One of the ongoing benefits of "cheap money" is that it allows corporations to leverage balance sheets and "manage" profitability through stock buybacks. As discussed just recently, corporate share buybacks are at their highest level since just prior to the last financial crisis.
“Companies are buying their own shares at the briskest clip since the financial crisis, helping fuel a stock rally amid a broad trading slowdown. Corporations bought back $338.3 billion of stock in the first half of the year, the most for any six-month period since 2007, according to research firm Birinyi Associates. Through August, 740 firms have authorized repurchase programs, the most since 2008."

However, companies are not just borrowing to complete share buybacks but also to issue out dividends. According to the most recent S&P 500 company filings, the level of cash dividends per share has now reached $9.76 which is the highest level on record. It is also the greatest deviation from the long-term trend of dividends per share since the financial crisis (highlighted in blue.)

One thing to note is that cash dividends per share, which are inflated due to the reduction in shares outstanding, should be driven by stronger revenue growth at the topline of the income statement. However, since 2009, sales per share have only increased by 32.37% in total (or 6.5% annually) which does not support dividend per share growth of 63.75% (or 12.7% annually.)
While I am not predicting that the proverbial "wheels are about the come off the cart," this is another in a long list of indications that value in the stock market is no longer present. Of course, this would also suggest this might be, just maybe, a time to start considering "selling high." Of course, such a suggestion is wildly ludicrous and absolutely illogical since it is widely believed that the markets will never go down...ever.
by Yao Yang
BEIJING – China’s economy is, at long last, undergoing a rebalancing, with growth rates having declined from more than 10% before 2008 to roughly 7.5% today. Is this China’s “new normal,” or should the country anticipate even slower growth in the coming decade?
China’s rebalancing is apparent, first and foremost, in the export sector. Export growth has slowed from its 2001-2008 average of 29% annually to below 10%, making foreign demand a far less critical engine of growth.
Moreover, manufacturing employment and output, as a share of the total, began to decline last year. In fact, in the first half of this year, services accounted for more than half of total economic growth. It is no surprise, then, that China’s current-account surplus has shrunk rapidly, from its 2007 peak of more than 10% of GDP to about 2% of GDP today.
This rebalancing has helped to improve China’s income distribution. Indeed, in recent years, labor’s share of national income has been on the rise – a direct reflection of the decline in manufacturing and expansion in services.
That has meant greater regional balance as well: The coastal provinces, which produce more than 85% of the country’s exports, are experiencing the most pronounced slowdown, while inland provinces have maintained relatively high growth rates. As a result, China’s Gini coefficient (a 100-point index of inequality, in which zero signifies absolute equality and one absolute inequality) fell to 0.50 in 2012, from 0.52 in 2010.
Two principal factors are driving this shift. The first is the decline in global demand in the wake of the 2008 financial crisis, which has forced China to adjust its growth model sooner than anticipated. The second is China’s ongoing demographic transformation. The share of working-age people (16-65 years old) in the total population has been declining since its 2010 peak of 72%. And the absolute number of working-age people has been falling since 2012.
At the same time, China is undergoing rapid urbanization, with some 200 million people having left the agricultural sector in 2001-2008 to seek urban manufacturing jobs. More recently, however, the pace of migration has slowed substantially, with rural areas retaining 35% of China’s total labor force.
All of this implies lower growth rates for China – though perhaps not as low as the 6-7% rates that economists like Liu Shijing and Cai Fang are predicting for the next decade. In fact, relying on China’s past growth record to predict future performance is inherently problematic, owing not only to important shifts in the labor force, but also to the fact that the speed and scale of China’s pre-2008 growth was unprecedented.
For starters, it is likely that the contribution to output growth of the rising ratio of working-age people prior to 2010 was overestimated. That makes the subsequent decline in the ratio an inaccurate measure with which to determine the negative impact on economic performance.
Moreover, this approach neglects the educational dividends that China will enjoy over the next 20 years, as the younger generation replaces older workers. As it stands, the rate of return-adjusted educational attainment for Chinese aged 50-60 is half that of those aged 20-25. In other words, young workers will be twice as productive as those entering retirement.
Indeed, the level of educational attainment in China continues to improve. By 2020, the share of those aged 18-22 who are pursuing a college education will reach 40%, compared to 32% today. This improvement in human capital is bound to offset, to some extent, the net loss of labor.
Furthermore, China’s low retirement age – 50 for women and 60 for men – provides policymakers with considerable room to maneuver. Increasing the retirement age by just a half-year for each of the next ten years would more than compensate for the annual decline in the labor force, which is projected to be 2.5 million workers during this period.
Other trends are boosting China’s prospects further. Though investment is likely to decline as a share of GDP, it will probably take a decade for it to dip below 40% – still robust by international standards. Meanwhile, the capital stock can maintain a reasonable growth rate.
Finally, China’s capacity for innovation is improving steadily, owing to rapidly increasing human capital and rising investment in research and development. By next year, Chinese R&D expenditure, at 2.2% of GDP, will be closing in on advanced-country levels.
Based on these trends – and assuming a constant labor-participation rate – China’s potential growth rate over the next decade is likely to hover around 6.9-7.6%, averaging 7.27%. This may be much lower than the 9.4% average growth rate in 1988-2013, but it is more than adequate by global standards. If this is China’s “new normal,” it would still be the envy of the rest of the world.
by Wolf Richter
Wall Street’s and the media’s attention was riveted single-mindedly on whether or not the Fed would include in its statement the two words, “considerable time,” the two vaguest, stretchable latex words available that describe absolutely nothing and leave the door wide open for wishful thinkers of every stripe. That’s what the Fed’s gyrations since the financial crisis have so successfully accomplished; they have reduced the market, a place of price discovery, to a crummy joke.
The Fed delivered those two words, but during the press conference, Fed Chair Janet Yellen doused them with so many qualifiers that they’ve become even more meaningless, if that were even possible.
Wishful thinkers still see Yellen as a pure dove, while others worry that she has turned into a closet hawk who is afraid of letting this tsunami of free liquidity inflate asset bubbles and build up risks so immense that even a minor hiccup would bring down the entire financial system once again. And this time, under her watch.
Clearly, FOMC members, and particularly Yellen, would try hard to dodge blame. But after having printed $3 trillion, and after having forced short-term rates to near zero – and below the rate of inflation – for what likely will be more than six years, and after having messed with the markets throughout, they too can imagine that blame for the fiascos these policies might end up causing will be hard to dodge.
But beyond its crummy joke, the Fed has done something else: it has removed “Escape Velocity” – the economic surge in the US that has been falsely promised for five years in a row to rationalize soaring stock prices – from its vision of the future.
The Economic Projections of Federal Reserve Board members and Federal Reserve Bank Presidents, as the report is called, cut GDP projections for all years to come, as far as the Fed’s eye can see:
For 2014, policymakers cut their “central tendency” of GDP growth to 2.0% to 2.2%. That’s down from their June projection of 2.1% to 2.3%. The “range” of GDP growth dropped unceremoniously to 1.8% to 2.3%.
While they were at it, they cut the GDP growth projections for 2015 to a central tendency of 2.6% to 3.0%. For 2016, they nudged it down to 2.6% to 2.9%. For 2017, they figured it would languish at 2.3% to 2.5%. And in the “longer run,” GDP growth would even be below that. Here is what the slow-growth economic future of the US, as seen by Fed policymakers, looks like, after $3 trillion in QE and so many years of ZIRP that investors can’t even imagine what life might be like once the cost of capital is actually a decision-making factor again:
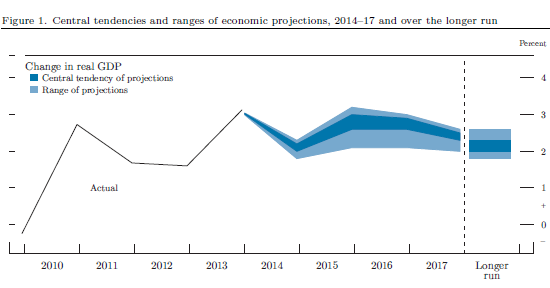
The light blue areas represent the “range” of the projections of policymakers. The darker blue areas represent the “central tendency,” which excludes the three highest and the three lowest projections in each year.
Next year, the economy might touch 3%. It would be the fastest growth for years to come. It would be peak growth. And Escape Velocity, that big economic acceleration that has been promised for years? Gone from the future.
That doesn’t mean that Wall Street stock-hype mongers might not trot it out again as a prediction of what will happen next spring, as they have done every, but the Fed isn’t seeing it.
Alas, as in the past, the Fed’s GDP projections for years out will be cut further as reality approaches. And the possibility of a recession or worse does not – and will never – figure into the Fed’s projections. Policymakers know only how to figure positive growth, at least in public, though they’re gradually learning how to project the pathetically slow growth that has resulted from their very own policies.
by Chris Kimble
On a more serious note regarding the Inflation/Deflation theme, many feel the Fed's policies will lead to strong inflation. From a stock market persective, inflation is taking place, as the Dow and S&P 500 are at/near all-time highs.
Another asset class can't say the same thing...see chart below

CLICK ON CHART TO ENLARGE
The Thompson Reuters Commodity Index a few months ago broke below a 13-year support line (left chart), then rallied to kiss old support as resistance and has fallen hard since.
On a shorter term basis (right chart) the index could be breaking support of this bearish descending triangle pattern.
I suspect that the Fed would rather fight excess inflation over deflation. In reality, none of has much control over inflation/deflation, other than we can make adjustments to our portfolios.
A further breakdown of support in the right chart would suggest that lower prices in commodities will be the trend. Understanding this trend could be important as Gold & Silver could be breaking 13-year support and Crude Oil is testing a 5-year support line.
by The Economist

FOR New York Stock Exchange (NYSE), the listing of Alibaba, a giant Chinese e-commerce website, seems like a triumph. As The Economist went to press, the firm was pricing the offering; its shares were due to begin trading on September 19th. Amid all the excitement about whether the IPO would prove the world’s biggest, another of its striking features has been largely forgotten: shareholders will have little control over how the firm is run.
Alibaba only listed in New York because Hong Kong Stock Exchange, a more natural home, insists that shareholders have a say over management in keeping with their stake. The firm’s owners, who balked at this notion, took their business to a more pliable venue. Technically, every Alibaba share has equal rights, but they are circumscribed ones. A pre-defined cabal of 30 managers of Alibaba or related companies, including the firm’s chairman, Jack Ma (pictured above), will control nominations to a majority of seats on the board. According to Alibaba’s prospectus, this group “may make decisions with which you [the shareholder] disagree, including decisions on important topics such as compensation, management succession, acquisition strategy, and our business and financial strategy”.
Alibaba says this structure is needed to preserve the firm’s culture. It is not that different from many tech firms, both Chinese and American, that have two or more categories of shares, some of which confer more say in the running of the company than others. Advocates of such skewed set-ups argue that they allow the founders of fast-growing firms to raise the necessary capital to pursue their long-term ambitions without having to deal with short-term mood swings among investors. By the same token, media companies with similar rules claim that allowing a small group of shareholders to maintain control preserves editorial integrity.
“Dual-class” structures were common in America in the 1920s but were largely stamped out in a populist campaign led by William Ripley, a Harvard professor who labelled the practice a “crowning infamy” to “disenfranchise public investors”, according to a paper by Stephen Bainbridge of the University of California Los Angeles. There were exceptions—notably the listing of Ford in 1956 on NYSE and of media firms on the American Stock Exchange, a second-tier market—but Ripley’s philosophy was largely intact until the 1980s when the rise of corporate raiders brought less democratic regimes back into fashion.
The Securities and Exchange Commission, the main market regulator, responded with a ban in 1988 but a court ruled that the agency had exceeded its authority. In a comprise, the SEC gave companies substantial discretion to choose their structure at the time of an offering, but not thereafter, on the grounds that this would allow investors to understand what they were buying and invest accordingly. Tech firms, led by Google, embraced the idea; few now list without some arrangement that guarantees the founders’ continued sway.
As a consequence, America accounts for the lion’s share of public companies that give disproportionate rights to certain shareholders, with 55% of the 524 such companies in the global database of MSCI, a financial-data firm. Canada is a distant second with 40, although many firms in Europe resort to other measures that distort ownership rights. Britain used to have many such listed firms, but largely abandoned the practice under pressure from big investors. The Financial Conduct Authority, Britain’s market regulator, recently issued a formal ban on skewed voting structures for firms listed on the London Stock Exchange’s main market.
Shareholder autocracy
Several jurisdictions seem to be moving in the other direction. The European Union considered imposing a one-share, one-vote rule on all members in 2007, but abandoned the idea as the financial crisis set in. Earlier this year France adopted the “Loi Florange”, designed to block unwanted foreign takeovers. It doubles the voting rights of shares held by the same owner for more than two years at all listed French firms unless by-laws are amended to say otherwise. Almost two-thirds of the CAC-40, France’s largest quoted companies, already offered multiple voting rights to loyal shareholders, says Jean-Nicolas Caprasse of Insitutional Shareholder Services, an advisory firm. France also allows a form of listed limited partnership in which it is very hard to dislodge the boss, points out Hubert Segain of Herbert Smith Freehills, a law firm. Hermes, a fashion house, is one and Lagardere, a media group, another.
Last month Hong Kong’s bourse published a “concept paper” on corporate structures that would give control to select shareholders. The public has three months to comment. While the exchange itself has said it is undecided either way, Charles Li, its head, has given every indication that he would like to see the rules relaxed. “Losing one or two listing candidates is not a big deal for Hong Kong, but losing a generation of companies from China’s new economy is,” he wrote last year.
Singapore also bans dual-class shares but, partly as a result, has struggled to attract tech start-ups. It also lost out in 2012 on the listing of Manchester United, a football team, due to the desire of the controlling family to cash in without forfeiting control. The finance ministry has proposed changing the rules to allow dual-class listings; investors and lawyers believe it is only a matter of time.
Despite the temptations of blockbuster tech listings, investors dislike the idea of diminished control. The Asian Corporate Governance Association surveyed its members, including big international asset managers, pension funds and universities, about the possible introduction of dual-class structures in Hong Kong. On average, they said it would lower their valuations of firms listed there by 13%. “It would be a disaster,” says Mark Mobius of Franklin Templeton Investments, a fund manager.
There are good grounds for such misgivings. In addition to the risks that potentially lucrative takeovers may be prevented and poorly performing managers might prove impossible to dislodge, there is also the danger that those controlling a firm will make decisions that benefit them, at the expense of other shareholders. A study published in 2012 by the Investor Responsibility Research Centre Institute, a think-tank, concluded that American companies that diverge from the principle of one-share-one-vote suffer from lower returns, higher share-price volatility and various other ills including weak accounting controls and damaging transactions with related parties. Much other research corroborates these findings.
It does not help that Alibaba does not own the websites that generate its revenues (it could not list in New York if it did, since Chinese law bars foreigners from owning local websites). Instead, the listed firm owns the rights to those revenues, under a type of contract that it believes to be valid but, its prospectus admits, is the subject of “substantial uncertainties” under Chinese law.
If there is one lesson to be learned from the mix of bargains and dross on Alibaba’s e-commerce sites, it is “buyer beware”. Its shares and those of similarly structured companies may reinforce that idea.
by Sprout Money

The European Central Bank (ECB) has made a first tranche of 82.6B EUR available in Long-Term Refinancing Operations (LTRO), which is much less than expected. Most analysts seem to think that any number lower than 100 billion euro will not be sufficient to convince the market that the ECB is doing everything it can to resuscitate the economy. An analyst from the French bank Société Générale said it looks like the ECB is doing ‘too little, too late’. The central bank planned to pump 400 billion Euro into the economy through this liquidity injection scheme, but the banks aren’t too keen on participating. This is very likely caused by the fact they don’t want to look too weak, just weeks before the stress test results will be announced
However, it is remarkable to see that the 82.6B EUR was paid to not less than 255 banks, but almost 30% of the total amount was distributed to just eleven Italian banks. UniCredit seems to have been the biggest fish with a request for 7.75B EUR in LTRO-money, followed by Intesa SanPaolo with 4B EUR and Banca Monte Paschi with 3B EUR. Unlike other banks which were afraid to be singled out, the Italian banks don’t seem to have any issues with this perception, and the percentage of the LTRO’s flowing to Italy is very high, which could indicate the Italian banks are expecting some tough times and want to cash up before things get worse. Even smaller banks like Banca Popolare di Sondrio and Credito Valltellinese borrowed substantial amounts of money, with the latter receiving 1B EUR from the ECB. This is a lot of money, given the fact the bank’s market capitalization is just 1B EUR as well. We are looking forward to see the results of the stress test which should be announced in October of this year.
by Asit K. Biswas, Ahmet C. Bozer
SINGAPORE/ATLANTA – In the early nineteenth century, Lord Byron wrote in Don Juan that “Till taught by pain, men really know not what good water’s worth.” Nearly 200 years later, humanity still does not seem to understand water’s value, exemplified in decades of poor water management and governance practically everywhere. But the impending water crisis is becoming increasingly difficult to ignore – especially for those who are already feeling its effects.
To be sure, some improvements in water management have been made in recent years. But they have come incrementally, at far too slow a pace to address the problem effectively.
To help kick-start progress, major multinational companies like Nestlé, Coca-Cola, SABMiller, and Unilever – which have long emphasized to their investors the challenge that water scarcity poses for their businesses, not to mention the communities in which they operate – are working to improve water availability, quality, and sustainability. Their success will require an innovative strategy that upends entrenched assumptions about – and approaches to – water-related problems.
For example, the prevailing view that the world needs good water management, though accurate, is too narrow. Water management should not be regarded as an end in itself – a single-variant solution for a single-variant problem – but as a means to several ends, including environmental conservation and social and economic development.
Viewed in this broader context, many of the paradigms, practices, and processes that are currently being used to manage communities’ water resources must change. Given that competition for water resources cannot be disentangled from competition for, say, food and energy, it cannot be addressed independently. Multivariant problems demand multivariant solutions.
Complicating matters further, these problems’ backdrop is likely to change considerably over the next few decades, owing to demographic shifts, population growth, urbanization, migration within and among countries, globalization, trade liberalization, and rapid expansion of middle classes in the developing world. These shifts will accompany rapid industrialization and advances in science and technology (especially information and communications technology), and will transform dietary habits and consumption patterns.
As a result, water-consumption patterns will change considerably, including indirectly, through shifts in agriculture, energy, and land use. Indeed, these linkages are already evident in many parts of the world. For example, in many Asian countries – including India, China, and Pakistan – groundwater levels are declining at an alarming rate, owing to over-extraction and energy subsidies.
For India, the problem began in the 1970s, when major donors encouraged the government to provide farmers with free electricity for irrigation. The subsidies were manageable at first, and achieved their goal of boosting food production in states like Punjab, Haryana, Rajasthan, Gujarat, and Maharashtra.
But the policy removed the incentive for farmers to limit the amount of water they pumped. They had to invest only in installing the actual pumps – and they did so willingly, resulting in a total of 23 million water pumps today.
This profligacy has taken a serious toll on groundwater levels, forcing the tube-wells from which the water is pumped to be installed ever more deeply. According to the Third World Center for Water Management, the amount of electricity required to pump water in India has doubled – and, in some cases, even tripled – in the last decade alone, as tube-wells have moved from 10-15 meters (32-50 feet) to 200-400 meters (650-1300 feet) deep. The increasing depth requires 3-4 times more horsepower for each pump.
Under these conditions, state water ministries have few options for making groundwater irrigation sustainable. With the relentless increase in electricity subsidies, which are squeezing the energy sector, it is difficult to devise effective policies to stem over-pumping.
The water sector will have to react to developments in the energy and other sectors, over which, despite close ties, it has very limited control. Coordinating the various sectors’ policies effectively will be difficult, to say the least.
It may sound daunting, but the reality is that these challenges are surmountable – if, that is, our leaders commit to tackling them. We already have the needed technology, know-how, experience, and even financing. With strong political will, sustained pressure from an informed public, and a “can do” attitude from water professionals and institutions pursuing intersectoral cooperation, the world’s water-management problems can be addressed effectively.
But we must act now. Time – and water – is running out.
One index that has done very well over the last couple of months is the Dow Jones Transportation Index. As shown below, while the Dow Jones Industrial Average has yet to make a new high, the Dow Transports index has broken out nicely. In fact, the Dow Transports index is up nearly 17% year-to-date, which is 13 percentage points more than the Dow Industrial's minimal YTD gain of 3.46%. Many investors look for the Transports to lead the way, and the fact that it has done so well is a bullish sign for the major indices like the Dow and S&P 500, in our view.
![]()
by Kevin Flynn
My conclusions from listening to the Jon Hilsenrath interview on Tuesday - the one that tipped the markets off to the inclusion of "a considerable time" phrase in the latest FOMC statement, setting off a big rip-reversal rally in the stock market - include the idea that Hilsenrath is beginning to resemble Tim Geithner. The former's anointment as unofficial Fed market liaison has him sounding so steeped in Fed discussions that he's starting to sound more and more like a junior Fed governor and less and less like a reporter. He has some of the same clipped intonations that Geithner was known for, and is quasi-advocating in the same way that Geithner did. Or so it seems to me.
My more immediate conclusion was that so far as the Fed is concerned,
1) There is no bubble
2) There is no timeline
3) There is no exit strategy
There is no bubble
In his Tuesday pre-meeting webcast - surely staged as the opening act to the Fed's main event on Wednesday - Hilsenrath says "The Fed does not think there is a financial bubble right now." Now that's revealing. It's one thing for central bankers to refrain from saying that some market is in a bubble, a protocol that I support, but it's quite another to come out and flatly say there is no bubble. That's the tail side of the no-bubble accusations coin, and the Fed would be better served by respecting it, especially given their dubious record on the subject.
Hilsenrath observed that the Fed is watching debt carried at financial institutions, keeping an eye on their leverage and on things like leveraged loans (the bank just called Credit Suisse (CSGN) in on the carpet for its practices). I would say that as is so often the case, the generals are fighting the last battle.
Have a look sometime at the FOMC minutes from the October 1999 meeting. It's clear that the biggest concern of the members was inflation, as it dominates the minutes. At the time, the "core" year-on-year PCE rate (the preferred measure) was 1.4%. But everyone on the committee was a veteran of 1970s inflation, and by golly it was not going to happen again, not in their lifetime. As for the equity markets, well, they hadn't yet peaked, though there had been some bumpy weather: "Most measures of share prices in equity markets registered sizable declines over the intermeeting period, apparently reflecting not only higher interest rates but also concerns that U.S. stocks might be overvalued and that foreign equities were becoming relatively more attractive as economic prospects brightened abroad." The largest valuation bubble in U.S. history, greater than the 1929 bubble, and all the bank can say is that apparently there are concerns - in the market mind you, the Fed isn't saying anything - that "stocks might be overvalued."
Nor did the committee seem concerned about another issue about to blow up, the rapidly growing glut of telecom gear. Putting the affair down to "competitive reasons" instead of the massive investment bubble, blithely noting with no trace of worry that other business investment spending "pointed to little change."
Move a year later to the October 2000 minutes, and you will see that the bank is still obsessing over inflation. Core PCE had risen to 1.8%! "Risks still were pointed in that direction" (rising inflation). At this point the committee has noticed that the investment bubble in telecom gear ("business spending for equipment and software") "might be moderating." Yes, it did moderate. In fact it crashed, and a recession began six months later. The Nasdaq was getting hammered at the time of the meeting, and the S&P was about to roll over. The committee's outlook: "Looking ahead, they generally anticipated that the softening in equity prices and the rise in interest rates that had occurred earlier in the year would contribute to keeping growth in demand at a more subdued but still relatively robust pace." The committee left rates unchanged.
Fast forward to September of 2007. The economy was clearly in trouble at this point ("the housing sector remained exceptionally weak"), three months away from the official beginning of the recession. Bernanke surprised traders with a cut of 50 basis points instead of 25, leading to a peak in the S&P 500 the following month. The minutes are full of participant concerns about deteriorating financial conditions. Even so, the staff projected that "growth of real GDP was projected to firm in 2009 to a pace a bit above the rate of growth of its potential." That came three months before the official onset of the recession.
In September of 2006, "All meeting participants expressed concern about the outlook for inflation" (core PCE was running at 2.4%). As for the non-existent housing bubble deflating, "Many participants drew some comfort from the most recent data, which suggested that the correction in the housing market was likely to be no more severe than they had previously expected and that the risk of an even larger contraction in this sector had ebbed," though "further adjustment in the housing market appeared likely."
If you still feel good about the Fed seeing no bubble, then in the immortal words of Jules Winnfield (Samuel Jackson in Pulp Fiction), "allow me to retort." The Shiller PE is at levels above every other time but 2007, 2000, and 1929. The S&P price-to-sales ratio is at 2000 levels. Tobin's Q is above every historic level but the tech bubble, and my favorite, the ratio of market cap to GDP, almost up to the level of the peak of the tech bubble:
(click to enlarge)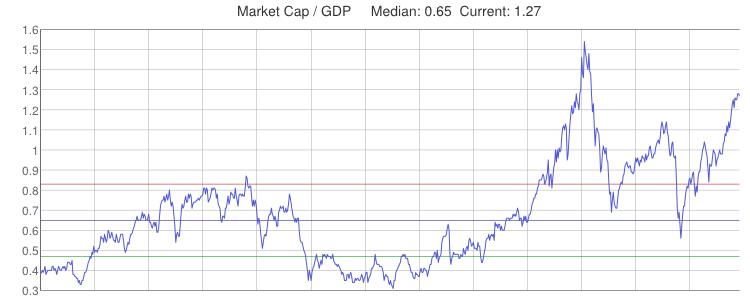
But there is no asset bubble, you see, because banks aren't as leveraged and the Fed is still fighting the last battle. Put me down with Mohamed El-Erian, who tweeted after the meeting that the "steady as she goes" Fed "supports recovery upfront, underwriting bigger risk of financial instability."
One of the other sentiments that came through in the Hilsenrath interview was the traditional central banker disdain for markets. Hilsenrath was clearly echoing committee sentiment when he complained disdainfully that everyone wants to know "when when when" and that "a lot of them have a trade on." That's true - quite a lot of them do have a trade on and are most interested in how to trade (bizarre behavior for a financial market, I know, but these things can happen in the best of countries). But a fair number also happen to be of the Keynesian/New Keynesian persuasion (e.g., El-Erian - monetarists are not in favor at the Fed) and understand market dynamics and imbalances far better than any members of the committee.
Some of the disdain is understandable. The models that pepper Fed policy and discussion papers are forbiddingly complex to look at, full of Greek symbols and heavy-duty applied calculus and algebra. Even if you do this stuff for a living, it can take quite a bit of serious effort to work out whether a model might be making sense, and to seriously check it takes more time than most researchers have. Once one has sweated out the current dynamic general-equilibrium model favored by the Fed, opening up the Wall Street Journal to read about the latest insider-trading jail term, or putting on a business news channel and hearing one of the fruitier ideologues rant about lunar eclipses being faked to sabotage the price of (fill in commodity name), it can color one's view of the world.
But much of the disdain is sadly misplaced. It's better here than in Europe, where the market is looked at as entirely made up of crooks and morons - here they are looked at as only some crooks and many morons - but having been stripped utterly naked and left in the gutter by the markets twice in the last fifteen years hasn't seemed to help the bank's sense of superiority. It's unfortunate. Indeed, much of the Fed work subsequent to the last two crashes has been devoted to finding esoteric "hidden" factors behind them that let the bank off the hook in one way or another.
I applaud the work the Fed is doing to rein in leveraged loans. The macro-prudential approach that was conspicuously absent in the last bubble is being applied now in the more obvious areas, but the risk isn't ever likely to be concentrated in the same place twice in a row. I suggest listening to the Grosses, El-Erians, Einhorns and Buffetts now and then. Just because they make more money than you doesn't mean they're all venal and stupid. In fact, all of the four but Buffett can read the models, and he would just laugh if you asked.
There is no timeline
The "considerable amount of time" wording was left in, as you all must know. However, the "dots" diagram (individual member rate projections) gave the show away - most participants expect the funds rate to be at or above 1% by the end of next year. Yellen was well prepared for this one, and was at her professorial best at repeating "central tendency" and reiterating that the Fed will read the data and react (what is the over-under, I wonder, on the number of times a Fed chair nods vigorously during a press conference?). So there is a central tendency timeline - that for the moment the committee refuses to divulge. I am sure that last year's "temper tantrum" and this year's "six months" gaffe have nothing at all to do with avoiding the timeline subject.
More likely is that with QE ending, Yellen wanted to throw the doves a bone, as I wrote last week, and so left in "considerable amount of time" until the next meeting, or so Hilsenrath seemed to indicate. Maybe October will see a change to "foreseeable future," or "until conditions dictate otherwise," or some other variation on Halloween magic.
There is no exit strategy
That may seem unfair, as the Fed did lay out a general battle plan for what to do once it decides to embark on the rate-raising path (Hilsenrath had the inside position there too). It just won't divulge what triggers the decision. Yellen did make one meaningful comment, that "full employment" equates to an unemployment rate of 5.2%-5.5%. If the FOMC had made reference to this band before, it was news to me.
However, the committee hasn't yet decided between the "soon and slow" and "late and fast" approaches. The best thing that could happen to the Fed is for everyone to wake up tomorrow morning and read that we had all slept for twelve months and the funds rate was now 1%. The reason I say that is because a 1% rate wouldn't be a problem for the economy at all - recall that 1% is the number Alan Greenspan gets blamed for as leaving in so long that it inflamed the housing bubble.
The problem isn't an absolute level of short rates of 1% or 1.5%, but the transition to that level. The "late and fast" set wants to avoid any blame at all for the next recession, so they would wait until the economy is roaring - which it may not do during this cycle, despite the sudden new mantra of "lower and longer" (reminding me of "new economy" and "decoupling" as other New Plateau theories).
I am very serious when I say that would surely lead to another Minsky Moment (massive instability following artificial stability) and the likely rewrite of the Fed's charter. Despite my criticism of the Fed these past two years, a populist rewrite of the central bank is not an outcome I want to see happen. "Some" committee members favor the soon-and-slow approach as avoiding the eventual overaccumulation of risky assets dependent on ultra-low rates. That's sensible - if it hasn't happened already. Selling another trillion dollars or so of high-yield bonds that will crater when rates move up to one percent is not going to help the Fed's exit. There's no reason for 1% short rates to make credit scarce, but millions of those market morons trying to unload their rapidly depreciating high-yield paper, well, that's going to be a problem.
At the end of the Hilsenrath webcast, he acknowledged the Fed's greatest current weakness - it has no defense against a recession. I don't see one as being likely this year or in the next few quarters, but the problem is that the central bank has little defense against any adverse economic event. They have a way of happening, you know.
At the end of day one, the bond market seemed to think the statement was somewhat hawkish, equities dovish (big surprise, that one). What will the impact be on the stock market? My guess is that it will help sustain the market advance overall for at least the next couple of quarters. However, the longer that stock market gains outpace earnings gains, the bigger the final payback will be when valuations revert to the mean (and they always do). In the interim, the end of QE next month is a moat the market still has to jump across. The last two times, it got soaked.
By Seth J. Masters and John McLaughlin
Many investors with little appetite for risk think cash is the safest asset class. After all, if you have no investments, you have no investment risk. That’s true enough, but it’s reassuring only if you ignore inflation and taxes. And of course, most individuals do pay taxes and everyone experiences inflation.
Take inflation and taxes into account, and investors holding nothing but cash are virtually certain to be poorer in real terms three years from now. An all-bond portfolio is a somewhat better proposition, but it, too, could well lose purchasing power in the market environment we anticipate. Unfortunately, no portfolio is completely safe after taxes and inflation.
Fortunately, there is a much better way to control risk than keeping all your money in cash or bonds: diversifying through a modest addition of stock to the mix. By our calculation, even the most risk-averse investors should hold at least 20% of their portfolios in stocks—assuming that they don’t have large bills to pay in the very near term.
The Display shows how we came to this conclusion. Using our Wealth Forecasting System, we projected annualized three-year returns for portfolios with a range of asset allocations. In typical markets, after inflation and taxes, we forecast that an all-cash portfolio (on the extreme left) will lose 1.8% a year. In great markets, it will lose 0.6%, and in hostile markets, the losses will mount to 3.3% a year. For all these forecasts, we’ve assumed a U.S. investor in the highest federal tax bracket.
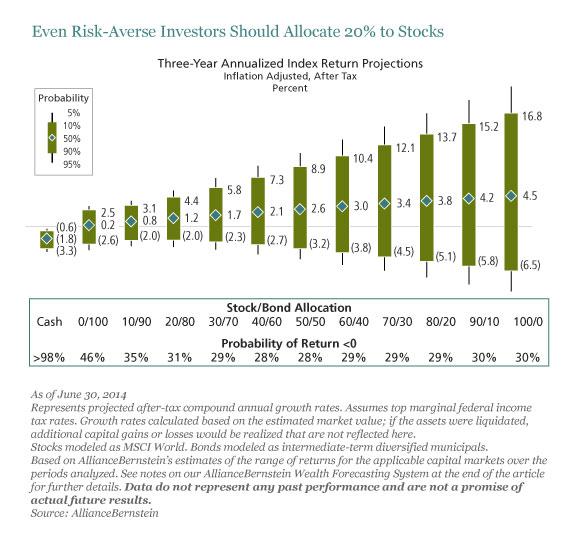
Directly to the right of the all-cash portfolio, you can see that we expect an all-bond portfolio to deliver 0.2% a year in typical markets, 2.5% in great markets and (2.6)% in hostile markets.
In comparison to the all-cash and all-bond choices, we predict that an all-stock portfolio (on the extreme right) will deliver a lot more in typical and great markets, but also lose more in hostile markets, yielding returns of (6.5)% annualized. This may seem very mild compared to memories of 2008, but in fact, annualized returns for the three years from 2007 to 2009 were not a great deal worse: (7.2)%. Our analysis indicates that the probability of another loss this large is less than 10%.
Between the all-bond and the all-stock portfolios, we’ve estimated the range of returns you are likely to experience across the full spectrum of diversified portfolios.
For a taxable investor whose primary goal is minimizing the risk of real losses, the 20/80 asset mix offers better returns than the all-cash or all-bond portfolio in positive market environments and smaller losses when market returns are negative. To the right of the 20/80 portfolio, the more stock exposure you add, the better you do when markets are typical or better, but the worse you do when market returns are poor.
Fear (and greed) can prompt investors to make irrational choices. Cash feels safe, but a closer look shows otherwise. Risk-averse investors who can overcome their emotional bias against owning any stock can improve their returns and reduce their real downside risk.
by Dennis J. Snower
KIEL – The world seems to be on the verge of another “great transformation,” with changes far more profound than news-grabbing economic or geopolitical headlines about Asia’s economic rise or the fires in the Middle East. The coming changes will fundamentally redefine the nature of our economic interactions – and the social dynamics that underlie them.
This is a transformation on the scale of the shift, more than 8,000 years ago, from nomadic hunter-gatherer societies to settled agricultural ones, which eventually led to the rise of cities. A similar transformation occurred in Europe in the tenth century, with the emergence of guilds – associations of skilled workers who controlled the practice of their craft in a particular town – which paved the way for the Industrial Revolution.
The particular characteristics of the impending transformation remain unclear. It may well involve revolutions in bio-, nano-, and digital technology, together with a social-networking revolution that eliminates geographical and cultural barriers. What is already clear, however, is that, like previous transformations, this one will involve a fundamental change in all of our economic relations and the social relations that support them.
Mainstream economics offers a straightforward analysis of and policy response to such a transformation. Whenever technological or other changes allow for people to be compensated for the benefits that they confer on one another (minus the costs), the price-based market system can adjust. When the changes create externalities, economic restructuring is required – say, adjustments in taxes and subsidies, regulatory shifts, or property-rights upgrading – to offset the costs and benefits for which the market cannot compensate. And when the changes give rise to particularly high levels of inequality, redistributive measures are needed.
This approach is based on the assumption that, if everyone is fully compensated for the net benefits that they confer on others, individuals pursuing their own self-interest will, as Adam Smith put it, be led, “as if by an invisible hand,” to serve the public interest as well. According to this view, everyone is Homo economicus: a self-interested, fully rational individualist.
But, as past “great transformations” demonstrate, this approach is inadequate, because it neglects the social underpinnings of market economies. In such economies, contracts tend to be honored voluntarily, not through coercive enforcement. What makes these economies function is not a policeman protecting every shop window, but rather people’s trust, fairness, and fellow-feeling to honor promises and obey the prevailing rules. Where this social glue is lacking – such as between Israelis and Palestinians – people cannot exploit all of the available economic opportunities.
This link is apparent in the deep social significance of most of an individual’s economic transactions. When people acquire expensive cars, designer clothing, and opulent houses, they generally seek social recognition. When couples or friends give gifts to one another or take vacations together, they perform economic transactions inspired by affiliation and care.
In short, mainstream economics – and the concept of homo economicus – recognizes only half of what makes us human. We are undoubtedly motivated by self-interest. But we are also fundamentally social creatures.
This oversight is particularly crippling in view of the impending transformation, which will upend the underpinnings of contemporary society. Indeed, at present, despite unprecedented economic integration and new opportunities for cooperation, our social interactions remain atomized.
The problem lies in deeply ingrained – and divisive – perceptions of identity. The world is divided into nation-states, each controlling many of the instruments of public policy. People’s social allegiances are divided further by religion, race, occupation, gender, and even income bracket.
Where social barriers are sufficiently strong, economic barriers are certain to appear. These can range from protectionist trade policies and increasingly strict immigration controls to religious wars and ethnic cleansing.
Clearly, economic success vitally depends on how people perceive their social affiliations. One view is that our identities are immutable, impermeable, exogenously generated, and intrinsically opposed to one another. This classic “us versus them” dichotomy leads to sympathy for one’s in-group and implacable conflict with out-groups – a bottomless source of conflict throughout history.
But another view is possible: each person has multiple identities, the salience of which is shaped by one’s motivations and circumstances. This idea – which is firmly rooted in neuroscience, psychology, anthropology, and sociology – implies that an individual has significant latitude in shaping his or her identities.
This is not to say that national and religious identities are not profoundly important. Rather, it implies that we are co-creators of our identities. Instead of choosing identities that divide us, making it impossible to tackle multiplying global problems, we can shape identities that extend our sense of compassion and moral responsibility.
A growing body of scientific evidence shows that compassion, like any other skill, can be ingrained and enhanced through teaching and practice. Educational institutions can thus work to develop students’ capacity for caring in tandem with their cognitive abilities.
More broadly, societies everywhere should be driven by a common goal that transcends their diverse backgrounds. Resolving problems that extend across borders is a good place to start, with strategies involving specific tasks for various groups and countries to undertake that advance the greater good. Initiatives like conflict-resolution workshops, reconciliation commissions, cross-cultural education programs, and compulsory civic duty for school leavers could also help.
The mainstream view that people are wholly self-interested economic actors denies our innate capacity for reciprocity, fairness, and moral responsibility. In deepening social affiliations, we can lay the groundwork for a new form of economy in which many more opportunities can be seized.
by The Economist

WHEN Li Keqiang, China’s prime minister, spoke at a big business meeting earlier this month, he trumpeted two achievements. Not only had the government overseen steady economic growth, he said, but it had done so without resorting to a big stimulus. Both assertions are now looking rather doubtful.
A barrage of data for August pointed to a sudden weakening in growth, catching many analysts and investors by surprise. Although it is unwise to read too much into one month’s numbers, the figures had a distressingly uniform downward tilt. Investment, retail sales and credit issuance all slowed. Industrial output, which is closely correlated with GDP given the size of China’s manufacturing sector, grew at its weakest pace since late 2008, when the global financial crisis was battering the economy. Housing sales, already struggling, contracted further; they have fallen 8% so far this year. That has started to eat into the revenues of local governments, since property developers are holding back on land purchases. Yao Wei of Société Générale, a French bank, called it a “shockingly sharp” deceleration.
Until the gloomy data started to pile up, China’s economy had seemed to be following an established pattern. A wobbly start to 2014 had prompted the government to come up with a series of policies to revive growth. It sped up spending on infrastructure and cheap housing, while the central bank administered a small dose of monetary easing. In 2012 and again in 2013 measures of more-or-less the same design had been enough to keep the economy going. But this year the jolt lasted for little more than a month before petering out.
Trouble in the property sector, which directly accounts for about 15% of China’s GDP, is the biggest single factor. A glut of unsold homes has started to weigh on the market. Inventories at listed developers rose by a quarter in the first half, reaching 65% of their assets, an all-time high, according to CICC, a Chinese investment bank. The pain is even spreading to the biggest cities, especially in suburbs where building has been most frenetic. In Jiading, a northern district of Shanghai, the streets are lined with ads for new homes, yet the showrooms of its sprawling developments receive few visitors.
The good news is that property is getting more affordable: the average home costs about 8.8 times the annual income of the average Chinese household, down from nearly 12 times in 2010, according to an index calculated by the Economist Intelligence Unit, a sister company of The Economist. The bad news is that the market may yet be far from bottoming out.
Another reason for the economy’s weakness is Mr Li’s desire to wean the economy off its rising dependence on debt, which has soared to more than 200% of GDP. China has not yet started deleveraging, but credit is at least growing more slowly as regulators force banks to hold more capital to cover loans they have kept off their balance-sheets. When the prime minister spoke at a World Economic Forum event in Tianjin on September 10th, he had surely been briefed in advance about the poor August data. Yet he still persisted in ruling out a “strong economic stimulus” and instead emphasised the importance of reforms—an indication that the government will tolerate the current slowdown.
Mr Li, though, is not willing to let the slowdown turn into a rout. On September 16th, local media reported that the central bank had injected 500 billion yuan ($81 billion) into the financial system via loans to big banks. It is customary for the central bank to pump out cash before China’s two annual weeklong holidays, one of which begins in early October, as demand for money spikes. But the special loan was far bigger than anything of its kind in the past.
The central bank did not actually announce the loan, doubtless because it did not want to look like it was going back on Mr Li’s pledge to refrain from stimulus. Instead, word of it spread on Sina.com, a web portal. “Because it is so low profile, a large part of the effectiveness is wasted,” says Larry Hu of Macquarie Securities. Evidence from earlier this year is that stealthy forms of monetary easing do not have a lasting impact, since businesses are uncertain about what the government actually intends. Mr Li himself appears uncertain. Refraining from large-scale stimulus is the right medicine for the economy in the longer term. But there is no sense in pretending that fast growth can be sustained this year without it.
by Jeffrey Frankel
CAMBRIDGE – Most reviews of Thomas Piketty’s book Capital in the Twenty-First Century have already been written since its startling rise to the top of bestseller lists in April. But I thought it wise to read the volume in its entirety before offering my thoughts. It has taken me five months, but I have finally finished it.
One thing that the book has in common with Karl Marx’s Capital is that it serves as a rallying point for those concerned about inequality, regardless of whether they understand or agree with Piketty’s particular argument. To be fair, whereas very little of what Marx wrote was based on carefully collected economic statistics, and much of it was bizarre, much of what Piketty writes is based on carefully collected economic statistics, and very little of it is bizarre.
In the United States, income inequality by most measures has been rising since 1981, and by 2007 had approximately re-attained its early-twentieth-century peak. The same is true in the United Kingdom, Canada, and Australia. In these countries, income inequality declined sharply from 1914 to 1950, as it did in France, Germany, Japan, and Sweden. But in the latter group, the income distribution is now far more egalitarian than it was at peak inequality a hundred years ago.
Economists, at least in the US, have focused on several causes of the increase in inequality. First, there is the wage difference between “skilled” and “unskilled” workers, defined according to their educational attainment. Here, higher wages are often agreed to reflect the economic value of skills appropriate to an increasingly technological economy, and the question is how to improve workers’ skills.
Second, there is the high compensation of corporate executives and people in finance. The financial crisis of 2008 left many observers understandably doubtful of claims that this compensation is a return to socially valuable activities.
Third, there is the winner-take-all character of many professions. In a society that can identify the best dentist in town or the best football player in the world, relatively small differences in abilities win far bigger differences in income than they used to. Finally, there is “assortative mating”: highly accomplished professional men now marry highly accomplished professional women.
Piketty focuses on none of these sources of inequality, all of which are related to “earned income” (wages and salaries). Rather, his central concern is what he regards as a twenty-first-century trend toward inequality of wealth, brought about by the steady accumulation of savings among the better off, which are then passed down, with accumulated interest, from one generation to the next.
It is true that capital’s share of income (interest, dividends, and capital gains) rose gradually in major rich countries during the period 1975-2007, while labor’s share (wages and salaries) fell, a trend that would support Piketty’s hypothesis if it continued. Piketty deserves credit for pointing out the lack of a foundation supporting assertions that capital’s share will necessarily revert to a long-run constant.
But interest rates have been at all-time lows in recent years – virtually zero. And the claim that in the long run the interest rate must be substantially greater than the economic growth rate is absolutely central to Piketty’s book.
That said, Piketty’s vision is focused squarely on the truly long run: century-long trends, not decade-long fluctuations. For example, the recent global financial crisis runs counter to his ultra-long-run hypothesis: his statistics clearly show a discrete fall in inequality and in capital’s share in 2008-09, because asset prices plummeted. But, from the perspective of his analysis, this is a historical blip.
Three century-long movements constitute the essence of the book: a rise in inequality in the nineteenth century, a fall in inequality in the twentieth century, and a predicted return to historically high inequality in the twenty-first century. Piketty argues convincingly – not just with statistics, but also with references to Honoré de Balzac and Jane Austen – that the first increase in inequality in France and Britain, mostly from 1800 to 1860, took the form of capital accumulation. A small group of rich rentiers lived off their interest; the rest had to work for a living.
The most dramatic movement in Piketty’s graphs is the second one, the sharp fall in inequality in the period 1914-1950. This is attributable to the destruction of capital – owing to two world wars, the 1929 stock-market crash, and inflation – as well as an historic move toward big government and progressive taxation.
What is surprisingly scarce in Piketty’s data is evidence that the third movement – the renewed upswing in inequality that started around 1980 – is due to a shift from labor back to capital. The share of capital income in the UK and France remains far lower than it was in 1860. The increases in various measures of inequality since the 1970s have had more to do with shifts within labor’s share (between different categories of earned income) than with wealth. Today’s rich work, unlike those in the Balzac-Austen era.
Thus, Piketty’s hypothesis is more a prediction of the future than an explanation for the past or an analysis of a recent trend. It is a prediction that interest rates will rise substantially above the growth rate, capital will accumulate, and the rich will get richer through inheritance and capital income, rather than through outlandish salaries and stock options. For all of Piketty’s impressive historical data, his prediction is based mainly on a priori reasoning: income distribution must tend to inequality because savings accumulate.
But one could just as easily find a priori grounds for predicting that countervailing forces will emerge if the gap between rich and poor continues to grow. Democracy is one such force. After all, the rise of progressive taxation in the twentieth century followed the excesses of the Belle Époque.
A few years ago, the US reduced federal taxes on capital income and phased out the estate tax, benefiting only the upper 1% – moves widely viewed as demonstrating the political power of the rich. But imagine that in the future we lived in a Piketty world, where inheritance and unearned income fueled stratospheric income inequality. Could a majority of the 99% still be persuaded to vote against their self-interest?
by Andrew Sheng and Xiao Geng
HONG KONG – Many observers tend to regard the rise of unoccupied modern “ghost towns,” funded through risk-laden local-government financing vehicles (LGFVs), as symptoms of China’s coming collapse. But this view underestimates the inevitability – indeed, the necessity – of such challenges on the path to development.
In 2012, the venture capitalist William Janeway argued that economic development is a three-player game involving the state, private entrepreneurial innovation, and financial capitalism, with inevitable cyclical overshoots that create the conditions for the next wave of invention and output growth. The United States had ghost towns and local bank busts once it began investing in railways, mining, and industrialization in the mid-nineteenth century. But it experienced no systemic crisis that spilled over its borders.
Without large-scale infrastructure investment, especially in transport, the productivity gains that enabled America’s emergence as an industrial power would have been impossible. Though the process included significant creative destruction, rapid economic growth offset losses resulting from excess capacity.
Similarly, when viewed through the long lens of history, China’s ghost towns will prove to be potholes on the path to development. China’s massive infrastructure investment, funded largely through LGFVs, will most likely be remembered for its critical contribution to the country’s economic modernization.
Of course, the translation of infrastructure investment into economic progress is not guaranteed. The new infrastructure – together with on-the-job training that enables Chinese workers to manage it effectively – must boost the country’s productive capacity sufficiently to offset the value destruction from obsolete fixed assets and underemployment.
In this sense, China’s prospects are promising. As it stands, the total value of infrastructure investment in China amounts to only about 240% of GDP, less than half of Japan’s 551% – and with a much younger population. China’s capital stock remains below $10,000 per capita; that figure is above $90,000 in the US and more than $200,000 in Japan (at 2011 prices).
Moreover, roughly 1% of China’s population – about 12 million people – is migrating to cities each year. Unrelenting demand for modern, innovative infrastructure that supports citizens’ livelihoods, improves energy efficiency, and minimizes pollution cannot simply be ignored – especially given urbanization’s central role in driving economic modernization and productivity gains.
Though LGFVs carry some intrinsic risks, stemming from relatively low levels of transparency and government supervision, they have been integral to China’s industrialization process so far. Indeed, they emerged in the early 1990s to enable Shanghai and Guangdong to upgrade their infrastructure in preparation for their industrialization drive.
Both cities suffered from weak technical and institutional capacity and little foreign exchange or domestic credit. By working with the World Bank and the China Development Bank (CDB), Shanghai and Guangdong created an innovative institutional structure to facilitate the coordination of stakeholders to deliver specific infrastructure projects, employing the legal and accounting tools of modern corporations. In other words, the LGFV is, at its core, a vehicle for local modernization.
This institutional innovation enabled the reconstruction of hundreds of Chinese cities, connected by airports, highways, high-speed rail, and advanced telecommunication systems. Supported by these structures and linkages, one-third of Chinese cities have attained per capita GDP of more than $10,000.
Moreover, the original LGFVs were not subject to maturity mismatches, because they were funded through long-term CDB loans, with local governments using the fees and taxes they accrued from the completed infrastructure to cover operating costs and service their debt. In this way, LGFVs also helped to create the network linking local markets to global value chains.
But, as is often the case, success led to excess. Massive government stimulus in the wake of the global financial crisis spurred local governments to take loans from Chinese banks to realize dream infrastructure projects, with remote cities attempting to imitate urban showcases like Shanghai or Shenzhen.
In a sense, this was a positive development. After all, leveling the infrastructure gap enlarges the range of options from which people and companies can choose when deciding where to live or establish factories and offices.
But the infrastructure boom was underpinned by the belief that local governments would always have access to easy credit, cheap land, and rising demand. When the market tightened in 2011, many projects’ prospects diminished, spurring LGFVs to seek credit in the shadow banking sector, which has caused their borrowing costs to rise and introduced new market-based challenges to the reform process.
Nonetheless, because China is a net lender to the world, LGFV debt has no global systemic implications. While China’s outstanding local-government debt totaled CN¥29 trillion ($4.7 trillion) at the end of 2011, its land and fixed assets are worth some CN¥90 trillion, meaning that even if asset values were written down by half, local governments would remain solvent.
This leaves only the issue of debt servicing. To resolve it, the government has announced fiscal reforms to split revenues between central and local governments and enable local governments to issue long-term municipal bonds.
China’s ghost towns and local-government debts are not harbingers of doom. They are bumps on the road to a developed economy, in which excesses will have to be resolved by the state or the market. In fact, overcoming these challenges will make for a more resilient economy in the long run.
Follow Us