Sunday, February 1, 2015

Canada in Recession, US Will Follow in 2015

by Mike Shedlock

On January 21 when the Canadian Central Bank unexpected slashed interest rates, I wrote Canadian Recession Coming Up.
Following the rate cut, the yield curve in Canada inverted out to three years. Inversion means near-term interest rates are higher than long-term rates.
I saw no other person mention the inversion at the time. An inverted yield curve generally portends recession.
Nine days later, the Canadian yield curve is still inverted. Let's compare what I posted about the curve on January 21 vs. January 30.
Canadian Yield Curve January 21

  • 30-year: 2.044% (Today's Low 1.998%)
  • 10-Year: 1.426% (Today's Low 1.366%)
  • 05-Year: 0.791% (Down 19 basis points, an 18% decline)
  • 03-Year: 0.590% (Down 27 basis points, a 31% decline)
  • 02-Year: 0.560% (Down 29 basis points, a 34% decline)
  • 01-Year: 0.580% (Down 34 basis points, a 37% decline)
  • 01-Month: 0.640% (Down 22 basis points, a 26% decline)

Canadian Yield Curve January 30
  • 30-year: 1.834% (Down 21.0 basis points)
  • 10-Year: 1.250% (Down 17.6 basis points)
  • 05-Year: 0.603% (Down 18.8 basis points)
  • 03-Year: 0.386% (Down 20.4 basis points)
  • 02-Year: 0.392% (Down 16.8 basis points)
  • 01-Year: 0.490% (Down 9.0 basis points)
  • 01-Month: 0.580% (Down 6.0 basis points)

Not only did yields plunge across the board since then, the yield curve is still inverted all the way out to three years.
Recession Has Arrived
There is no point in waiting for further data. The Canadian recession has already arrived.
On Friday, the Financial Post reported Canada GDP Shrinks on Biggest Factory Drop in Six Years.
The Canadian dollar plunged below 79 cents US today after data showed Canada’s gross domestic product contracted in November as manufacturing dropped the most since January 2009 and on declines in mining and oil and gas extraction.
Output shrank by 0.2%, the most in 11 months, to an annualized $1.65 trillion, Statistics Canada said Friday in Ottawa. The median forecast in a Bloomberg economist survey was for output to be little changed.
Manufacturing declined by 1.9% in November, with losses ranging from machinery and equipment to plastics and rubber.
The Bank of Canada unexpectedly lowered borrowing costs last week for the first time since 2009, saying the move was meant to provide insurance as the slump in crude oil, the nation’s biggest export, weighed on the economy.


"Insurance"
The Bank of Canada called the rate cut "insurance". Insurance from what? If they think it will halt a recession, it won't. The recession is here. There is no need to wait for another quarter of declining GDP to confirm. A Canadian recession is underway.
US Will Follow
I remain amused by all the pundits who think the US has "decoupled" from the global economy and will grow stronger in 2015.
Here's news: "It won't", just as China did not decouple from the global economy in 2008-2009 (a widely-held thesis I also knocked at the time).

See the original article >>

An Unconventional Truth

by Nouriel Roubini

NEW YORK – Who would have thought that six years after the global financial crisis, most advanced economies would still be swimming in an alphabet soup – ZIRP, QE, CE, FG, NDR, and U-FX Int – of unconventional monetary policies? No central bank had considered any of these measures (zero interest rate policy, quantitative easing, credit easing, forward guidance, negative deposit rate, and unlimited foreign exchange intervention, respectively) before 2008. Today, they have become a staple of policymakers’ toolkits.

Indeed, just in the last year and a half, the European Central Bank adopted its own version of FG, then moved to ZIRP, and then embraced CE, before deciding to try NDR. In January, it fully adopted QE. Indeed, by now the Fed, the Bank of England, the Bank of Japan, the ECB, and a variety of smaller advanced economies’ central banks, such as the Swiss National Bank, have all relied on such unconventional policies.

One result of this global monetary-policy activism has been a rebellion among pseudo-economists and market hacks in recent years. This assortment of “Austrian” economists, radical monetarists, gold bugs, and Bitcoin fanatics has repeatedly warned that such a massive increase in global liquidity would lead to hyperinflation, the US dollar’s collapse, sky-high gold prices, and the eventual demise of fiat currencies at the hands of digital krypto-currency counterparts.

None of these dire predictions has been borne out by events. Inflation is low and falling in almost all advanced economies; indeed, all advanced-economy central banks are failing to achieve their mandate – explicit or implicit – of 2% inflation, and some are struggling to avoid deflation. Moreover, the value of the dollar has been soaring against the yen, euro, and most emerging-market currencies. Gold prices since the fall of 2013 have tumbled from $1,900 per ounce to around $1,200. And Bitcoin was the world’s worst-performing currency in 2014, its value falling by almost 60%.

To be sure, most of the doomsayers have barely any knowledge of basic economics. But that has not stopped their views from informing the public debate. So it is worth asking why their predictions have been so spectacularly wrong.

The root of their error lies in their confusion of cause and effect. The reason why central banks have increasingly embraced unconventional monetary policies is that the post-2008 recovery has been extremely anemic. Such policies have been needed to counter the deflationary pressures caused by the need for painful deleveraging in the wake of large buildups of public and private debt.

In most advanced economies, for example, there is still a very large output gap, with output and demand well below potential; thus, firms have limited pricing power. There is considerable slack in labor markets as well: Too many unemployed workers are chasing too few available jobs, while trade and globalization, together with labor-saving technological innovations, are increasingly squeezing workers’ jobs and incomes, placing a further drag on demand.

Moreover, there is still slack in real-estate markets where booms went bust (the United States, the United Kingdom, Spain, Ireland, Iceland, and Dubai). And bubbles in other markets (for example, China, Hong Kong, Singapore, Canada, Switzerland, France, Sweden, Norway, Australia, New Zealand) pose a new risk, as their collapse would drag down home prices.

Commodity markets, too, have become a source of disinflationary pressure. North America’s shale-energy revolution has weakened oil and gas prices, while China’s slowdown has undermined demand for a broad range of commodities, including iron ore, copper, and other industrial metals, all of which are in greater supply after years of high prices stimulated investments in new capacity.

China’s slowdown, coming after years of over-investment in real estate and infrastructure, is also causing a global glut of manufactured and industrial goods. With domestic demand in these sectors now contracting sharply, the excess capacity in China’s steel and cement sectors – to cite just two examples – is fueling further deflationary pressure in global industrial markets.

Rising income inequality, by redistributing income from those who spend more to those who save more, has exacerbated the demand shortfall. So has the asymmetric adjustment between over-saving creditor economies that face no market pressure to spend more, and over-spending debtor economies that do face market pressure and have been forced to save more.

Simply put, we live in a world in which there is too much supply and too little demand. The result is persistent disinflationary, if not deflationary, pressure, despite aggressive monetary easing.

The inability of unconventional monetary policies to prevent outright deflation partly reflects the fact that such policies seek to weaken the currency, thereby improving net exports and increasing inflation. This, however, is a zero-sum game that merely exports deflation and recession to other economies.

Perhaps more important has been a profound mismatch with fiscal policy. To be effective, monetary stimulus needs to be accompanied by temporary fiscal stimulus, which is now lacking in all major economies. Indeed, the eurozone, the UK, the US, and Japan are all pursuing varying degrees of fiscal austerity and consolidation.

Even the International Monetary Fund has correctly pointed out that part of the solution for a world with too much supply and too little demand needs to be public investment in infrastructure, which is lacking – or crumbling – in most advanced economies and emerging markets (with the exception of China). With long-term interest rates close to zero in most advanced economies (and in some cases even negative), the case for infrastructure spending is indeed compelling. But a variety of political constraints – particularly the fact that fiscally strapped economies slash capital spending before cutting public-sector wages, subsidies, and other current spending – are holding back the needed infrastructure boom.

All of this adds up to a recipe for continued slow growth, secular stagnation, disinflation, and even deflation. That is why, in the absence of appropriate fiscal policies to address insufficient aggregate demand, unconventional monetary policies will remain a central feature of the macroeconomic landscape.

See the original article >>

Weighing the Week Ahead: Will the data deluge signal economic weakness?

by oldprof

This is a landslide week for economic data, and earnings season is in full swing. Last week’s Q4 GDP report and overall market tone has revived deflation concerns. I expect market participants to be watching each economic release closely, asking: Are there signs of incipient economic weakness?

Prior Theme Recap

In last week’s WTWA I predicted that there would be special attention to Europe and the Greek elections, with a mid-week switch to the Fed and continuing interest in earnings. That was pretty accurate for the week as a whole, but there were two surprises. The downbeat GDP report, normally regarded as old news that will be further revised, had a modest pre-market and intra-day effect. The late-day ISIS/Iraq news was important on Friday afternoon. Since the spike in energy prices had a specific cause and left many not wanting to be short over the weekend, the standard energy-stock price correlation did not hold up. This was just bad news.

There is no better way to review the past week than Doug Short’s 15-minute chart. While I highlight this time period for the “week behind” purpose, Doug’s article has plenty of other charts and great analysis. I hope readers are following the links.

SPX-150130

Feel free to join in my exercise in thinking about the upcoming theme. We would all like to know the direction of the market in advance. Good luck with that! Second best is planning what to look for and how to react. That is the purpose of considering possible themes for the week ahead.

This Week’s Theme

The week ahead includes plenty of economic news, earnings reports, speechifying, and geopolitics. People frequently expect this to mean exceptional volatility, and it might. More often the news cuts both ways. As we saw last week, volatility can result from a few key stories, especially when the news is a surprise.

The disappointing report on Q4 GDP has set the tone for this week. The popular meme has been that declining commodity prices and bond yields carry an important message about the US economy. I expect a major media focus to be the following:

Do the economic data reveal growing weakness in the US economy?

I expect this to be sliced, diced, and compared to the “messages” from commodity prices and corporate earnings, continuing through Friday’s employment report. Here are the contending viewpoints:

  1. QE is failing everywhere. Central bankers are out of ammo. Marc Faber in this week’s Barron’s roundtable wants to “short central bankers.” Also writing for Barron’s, Vito J. Racanelli captures what I often call the trader perspective:

    Ostensibly, investors were disappointed by data on U.S. economic growth, but the deeper issue is a nascent feeling that the worldwide quantitative easing (QE) cycle has reached the limits of encouraging growth.

    This thinking is sustained by tumbling oil prices—which rose 6% last week to $48.24 per barrel but have fallen for seven consecutive months. Where once that plunge was welcome, investors now see it as a barometer of weak global gross-domestic-product (GDP) growth in 2014. The ongoing Greek drama over the country’s huge fiscal imbalances is also fueling uncertainty and keeping pressure on stock prices.

  2. Economic data show continuing modest growth, a bit slower than Q3. (Chicago Fed indicators reported by Doug Short).
  3. Global economic signs are showing some bottoming. Dr. Ed considers Asian countries, commodities, monetary policy and the Year of the Sheep.

My sense is that choice #1 is the prevailing theme. What do you think?

As always, I have some additional ideas in today’s conclusion. But first, let us do our regular update of the last week’s news and data. Readers, especially those new to this series, will benefit from reading the background information.

Last Week’s Data

Each week I break down events into good and bad. Often there is “ugly” and on rare occasion something really good. My working definition of “good” has two components:

  1. The news is market-friendly. Our personal policy preferences are not relevant for this test. And especially – no politics.
  2. It is better than expectations.

The Good

Despite the market reaction, there was plenty of good news last week.

  • Weekly jobless claims fell dramatically, to 265K, lowest since 2000. The survey period included the MLK holiday, but the BLS did not cite that as a problem. Normally I would not mention this, preferring to look at the four-week average of the noisy series, but I have highlighted as “bad news” the two recent reports above 300K. It is only fair to mention the good news. Properly interpreted, this is an important series.
  • Earnings reports have been positive. It does not seem like it, but 80% of reporting S&P companies have beaten on earnings and 58% on sales. Overall growth is running at 2.1%, slightly better than predicted at the start of the quarter. Apple was a big positive for the overall numbers and energy stocks remain a drag (FactSet).
  • Personal consumption increased 4.3%, beating expectations of 4%.
  • Michigan consumer confidence nearly held the preliminary reading, scoring 98.1. Some ascribe the enthusiasm to lower gas prices or the hiring of Jim Harbaugh as the new football coach. In fact, this is an excellent nationwide survey which takes a panel approach. This means that there are some continuing members each month. My own research shows it to be helpful in tracking both spending and employment. Regular readers know that I love the Doug Short chart, which clearly illustrates the economic relationships. As always, his posts have plenty of extra analysis and charts, so please check it out.

dshort michigan sentiment

The Bad

The bad news included some significant economic reports.

  • Greek elections. To emphasize, I am not interested in the politics nor am I advocating particular policies. There is a simple test: Is this market-friendly news. The Syriza success increased uncertainty for the Eurozone. When the new coalition took a hard line about austerity and negotiating with “the troika” it opened the door to speculation about broader effects. (FT).
  • China’s PMI fell to 49.8, worse than the expected 50.2. This was the “official” version instead of the “flash” version. It was the “factory” PMI, not the “manufacturing” PMI. There are different data points and series for each. Make of it what you will. Someone needs to sort these out and provide some better guidance on interpretation. (Reuters).
  • Ukraine fighting. Violence increased during the week. While popular with the public, Putin is coming under some pressure from wealthy friends. (Bloomberg) This might eventually be a positive if it sparks a move toward compromise, but so far it has just increased reciprocal sanctions. Russia credit downgrade (WSJ). Excellent analysis from Thomas Friedman – both motivations and what might happen. Could Russia use HFT to crash the markets? (MarketWatch).
  • The Fed Announcement. For experienced Fed watchers focused on economic data, this seemed like a non-event. Why did stocks decline and bonds rally? You need to read this interesting interpretation from Brian Kelly, one of the Fast Money gang, to get the trader take. It seems to warn us that many are ready to react to a small change in timing of the first 25 bps increase in short-term rates. (Contra – WSJ). Bespoke sees no change, providing this analysis and chart:

Countdown to Liftoff 0130151

  • Durable goods declined by 3.4%, significantly worse than expectations. Steven Hansen at GEI has full analysis and this chart:

5112191ztemp

  • Pending home sales fell by 3.7%, month-over month.
  • Q4 GDP missed expectations, growing at a 2.6% rate instead of forecasts of 3% or higher. The general media reaction emphasized reduced business investment and international concerns (WSJ). Calculated Risk says to “R-E-L-A-X” and notes the increase in consumer spending and private fixed investment. James Hamilton at Econbrowser calls the report “solid” and updates his recession indicator (1.6%). The market reaction was slightly negative, and the story has markets on edge concerning upcoming data, so I am scoring this miss as “bad news.”

The Ugly

ISIS. We always have compassion for the human effects of conflict. We must also recognize the economic effects. The spread of fighting to Kirkuk shows how sensitive oil markets are to supply disruptions. Futures spiked 8% in a few minutes. Stocks sold off sharply.

The Silver Bullet

I occasionally give the Silver Bullet award to someone who takes up an unpopular or thankless cause, doing the real work to demonstrate the facts.  Think of The Lone Ranger. No award this week, but nominations are welcome. I am seeing plenty of bad charts, but little refutation.

Quant Corner

Whether a trader or an investor, you need to understand risk. I monitor many quantitative reports and highlight the best methods in this weekly update. For more information on each source, check here.

Recent Expert Commentary on Recession Odds and Market Trends

Bob Dieli does a monthly update (subscription required) after the employment report and also a monthly overview analysis. He follows many concurrent indicators to supplement our featured “C Score.”

RecessionAlert: A variety of strong quantitative indicators for both economic and market analysis. While we feature the recession analysis, Dwaine also has a number of interesting market indicators.

Doug Short: An update of the regular ECRI analysis with a good history, commentary, detailed analysis and charts. If you are still listening to the ECRI (three years after their recession call), you should be reading this carefully. Doug has the latest interviews as well as discussion. Also see Doug’s Big Four summary of key indicators.

Georg Vrba: has developed an array of interesting systems. Check out his site for the full story. We especially like his unemployment rate recession indicator, confirming that there is no recession signal. Georg continues to develop new tools for market analysis and timing. Some investors will be interested in his recommendations for dynamic asset allocation of Vanguard funds. Georg has a new method for TIAA-CREF asset allocation. He has added a method for Vanguard Dividend Growth Funds. I am following his results and methods with great interest. You should, too. Georg’s update this week was his BCI index, also showing very low recession changes.

Despite the facts, the average fund manager or trader views oil prices as a recession signal. (MarketWatch)

Dana Lyons notes, without really recommending this indicator, notes that the Baltic Dry Index is at a 30-year low. I dumped this indicator years ago when it seemed to reflect supply from Greek shipping magnates more than actual shipping and demand. Perhaps aluminum is better. (WSJ).

This is a subject where many authors begin with a viewpoint….

The Week Ahead

It is a big week for economic data.

The “A List” includes the following:

  • Employment report (F). Despite the revisions and large error band, this remains the focus of the economic debate.
  • Initial jobless claims (Th). The best concurrent news on employment trends, with emphasis on job losses.
  • ISM Index (M). Good concurrent read on manufacturing with some leading components.
  • ADP employment report (W). Deserves credit as an independent measurement.
  • Personal income and spending (M). December data, but especially important given last week’s GDP news.

The “B List” includes the following:

  • ISM services index (M). Bigger sector than manufacturing, but still not as much significance.
  • Trade balance (Th). December numbers will affect Q4 GDP revisions.
  • Auto sales (T). Good read on consumers. Will the F150 indicator start to be relevant again?
  • Crude oil inventories (W). Maintains recent interest and importance.
  • Productivity and unit labor costs (Th). Indicator of the pressure (or lack thereof) on the Fed’s patience in raising rates.
  • PCE prices (M). The Fed’s favorite inflation measure will become more important when the core approaches 2.5%
  • Construction spending (M). December data makes it a bit less relevant, but still significant.

With the FOMC announcement out of the way, your favorite Fed speaker is back on the speech circuit!

Important corporate earnings continue. There is always the chance of breaking news from various hot spots, but this week seems to have more such potential than usual.

How to Use the Weekly Data Updates

In the WTWA series I try to share what I am thinking as I prepare for the coming week. I write each post as if I were speaking directly to one of my clients. Each client is different, so I have five different programs ranging from very conservative bond ladders to very aggressive trading programs. It is not a “one size fits all” approach.

To get the maximum benefit from my updates you need to have a self-assessment of your objectives. Are you most interested in preserving wealth? Or like most of us, do you still need to create wealth? How much risk is right for your temperament and circumstances?

My weekly insights often suggest a different course of action depending upon your objectives and time frames. They also accurately describe what I am doing in the programs I manage.

Insight for Traders

Felix continues a “neutral” posture for the three-week market forecast, but it continues to be a close call. The data have improved a bit, but are still marginally neutral. There is still plenty of uncertainty reflected by the high (but declining) percentage of sectors in the penalty box. Our current position is still fully invested in three leading sectors, but these still include some defensive themes. This helped us dodge most of last week’s decline. For more information, I have posted a further description — Meet Felix and Oscar. You can sign up for Felix’s weekly ratings updates via email to etf at newarc dot com.

Another 8-Step guide for traders, this time from Steve Burns. Some advice will be familiar. I like “Hold your opinions loosely and your discipline tightly.”

As I have noted for four weeks, Felix continues to feature selected energy holdings. Felix is not just a momentum trader!

Insight for Investors

I review the themes here each week and refresh when needed. For investors, as we would expect, the key ideas may stay on the list longer than the updates for traders. Major market declines occur after business cycle peaks, sparked by severely declining earnings. Our methods are focused on limiting this risk. We have recently updated our current ideas for investors.

Other Advice

Here is our collection of great investor advice for this week:

Getting the Right Take on QE

Former Dallas Fed President, whom I admire from his writing and appearances, and like from our personal conversations, does not get enough credit. He is a pragmatic conservative and not a knee-jerk defender of the Fed. Anyone who really wants to understand the inner operations at the Fed would do well to read McTeer.

With the focus on worldwide QE, Bob asks, Are All QE’s the Same? Here is a key quote:

The fact is that the Fed’s QE programs didn’t work as expected, and it took huge bond purchases to achieve modest to moderate results. Like the rider of a very low-geared bicycle, the Fed had to peddle furiously to keep the bike upright. But, at least, the expected harm was not done and some good was done.

When short-term interest rates reached effective zero and we found ourselves in a Keynesian liquidity trap where more money would not reduce interest rates farther, there was every reason to believe that significant bond purchases would stimulate the economy by increasing the “quantity” of money and credit. We learned in school, and from past experience, that asset purchases by the central bank would increase bank reserves and the money supply initially by the same amount and that the excess reserves created in the banking system would result in a further multiple expansion in the retail money supply. Banks would use their new reserves to create new money by lending their newly created excess reserves. With about a 10 percent reserve requirement, the money multiplier would be around 10.
That didn’t happen.

You could also check out my article collection on this topic, which has been quite accurate, beating down the nay-sayers since 2010.

Stock Ideas

Barron’s has the last segment of their annual roundtable. You can see plenty of divergent opinion for a small investment. I enjoy reading it with some for entertainment and others for ideas.

Beware of the reach for yield – the crowded trade that worked last year. Well it also worked in January, making me wrong so far in 2015!

Cheap Sectors

Energy and Consumer discretionary, via Alpha Architect. This is consistent with many other value sources, despite the current market love affair with utilities and bonds.

cheap

Caution in energy? That seems to be the standard take. Here is the CNBC advice, which is OK both for initiating and adding to positions.

Market Outlook

Financial media follows the theme of the moment. It was the week for the bears, back in vogue according to CNNMoney.

The bears build their case that a crisis is near on four factors: falling oil prices, stagnant wages, the “two-edged sword” of a strong US dollar and big trouble abroad.

David Rosenberg is not bearish, but highlights “8 Things Giving Investors Angst.” My own effort to consolidate material on the ongoing investor fears is a work in progress. Topics and suggestions are welcome.

Scott Grannis has the contra viewpoint, seeing the “wall of worry” as typical. (See also my own Dow 20K/Wall of Worry Analysis).

Walls of worry

Final Thought

Every time the market makes a slight decline, some investors panic. This comes from two sources:

  1. Failing to separate the major market themes – recessions, financial crises, big earnings declines – from the routine noise;
  2. Failure to understand the normal market drawdowns, which have actually been quite mild over the last few years. Doug Short has a great chart:

SPX-drawdowns

The modest downward blips send investors on a quest to become traders. They enter a world of charts, indicators, stop loss rules, and frequent adjustments. There are many successful traders, but the odds are challenging. It requires system, discipline, and constant attention – and that is just for starters. Michael Batnick has a good post for both traders and investors, and the right perspective for each. Should you be selling stocks now?

An investment perspective is much better for most. Sticking with fundamental factors, you accept the trading gyrations as opportunities to buy or to sell businesses based upon your own underlying valuations and price targets. If you have some stocks you are watching, you get exceptional buying opportunities when short-term traders are fearful. My new “Investor Fear” page takes a look at the list of oft-repeated concerns.

There are no shortcuts to successful investing.

Unless you have some magic formula. Which team are investors supposed to be cheering for in the Super Bowl?

See the original article >>

Greek Opening Gambit

by Pater Tenebrarum

Greece Gains Vastly in Entertainment Value

As we always point out in these pages, the best one can as a rule hope for in a politician is that he will provide us with entertainment. Syriza chief and new Greek prime minister Alexis Tsipras and his ministers have certainly exhibited far greater entertainment value so far than their rather dull predecessors.

Within hours of taking up his post, Alexis Tsipras issued a number of zingers in the general direction of Brussels. First it was widely reported that he threatened not to support new EU sanctions against Russia, the imposition of which requires unanimity. It was then said that the Greek government quickly withdrew its opposition after consulting with the rest of the EU. However, the real story seems to be that Tsipras was simply miffed that the EU claimed that there was unanimous support for the sanctions package without deigning to even ask the new Greek government whether it agreed.

Yanis Varoufakis

Yanis Varoufakis, Greece’s new minister of finance.

Photo credit: Kostas Tsironis / Reuters

As an aside to this, people have wondered why Russia has offered financial support to Greece; the conclusion is usually that Russia is trying to gain allies in the EU so as to break the sanctions consensus. This is of course true, but there is more to this than meets the eye. Greece and Russia are traditionally on friendly terms because the Orthodox faith is the main religion in both countries. The same connection exists also between Serbia and Russia and it could also be one of the reasons why a number of Russian oligarchs had money parked in Cypriot banks.

The first negotiation gambit has been initiated today, with Greece’s new finance minister Yanis Varoufakis telling the EU’s Jeroen Dijsselbloem (of “bail-in” fame) that the “troika” and its bailout packages are no longer welcome in Greece:

“The new leftwing government in Athens opened negotiations on its bailout package with European partners on Friday by flatly rejecting the expected extension of the program and the international inspectors overseeing it.
Finance Minister Yanis Varoufakis met Jeroen Dijsselbloem, head of the euro zone finance ministers’ group, in Athens for what both described as “constructive” discussions on the new government’s aims.
But the hour-long meeting appeared to do nothing to bridge the gap between Prime Minister Alexis Tsipras’ government and European partners who have insisted that Greece must respect its obligations under the 240-billion-euro bailout.
The meeting with Dijsselbloem was the first in a series for Varoufakis, who travels to London, Paris and Rome next week as the government looks to build support.
Tsipras, who makes his first foreign visit as prime minister to Cyprus on Monday, will also be in Rome on Tuesday for meetings with Italian Prime Minister Matteo Renzi, one of the leading voices in Europe against strict budget austerity.
But he said Greece had no intention of cooperating with a mission from the “troika” of European and International Monetary Fund lenders and would not be seeking an extension to a Feb. 28 deadline with euro zone lenders.
“This platform enabled us to win the confidence of the Greek people,” he told reporters after the meeting. “Our first action as a government will not be to reject the rationale of questioning this program through a request to extend it.”


As Mish has recently reported, Alexis Tsipras wrote an open letter to Germany prior to the election, which doesn’t contain a single word one can disagree with. The gist of it is that the EU decided to adopt an “extend and pretend” scheme with Greece that ended up saddling an already insolvent government with even more debt, a truly grotesque situation. Mr. Varoufakis espouses the same viewpoint as Tsipras on the matter, which is essentially: Greece should never have taken the money in the first place, but should have insisted on a proper debt restructuring instead – i.e., the insolvency should have been acknowledged, and unsound debt should have been written off. In his own words:

“Europe in its infinite wisdom decided to deal with this bankruptcy by loading the largest loan in human history on the weakest of shoulders, the Greek taxpayer. What we’ve been having ever since is a kind of fiscal waterboarding that has turned this nation into a debt colony.”

A recent interview of Varoufakis with Channel 4 can be seen here. In this interview he promises to take on the “Greek oligarchy”, but it seems that the government is already backtracking a bit, at least with respect to Greece’s shipping tycoons, who enjoy special tax breaks. This reflects merely economic realities though: Greece can gain nothing by attempting to go after the money of shipping magnates. They can relocate very easily, as their assets are floating on the sea. Their industry produces 7% of Greece’s GDP, so going after them would be tantamount to slaying the goose that lays the golden eggs. Still, it is refreshing to learn that the new government recognizes such economic realities.

Surprisingly, although Varoufakis is these days finance minister in a left-wing government, you can find him talking among other things about Hayek, Mises and the spontaneous order of the market economy at the Library of Economics and Liberty. Vanoufakis once worked for Valve, the video game company that developed “Steam”. Apparently the company applies Hayekian principles in its structure, by eschewing the usual corporate hierarchy.

The problem as we see it is not Syriza’s opposition to the bailout deal –  the problem is that it also proposes economic measures that will destroy the not inconsiderable gains the country has achieved in terms of increasing its competitiveness. Among these measures are plans like rehiring 12,000 civil servants (the Greek State is notoriously inefficient and corrupt, and in dire need of slimming down), abandoning privatizations and raising minimum wages. In fact, the Greek economy does show some signs of life lately and would probably improve greatly if structural reforms were continued.

Mexican Standoff Continues

The problem with the proposed debt negotiations is that the other EU members continue to categorically rule out debt forgiveness. As the deadline of the meeting with the troika that was scheduled for the end of February looms, the question becomes therefore who will blink first. Germany let it be known that it is not amused:

“The discussion about a debt cut or a debt conference is divorced from reality,” Martin Jaeger, a German finance ministry spokesman, said in Berlin. Jaeger said Greece was obliged to abide by the terms of its 240 billion euro ($270 billion) bailout program agreed by previous governments or endanger the deal.
Without the rescue loans from its fellow eurozone countries and the International Monetary Fund, Greece would go bankrupt.
“If the measures announced by the new government in Athens were implemented, then one has to ask whether the basis of the program wouldn’t be called into question and therefore pointless,” he said.


In short, nothing has changed yet in terms of the Mexican standoff we have previously discussed. The main problem from Greece’s perspective is that euro membership could well become impossible if no agreement is reached in time. All that is needed for Greece to be effectively kicked out of the euro area is for the ECB to refuse the granting of ELA (emergency liquidity assistance) to Greek banks. Greece’s national bank could well attempt to extend ELA on its own without permission, which would lead to an interesting situation, to say the least. A Greek government default would immediately bankrupt the country’s banking system – for the second time.

Private holders of Greek securities are definitely spooked. Since Syriza has come to power, three year government bond yields have nearly doubled. Similar to the heyday of the sovereign debt crisis, short term yields are rising much more then long term ones, leaving the yield curve in a steep inversion (10 year yields are  “only” at 11.55%).

Greece 3-Year Bond Yield(Daily)

Greece’s 3 year government bond yield – bondholders are spooked and selling into what appears to be a no-bid market.

The Athens General Index meanwhile is approaching the lows made in 2012 at the secondary peak of the debt crisis, erasing most of the sizable gains that were recorded between 2012 and early 2014:

ATG

Athens General Index, weekly – click to enlarge.

This could well mean that a very good buying opportunity is close at hand, not least because the market is down even more in US dollar terms, thanks to the euro getting mauled on account of the ECB’s ultra-loose monetary policy.

GREK

GREK – a US listed ETF that contains the 20 largest Greek stocks by market cap – click to enlarge.

Unfortunately for bottom fishers, there is the problem that if Greece is indeed  pushed out of the euro area, the new currency would likely quickly lose a lot of ground as well. There would probably be a strong rise in stocks in local currency terms, but for foreign investors it may not amount to much. The danger of hyperinflation would likely come into view as well.

Nevertheless, this is precisely the kind of situation that should be of great interest to contrarians. One of the things one can always try given the uncertain outcome is a bet that involves only a very small outlay, such as e.g. buying out of the money call options. In the worst case, one might lose the entire sum invested, but the payoff could be huge if things turn out well. In addition, should push come to shove and Greece be forced to abandon the euro, one can still take another look at Greek assets once the dust has settled.

Conclusion:

So far, Syriza doesn’t disappoint in terms of making the European political landscape a lot more entertaining. In the process, it may actually be creating a few interesting opportunities for alert and adventurous contrarian investors, although some patience is probably still required. Syriza is not a monolithic organization, but it does have a very strong far-left wing, so we remain quite skeptical about its plans with respect to economic policy. Surprises are definitely possible in the realm of politics though, and it happens actually fairly frequently that those who are thought least likely to implement meaningful reform end up doing just that.

Tourists stand near the temple of Parthenon atop the ancient site of the Athens Acropolis on a cold and windy day

The Parthenon – a crumbling leftover from antiquity that has become a metaphor for the state the country has been in over recent years.

See the original article >>

Stock Market Major 4 or Primary IV Wave

By: Tony_Caldaro

Gap openings continued to be the theme for January with four more this week, and 15 in 20 trading days. The market started the week at SPX 2052, bounced to 2058 on Monday, declined by Thursday to 1989, bounced, and then ended the week at 1995. For the week the SPX/DOW were -2.85%, the NDX/NAZ were -2.90%, and the DJ World index was -1.65%. On the economic front reports came in even. On the uptick: consumer confidence, new home sales, the Chicago PMI, the WLEI, and weekly jobless claims improved. On the downtick: durable goods, Case-Shiller, pending home sales, consumer sentiment and the GDP declined. Next week’s economic reports will be highlighted by Payrolls, ISM and the PCE.

LONG TERM: bull market

It has been one week since the ECB announced their 1.14tn euro EQE program, and apparently the market has responded with: “buy the rumor-sell the news”. With the exception of last week, the US market has been down every week this month. Despite a four of five week decline, the market has only lost 4.5% since the last week of December.

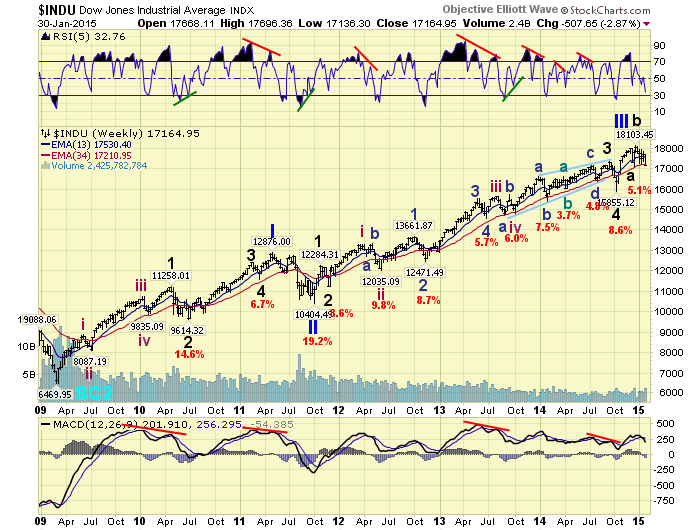
With the month of January now in the books, and no new highs, our next long term price projection remains on hold. While our long term indicators suggest we have not even reached a Primary wave III high for this market, let alone a bull market high. We think it is prudent to at least entertain the Primary III count. History has shown that no indicators are perfect, and this market has been full of surprises since it began in 2009. With this in mind we have updated the DOW charts to display a potential Primary III completed at the early December high. Then we have a Major wave a down into the mid-December low, followed by an irregular Major wave b into the late-December high, with now Major c underway. Should this count prove to be correct, which we give a 20% probability, we would expect this downtrend to take the DOW to at the least the October low at 15,855.

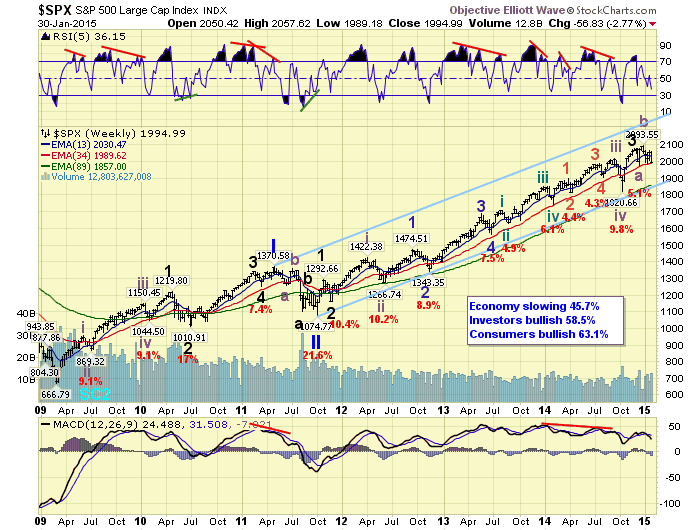
Our main count, with a 70% probability, is still carried on the SPX/NDX charts. This count suggests Primary III is still unfolding, and the market is currently downtrending in Major wave 4. When the downtrend concludes, a simple or subdividing Major wave 5 should take the market to all time new highs. Then after a Primary III high, a Primary IV correction will occur before Primary V takes the market yet again to new highs. This count also suggests this market has much further to go on the upside before the bull market concludes.

MEDIUM TERM: downtrend

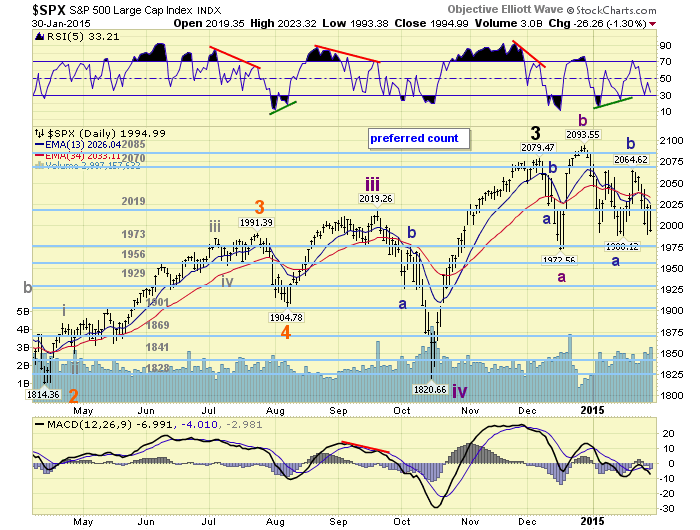
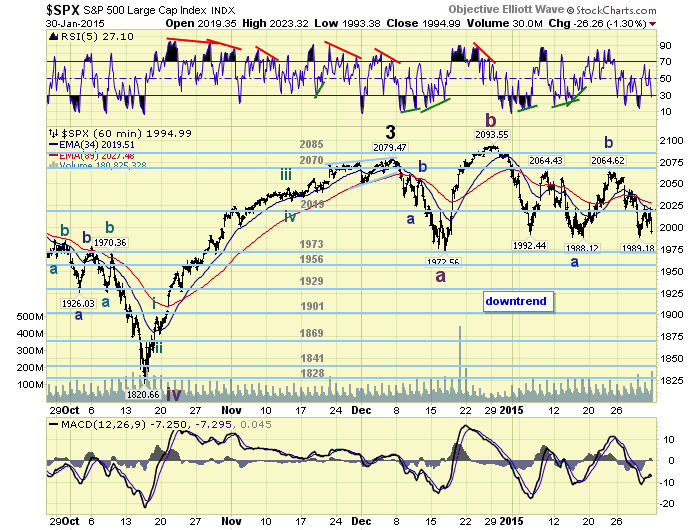
For the past few weeks we waited patiently while this market decided to continue the recent uptrend, or stall and confirm a downtrend. As the market traded between SPX 1988 and 2065 during the month, we had determined 2029 would be the deciding level. Holding above it would suggest the uptrend would continue. A drop below, a downtrend has been underway. On Tuesday of this week the SPX traded down to 2020 in the first hour of trading, suggesting a downtrend has been underway. After the low the market rallied to SPX 2043, before retesting its month long support around 1988/1992 on Thursday/Friday.

We are now counting all the activity from the early December SPX 2079 high as part of Major wave 4. With the NDX has remaining in a downtrend since that point in time, this count looks the most probable. We have been carrying this count on the SPX daily chart. This suggests the mid-December decline to SPX 1973 was Int. wave a, the rally to new highs by late-December was Int. b, and Int. wave c has been underway since then. Intermediate wave a was a simple double zigzag and it declined 106 points (2079-1973). After the Intermediate wave b uptrend, the initial decline of Intermediate wave c was also 106 points (2094-1988). We have labeled that Minor wave a, of a three Minor wave Intermediate c. The rally that followed to SPX 2065 we have labeled Minor wave b. And, the current decline from that level is an ongoing Minor wave c. When it concludes, possibly this week, Major wave 4 should end and Major wave 5 to new highs should begin. Medium term support is at the 1973 and 1956 pivots, with resistance at the 2019 and 2070 pivots.

SHORT TERM

Major wave corrections, and Intermediate waves for that matter, have declined about 10% during this bull market. A normal 10% correction would suggest a low around the OEW 1869 pivot. This is easy to spot in the weekly chart above. Since this is an irregular correction we are suggesting it may deviate from this norm, while allowing for alternation with the zigzag of Major wave 2. With Int. wave A declining 106 points, and Minor a of Int. wave C also declining 106 points we have some Fibonacci relationships worth watching.

If Major 4 is forming an irregular flat it should find support around the 1973 pivot. If it is forming a more complex three wave pattern we can next look for support around the 1956 pivot, where Minor c equals Minor a. A more complex Int. wave C would suggest support around the 1929 pivot, where Int. C equals 1.618 Int. A. So we have the next three pivots: 1973, 1956 and 1929, with a worse case 1869 pivot concluding some time in February. Our initial thoughts would be for a 1973 or 1956 pivot low some time next week. Should the market reach one of those levels and is sufficiently oversold. We would then expect a five wave rally off that low to suggest a new uptrend is underway. Short term support is at SPX 1988/1993 and the 1973 pivot, with resistance at the 2019 pivot and SPX 2042/2043. Short term momentum ended the week oversold.

See the original article >>
SPY Trends and Influencers January 31, 2015

by Greg Harmon

Last week’s review of the macro market indicators suggested, heading into the last week of January, that the equity markets were churning, but at different paces. Elsewhere looked for Gold ($GLD) to continue in its uptrend while Crude Oil ($USO) continued lower. The US Dollar Index ($UUP) also looked to continue higher while US Treasuries ($TLT) consolidated in the uptrend. The Shanghai Composite ($ASHR) was taking a breather in its uptrend but Emerging Markets ($EEM) were breaking higher, at least in the short term.

Volatility ($VXX) looked to remain low but drifting gently higher over time slowing the wind at the back of the equity market. The equity index ETF’s were reacting differently to these factors. The $IWM was continuing its consolidation but with signs it may break higher, while the $SPY consolidated in its uptrend, perhaps passing the baton to the small caps. The $QQQ was been acting mostly like the SPY but looked much stronger, with a possible break of a bull flag higher brewing.

The week played out with Gold finding resistance at 1300 again and pulling back while Crude Oil continued to leak lower until a massive rebounded late in the week. The US Dollar consolidated its move until late in the week it moved back higher higher while Treasuries made a new all-time high.

The Shanghai Composite tested resistance again and pulled back slightly while Emerging Markets held higher over support early only to give it up at the end of the week. Volatility moved back higher ending the week at the highs, but below the prior high. The Equity Index ETF’s all pulled back in their recent consolidation zones, leaving Monday as the high of the week.

What does this mean for the coming week? Lets look at some charts.

SPY Daily, $SPY
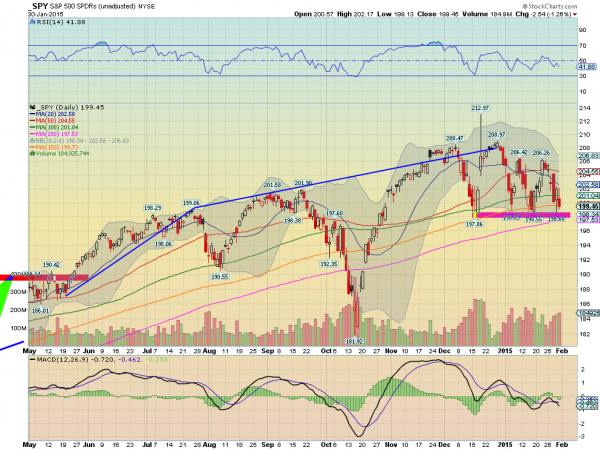
spy d

The SPY started the week holding over the 50 day SMA Monday but it was downhill from there. By Tuesday it broke below the 50 and 20 day SMA’s and printed a Spinning Top doji. This signals indecision and can resolve either up or down. It decided for the downside with a strong move lower Wednesday. After only a modest bounce Thursday it fell again Friday to end the week near the lows. It did hold the recent support zone that has been in place since mid December. The RSI on the daily chart is testing the 40 level again while the MACD has crossed down. The risk is to the downside on this timeframe.

SPY Weekly, $SPY
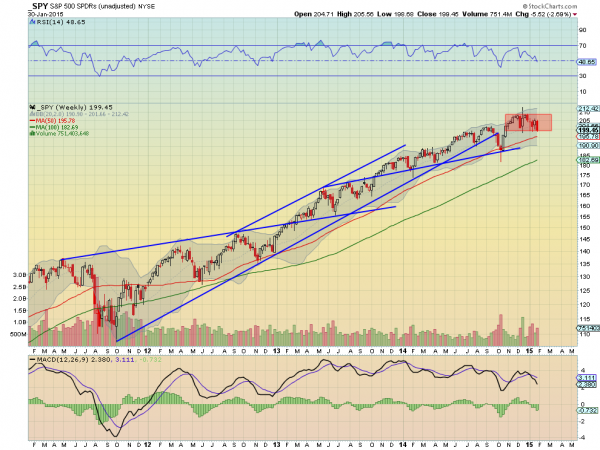
spy w

On the weekly chart the range since October remains in control with the 50 week SMA fast approaching. The RSI on this timeframe is about to cross down through the mid line while the MACD is running lower. More risk of downside on this timeframe as well. There is support lower at 198.60 and 196.60 followed by 194.40 and 191. Resistance higher may come at 200 and 202.30 followed by 204.30 and 205.70. Consolidation with a Chance of Pullback in the Uptrend.

Heading into February the equity markets look biased to the downside to start the month. Elsewhere look for Gold to continue to consolidate in the short term uptrend while Crude Oil may be ready for a bounce or reversal in the downtrend. The US Dollar Index seems ready to consolidate sideways in the uptrend while US Treasuries continue to be biased higher. The Shanghai Composite is also consolidating in its uptrend while Emerging Markets look to have failed in their attempt to rally and are biased to the downside.

Volatility looks to remain low but drifting up easing the wind behind the equity markets to a light breeze. The equity index ETF’s SPY, IWM and QQQ, all see risk to the downside in both the daily and weekly charts with the QQQ the strongest on the longer timeframe followed by the IWM and then the SPY, but the IWM possibly a bit stronger on the short timeframe over both the QQQ and SPY. Use this information as you prepare for the coming week and trad’em well.

See the original article >>
Follow Us