By: Nadia_Simmons
In our previous Oil Update we examined major factors, which previously fueled the price of light crude. Before we move on to the technical part of our Oil Update, let’s take a closer look at the events of the previous week.
At the beginning of the last week President Barack Obama won the backing of key figures in the U.S. Congress, including Republicans, in his call for limited strikes on Syria. Additionally, a missile test by Israeli forces training in the Mediterranean with the U.S. Navy set nerves on edge. These circumstances fueled the oil market and resulted in a sharp pullback to over $108 per barrel. In spite of this growth, in the following days, the price of light crude was trading in the narrow range between the Tuesday’s low and top.
Looking at the chart of crude oil, we can conclude that investors came back to focusing on economic data, because further improvement in the U.S. labor market is the key for the Fed to begin scaling back its $85 billion a month of bond purchase. Friday's data showed that U.S. employers hired fewer workers than expected in August and the jobless rate hit a 4 and a half year low as Americans gave up the search for work.
The weaker-than-expected U.S. payroll numbers for August raised doubts about whether the Federal Reserve will start paring its massive stimulus and resulted in higher prices of light crude.
Another factor, which fueled the price of light crude was the G20 summit in St. Petersburg. According to Reuters, crude oil rose 2% after President Obama told, that failure to act against Syria's use of chemical weapons would embolden "rogue nations" to use them too. The U.S. President has faced growing pressure from Russia, China, the European Union and major emerging market countries not to carry out a strike without support from the U.N. Security Council. Taking the above into account, there are concerns about how the crisis could affect relations between Washington and Russia and China.
In spite of this, the main worry now is that Iran, an ally of Damascus, could get involved if the United States goes ahead with attacking Syria. In this case, the entire region could become inflamed yet further, causing major oil supply problems.
What impact did these circumstances have on light crude? Crude oil climbed above $110 per barrel. This is a largest weekly percentage gain in two months, at 2.7%, the highest since July 5. It is also the largest daily percentage gain since August 27.
Keeping in mind these factors and their impact on the price of light crude, let’s now move on to the technical part of our Oil Update. Just like a week ago, we take a look at the charts from different time perspectives to have a more complete picture of the current situation in the oil market.
Let’s start with a look at the monthly chart of light crude (charts courtesy by http://stockcharts.com).
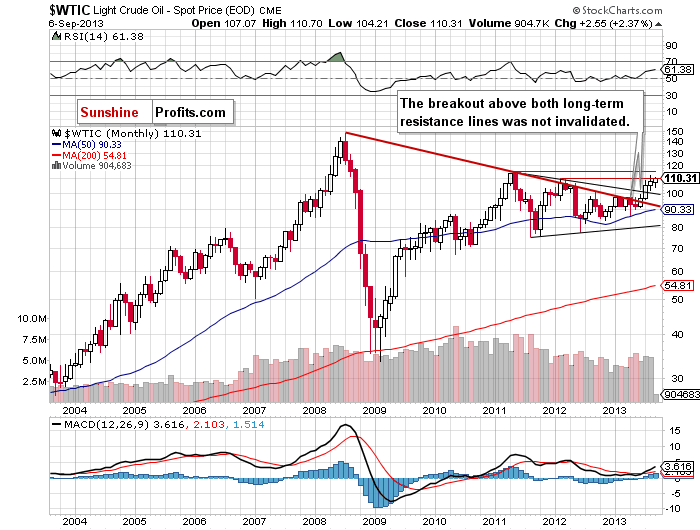
Looking at the above chart, we see that the situation hasn’t changed much.
Quoting our last Oil Update:
(…) light crude still remains above the two long-term declining resistance lines: one of them (bold red line) is based on the July 2008 and the May 2011 highs, and the second one is based on the September 2012 and March 2013 highs (the upper black line).
From this perspective the picture is bullish and the breakout above these two long-term declining resistance lines hasn’t been invalidated.
Now, let’s zoom in on our picture of the oil market and see the weekly chart.
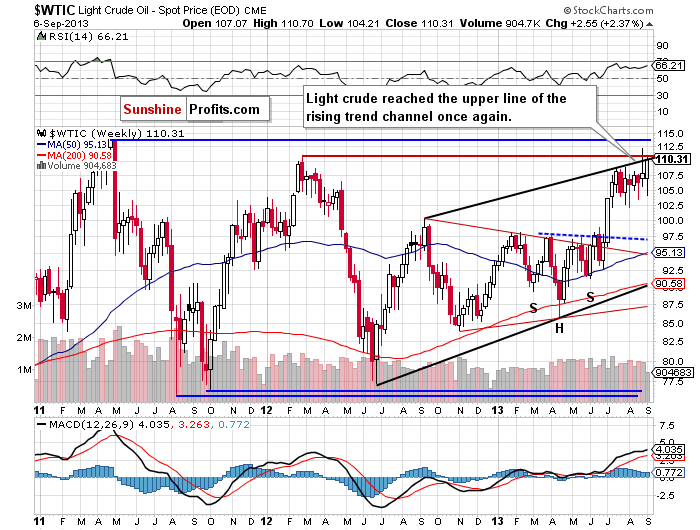
On the above chart, we see that the situation has improved recently. Although the price of light crude dropped below $105 per barrel at the beginning of the previous week, oil bulls didn’t give up and pushed it higher in the following days. In this way crude oil reached the strong resistance zone based on the March 2012 top and the upper border of the rising trend channel once again.
Taking the above into account, we should consider two scenarios. If the buyers manage to break above this strong resistance zone, the first price target will be close to the May 2011 top. However, if they fail, history will likely repeat itself and the price of light crude will come back to the consolidation range. In this case, the first price target for sellers will be around $105 per barrel.
From this point of view, the outlook is still more bullish than not at this time.
Now, let’s check the short-term outlook.
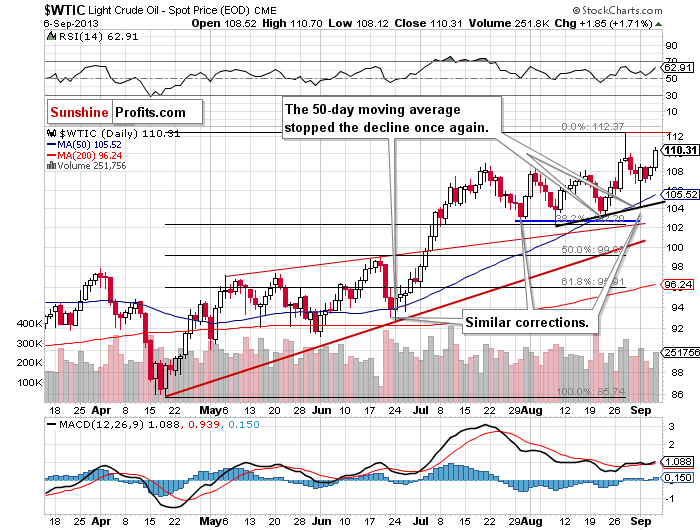
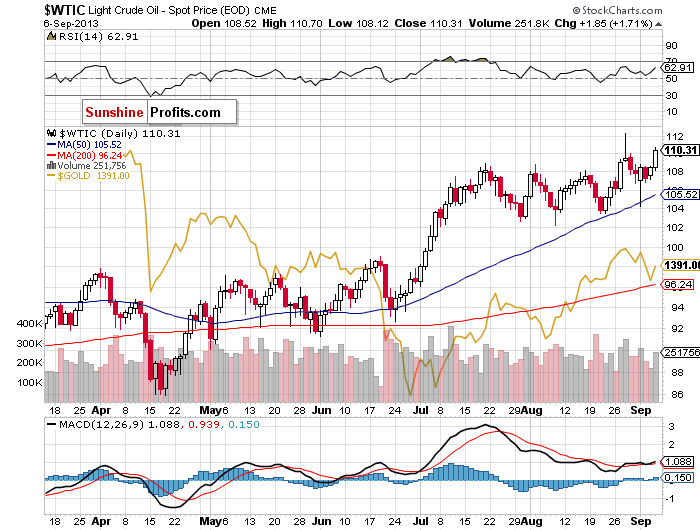
In this daily chart, we see that the situation has improved in the recent days. At the beginning of the previous week the price of light crude dropped below $105 and reached the rising support line based on the August 8 and August 21 lows (marked in black). It’s worth noting that this area was also supported by the 50-day moving average, which stopped the decline in June and, again, at the end of August (it was not even reached). In both previous cases this moving average encouraged buyers to act, which resulted in a sharp rally in the following days.
As you see on the above chart, we had a similar situation in the previous week. Light crude rebounded to over $110 per barrel and climbed above the March 2012 on an intraday basis, however, the breakout was not confirmed.
At this point it’s worth mentioning that the recent correction is shallow and similar to the previous ones, which is a bullish factor. Additionally, when we factor in the Fibonacci price retracements, we clearly see that the recent corrective move has been quite small because it hasn’t even reached the 38.2% level.
When we take a closer look at the above chart, we see that a consolidation has been formed in the recent days. On Friday, buyers managed to break above the Tuesday’s top, which (according to theory) should result in further growth and the price target for the pattern is below the May 2011 top (around $113.45).
Where are the nearest support levels? The first is the 50-day moving average (currently at $105.52). The second one is the rising line based on the August lows (slightly below $105). The third one is the Tuesday low at $104.21. The next one is a zone (between $102.22 and $103.50) based on the bottom of the previous corrective move (the August 21 low) and the August low. As you see, there is also the 38.2% Fibonacci retracement level, which reinforces this support zone.
Summing up, although there was a downward move, which took the price of light crude below $105, technically, the short-term outlook for light crude is still bullish. The uptrend is not threatened at the moment, because the recent decline was shallow and similar to the previous ones.
Once we know the current outlook for crude oil, let’s examine the NYSE Arca Oil Index (XOI) once again to find out what the current outlook for the oil sector is.
Let’s start with the long-term chart.
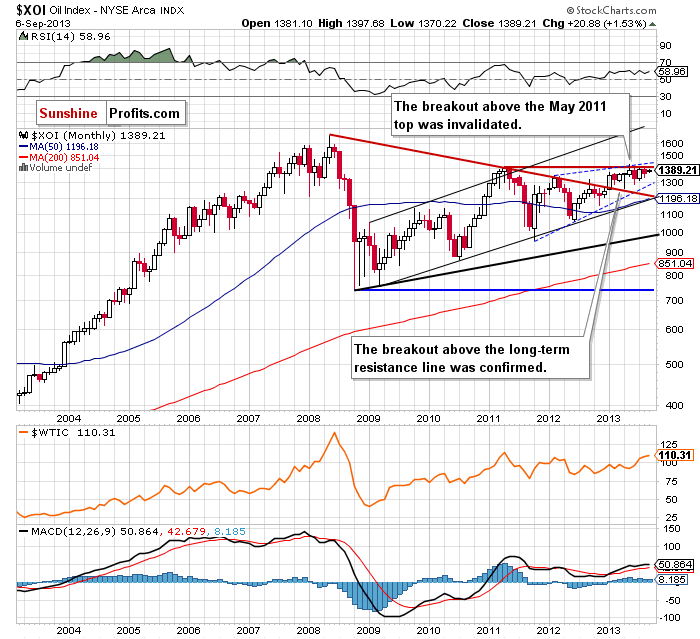
On the above chart, we see that the situation hasn’t changed much. We’ve been seeing a consolidation in the recent months and the NYSE Arca Oil Index is trading between the July top and the July low.
The XOI remains quite close to the May 2011 top and it’s still above the previously-broken long-term declining resistance line based on the 2008 and the 2011 highs and the breakout hasn’t been invalidated. The oil index also remains in the range of the rising trend channel.
Taking the abovementioned observations into account, the situation is still bullish.
Let’s take a closer look at the weekly chart.
Looking at the above chart, we see that most of what we wrote in our last Oil Update is up-to-date today.
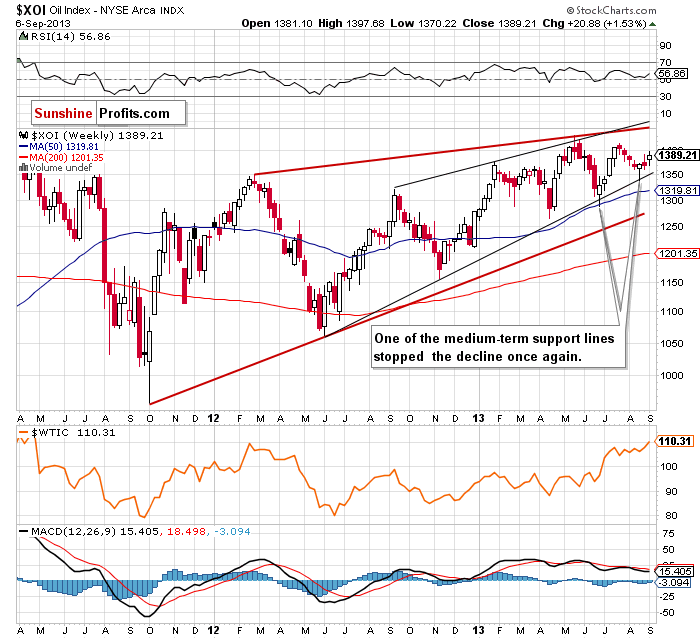
(…) the NYSE Arca Oil Index still remains above the medium-term support lines. Keep in mind that the strong support line (marked in black) stopped the decline in June, which resulted in a rally in the following weeks.
Please note that we should still keep an eye on the above-mentioned support line, because it is also the lower border of the rising wedge. As you know, this is a bearish pattern and if buyers fail, it will likely lead to a decline which may take the oil index at least to the lower medium-term support line (the red one).
The medium-term uptrend is not currently threatened, and the situation remains bullish.
What about the relationship between light crude and the oil stocks?
When we take a look at the above chart and compare weekly closing prices in both cases, it may seem that oil stocks were weaker in the previous week, because they didn’t reach a new local top in terms of weekly closes. As you see, light crude close the whole week above the closing level of February 21, 2012. However, it’s worth noting that the XOI climbed above this level at the end of January. Additionally, light crude still remains below the May 2011 top.
Now, let’s turn to the daily chart.
Quoting our last Oil Update:
(…) it’s worth noting that the XOI closed the previous week at the 50-day moving average, which still serves as support. If it holds, we may see a pullback to the Wednesday high.
As you see on the above chart, the 50-day moving average stopped further declines and encouraged oil bulls to push the oil index higher. In this way, the XOI came back above the 61.8% Fibonacci retracement level (based on the entire July-August decline) and closed the previous week slightly above the July 30 low (in terms of daily closing prices).
Please note that the next resistance level is the declining line based on the May and July highs (currently close to the 1,404 level). If it is broken, the buyers’ next target will be the July peak, and then the May top.
The nearest support is at the 50-day moving average (currently at 1,373.74). The next support zone is based on the August 27 and August 30 lows (1,361-1,364), and a further one is based on the August 21 bottom and the 61.8% retracement level (1,338-1,339).
On a side note, we’ll comment on the relationship between the WTI and the XOI in the short term. Despite the negative divergences at the beginning of the previous week, the second half looked pretty much the same in both cases and we saw increases.
Summing up, from the long and medium-term perspectives the outlook for oil stocks is still bullish and the uptrend is not threatened at the moment. Taking into account the relationship between light crude and the oil stocks, it seems that crude oil is still a step behind the oil index.
Speaking of relationships, let’s take a closer look at the chart below and check the link between crude oil and gold. Has it changed in the recent days? Let’s examine the daily chart.
In the last week of August we noticed that light crude hit its top a bit earlier and when we saw a downward move in oil, gold was still rising. However, after the yellow metal reached its highest level during Wednesday’s session, light crude accelerated its declines. In the following days both commodities continued to show weakness.
On the above chart we see that in both cases the buyers stopped the downward move on Tuesday. In the days following the sharp pullback, crude oil was trading in the narrow range between the Tuesday’s bottom and top. What’s interesting, at the same time gold declined once again. In other words, the consolidation in light crude triggered another move lower in gold. Despite the negative divergences, the last session of the previous week looked pretty much the same and in both cases we saw growths.
Taking the above into account, it’s worth taking a closer look at the medium-term outlook for gold.
Let’s turn to the weekly chart of the yellow metal.
In our last Oil Update we wrote:
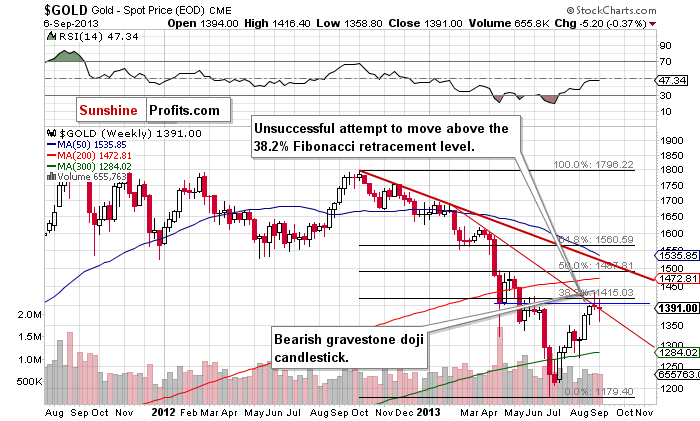
(…) gold (…) reached a strong resistance zone based on three important levels: the first of them is the June’s top; the second one is the April’s bottom (in terms of weekly closes); and the third one is the 38.2% Fibonacci retracement level based on the September 2012 - June 2013 decline.
As you see on the above chart, the yellow metal attempted to move above this resistance zone once again, but this try failed for the second time, and the breakout was invalidated.
The medium-term situation seems quite bearish and if gold drops below the declining resistance line based on the October 2012 and February highs the outlook will be even more bearish.
Summing up, taking the long and medium-term relationship between light crude and the oil stocks into account, it seems that the oil index is a step ahead of crude oil. If this assumption is true, in the nearest future we will likely see an upward move in crude oil to at least the May 2011 top. Looking at the relationship between crude oil and gold, we first noticed the negative divergence. As we previously wrote, the consolidation in light crude triggered a downward move in gold. Additionally, crude oil broke above the Tuesday’s top and approached the September top on Friday. Meanwhile, gold was trading significantly below the Tuesday peak, which is a bearish sign. Taking this into account and combining it with the current situation in the yellow metal, it seems that the acceleration of the downtrend in gold is still ahead of us. Connecting the dots, the short-term link between the yellow metal and crude oil may wane in the coming weeks.
Looking at the chart of crude oil, we can conclude that investors came back to focusing on economic data, because further improvement in the U.S. labor market is the key for the Fed to begin scaling back its $85 billion a month of bond purchase. Friday's data showed that U.S. employers hired fewer workers than expected in August and the jobless rate hit a 4 and a half year low as Americans gave up the search for work.
The weaker-than-expected U.S. payroll numbers for August raised doubts about whether the Federal Reserve will start paring its massive stimulus and resulted in higher prices of light crude.
Another factor, which fueled the price of light crude was the G20 summit in St. Petersburg. According to Reuters, crude oil rose 2% after President Obama told, that failure to act against Syria's use of chemical weapons would embolden "rogue nations" to use them too. The U.S. President has faced growing pressure from Russia, China, the European Union and major emerging market countries not to carry out a strike without support from the U.N. Security Council. Taking the above into account, there are concerns about how the crisis could affect relations between Washington and Russia and China.
In spite of this, the main worry now is that Iran, an ally of Damascus, could get involved if the United States goes ahead with attacking Syria. In this case, the entire region could become inflamed yet further, causing major oil supply problems.
What impact did these circumstances have on light crude? Crude oil climbed above $110 per barrel. This is a largest weekly percentage gain in two months, at 2.7%, the highest since July 5. It is also the largest daily percentage gain since August 27.
Keeping in mind these factors and their impact on the price of light crude, let’s now move on to the technical part of our Oil Update. Just like a week ago, we take a look at the charts from different time perspectives to have a more complete picture of the current situation in the oil market.
Let’s start with a look at the monthly chart of light crude (charts courtesy by http://stockcharts.com).
Looking at the above chart, we see that the situation hasn’t changed much.
Quoting our last Oil Update:
(…) light crude still remains above the two long-term declining resistance lines: one of them (bold red line) is based on the July 2008 and the May 2011 highs, and the second one is based on the September 2012 and March 2013 highs (the upper black line).
From this perspective the picture is bullish and the breakout above these two long-term declining resistance lines hasn’t been invalidated.
Now, let’s zoom in on our picture of the oil market and see the weekly chart.
On the above chart, we see that the situation has improved recently. Although the price of light crude dropped below $105 per barrel at the beginning of the previous week, oil bulls didn’t give up and pushed it higher in the following days. In this way crude oil reached the strong resistance zone based on the March 2012 top and the upper border of the rising trend channel once again.
Taking the above into account, we should consider two scenarios. If the buyers manage to break above this strong resistance zone, the first price target will be close to the May 2011 top. However, if they fail, history will likely repeat itself and the price of light crude will come back to the consolidation range. In this case, the first price target for sellers will be around $105 per barrel.
From this point of view, the outlook is still more bullish than not at this time.
Now, let’s check the short-term outlook.
In this daily chart, we see that the situation has improved in the recent days. At the beginning of the previous week the price of light crude dropped below $105 and reached the rising support line based on the August 8 and August 21 lows (marked in black). It’s worth noting that this area was also supported by the 50-day moving average, which stopped the decline in June and, again, at the end of August (it was not even reached). In both previous cases this moving average encouraged buyers to act, which resulted in a sharp rally in the following days.
As you see on the above chart, we had a similar situation in the previous week. Light crude rebounded to over $110 per barrel and climbed above the March 2012 on an intraday basis, however, the breakout was not confirmed.
At this point it’s worth mentioning that the recent correction is shallow and similar to the previous ones, which is a bullish factor. Additionally, when we factor in the Fibonacci price retracements, we clearly see that the recent corrective move has been quite small because it hasn’t even reached the 38.2% level.
When we take a closer look at the above chart, we see that a consolidation has been formed in the recent days. On Friday, buyers managed to break above the Tuesday’s top, which (according to theory) should result in further growth and the price target for the pattern is below the May 2011 top (around $113.45).
Where are the nearest support levels? The first is the 50-day moving average (currently at $105.52). The second one is the rising line based on the August lows (slightly below $105). The third one is the Tuesday low at $104.21. The next one is a zone (between $102.22 and $103.50) based on the bottom of the previous corrective move (the August 21 low) and the August low. As you see, there is also the 38.2% Fibonacci retracement level, which reinforces this support zone.
Summing up, although there was a downward move, which took the price of light crude below $105, technically, the short-term outlook for light crude is still bullish. The uptrend is not threatened at the moment, because the recent decline was shallow and similar to the previous ones.
Once we know the current outlook for crude oil, let’s examine the NYSE Arca Oil Index (XOI) once again to find out what the current outlook for the oil sector is.
Let’s start with the long-term chart.
On the above chart, we see that the situation hasn’t changed much. We’ve been seeing a consolidation in the recent months and the NYSE Arca Oil Index is trading between the July top and the July low.
The XOI remains quite close to the May 2011 top and it’s still above the previously-broken long-term declining resistance line based on the 2008 and the 2011 highs and the breakout hasn’t been invalidated. The oil index also remains in the range of the rising trend channel.
Taking the abovementioned observations into account, the situation is still bullish.
Let’s take a closer look at the weekly chart.
Looking at the above chart, we see that most of what we wrote in our last Oil Update is up-to-date today.
(…) the NYSE Arca Oil Index still remains above the medium-term support lines. Keep in mind that the strong support line (marked in black) stopped the decline in June, which resulted in a rally in the following weeks.
Please note that we should still keep an eye on the above-mentioned support line, because it is also the lower border of the rising wedge. As you know, this is a bearish pattern and if buyers fail, it will likely lead to a decline which may take the oil index at least to the lower medium-term support line (the red one).
The medium-term uptrend is not currently threatened, and the situation remains bullish.
What about the relationship between light crude and the oil stocks?
When we take a look at the above chart and compare weekly closing prices in both cases, it may seem that oil stocks were weaker in the previous week, because they didn’t reach a new local top in terms of weekly closes. As you see, light crude close the whole week above the closing level of February 21, 2012. However, it’s worth noting that the XOI climbed above this level at the end of January. Additionally, light crude still remains below the May 2011 top.
Now, let’s turn to the daily chart.
Quoting our last Oil Update:
(…) it’s worth noting that the XOI closed the previous week at the 50-day moving average, which still serves as support. If it holds, we may see a pullback to the Wednesday high.
As you see on the above chart, the 50-day moving average stopped further declines and encouraged oil bulls to push the oil index higher. In this way, the XOI came back above the 61.8% Fibonacci retracement level (based on the entire July-August decline) and closed the previous week slightly above the July 30 low (in terms of daily closing prices).
Please note that the next resistance level is the declining line based on the May and July highs (currently close to the 1,404 level). If it is broken, the buyers’ next target will be the July peak, and then the May top.
The nearest support is at the 50-day moving average (currently at 1,373.74). The next support zone is based on the August 27 and August 30 lows (1,361-1,364), and a further one is based on the August 21 bottom and the 61.8% retracement level (1,338-1,339).
On a side note, we’ll comment on the relationship between the WTI and the XOI in the short term. Despite the negative divergences at the beginning of the previous week, the second half looked pretty much the same in both cases and we saw increases.
Summing up, from the long and medium-term perspectives the outlook for oil stocks is still bullish and the uptrend is not threatened at the moment. Taking into account the relationship between light crude and the oil stocks, it seems that crude oil is still a step behind the oil index.
Speaking of relationships, let’s take a closer look at the chart below and check the link between crude oil and gold. Has it changed in the recent days? Let’s examine the daily chart.
In the last week of August we noticed that light crude hit its top a bit earlier and when we saw a downward move in oil, gold was still rising. However, after the yellow metal reached its highest level during Wednesday’s session, light crude accelerated its declines. In the following days both commodities continued to show weakness.
On the above chart we see that in both cases the buyers stopped the downward move on Tuesday. In the days following the sharp pullback, crude oil was trading in the narrow range between the Tuesday’s bottom and top. What’s interesting, at the same time gold declined once again. In other words, the consolidation in light crude triggered another move lower in gold. Despite the negative divergences, the last session of the previous week looked pretty much the same and in both cases we saw growths.
Taking the above into account, it’s worth taking a closer look at the medium-term outlook for gold.
Let’s turn to the weekly chart of the yellow metal.
In our last Oil Update we wrote:
(…) gold (…) reached a strong resistance zone based on three important levels: the first of them is the June’s top; the second one is the April’s bottom (in terms of weekly closes); and the third one is the 38.2% Fibonacci retracement level based on the September 2012 - June 2013 decline.
As you see on the above chart, the yellow metal attempted to move above this resistance zone once again, but this try failed for the second time, and the breakout was invalidated.
The medium-term situation seems quite bearish and if gold drops below the declining resistance line based on the October 2012 and February highs the outlook will be even more bearish.
Summing up, taking the long and medium-term relationship between light crude and the oil stocks into account, it seems that the oil index is a step ahead of crude oil. If this assumption is true, in the nearest future we will likely see an upward move in crude oil to at least the May 2011 top. Looking at the relationship between crude oil and gold, we first noticed the negative divergence. As we previously wrote, the consolidation in light crude triggered a downward move in gold. Additionally, crude oil broke above the Tuesday’s top and approached the September top on Friday. Meanwhile, gold was trading significantly below the Tuesday peak, which is a bearish sign. Taking this into account and combining it with the current situation in the yellow metal, it seems that the acceleration of the downtrend in gold is still ahead of us. Connecting the dots, the short-term link between the yellow metal and crude oil may wane in the coming weeks.
See the original article >>


