Tuesday, June 11, 2013

Record U.S. soybean crop seen extending bear market

By Jeff Wilson

U.S. soybean farmers are planting a record crop that’s poised to double domestic reserves and expand a global surplus after last year’s drought drove prices to an all-time high.

Stockpiles at the end of August 2014 will have gained 116% to 7.29 million metric tons in 12 months, according to the average of 30 analyst estimates compiled by Bloomberg. U.S. production will jump 12% to 91.74 million tons, adding almost enough extra supply to feed India for a year. The U.S. government updates its estimates tomorrow. Jefferies Bache LLC expects November futures traded in Chicago to plunge 26% to $9.88 a bushel by Oct. 1, when harvesting peaks.

Soybeans, which rose to a record $17.89 during the 2012 drought in the U.S., are now in a bear market along with corn and wheat. The surge from as low as $4.985 in 2005 spurred farmers worldwide to add acreage, increasing supply and keeping the $1.14 trillion global food-import bill in check. Producers in Brazil and Argentina reaped the most soy ever in early 2013, capping a 54% expansion in combined output in a decade.

“We are going from a barren cupboard to abundant supplies in a very short time,” said Dan Basse, the Chicago-based president of AgResource Co., which sells its agricultural research to clients in 81 countries. “Seven years of extremely high prices has spurred global production that will lead to several years of rising supplies and lower prices.”

Top Commodity

While soybeans are now 26% below the record reached in September, the cost of supply for delivery before the harvest has been rising. The July contract rose 10% since the end of April, the most among the 24 commodities tracked by the Standard & Poor’s GSCI Index, which slid 0.3%. The MSCI All-Country World Index of equities fell 1.5% and a Bank of America Corp. index showed Treasuries lost 2.3%.

July futures traded at a $2.08 premium to the November contract, up from $1.6375 on May 1. The gap may widen to $3 next month on prospects for a glut after harvests in the Northern Hemisphere, Basse said.

Global soybean production will jump 6.1% to a record 285.5 million tons this year, while demand rises 4.4% to 270.18 million, according to the U.S. Department of Agriculture, which updates its forecasts at noon tomorrow in Washington.

Brazil unseated the U.S. as the biggest grower in the last harvest, producing about 1.44 million tons more, USDA data show. That will reverse this season as rebounding U.S. output exceeds the 85 million tons that Brazilian farmers are forecast to collect in February, the USDA estimates.

Weather Risk

With the U.S. harvest still four months away and about a third of Midwest fields unplanted, unusual weather may yet limit output. In each of the previous two years, the USDA’s forecasts in June were higher than the final tally seven months later.

Wet, cold weather the past two months from North Dakota to Illinois is increasing risk of lower yields, said Gregg Hunt, an analyst at Archer Financial Services Inc. in Chicago. Planting is off to the slowest start since 1996, with 71% complete on June 9, compared with a five-year average of 84% USDA data show. Unless there is drier weather farmers may decide to leave fields fallow, he said.

About 17.67 inches (44.9 centimeters) of rain fell in Iowa, the biggest U.S. producer, from March 1 through May 31, the most in state records that began in 1873. MDA Information Systems LLC in Gaithersburg, Maryland, said last week that late planting and rising crop-insurance claims will force the USDA to cut its output forecast.

Hedge Funds

Soybean prices jumped 7.9% in May, the biggest gain in 10 months, on concern that U.S. supplies will remain tight before the harvest. Hedge funds and other largest speculators boosted bets on a rally for four consecutive weeks and to the highest in almost seven months, U.S. Commodity Futures Trading Commission data show.

Farmers are holding onto inventories and costs for livestock feed are still rising, Joe F. Sanderson Jr., the founder of Laurel, Mississippi-based Sanderson Farms Inc., the third-largest U.S. poultry producer, told analysts on a conference call June 4. Soybeans are crushed to yield oil used for food and meal used in feed.

Supply may be disrupted by a strike in Argentina, where farmers plan to suspend trade for at least seven days, Eduardo Buzzi, the head of the Argentine Agrarian Federation, said in an interview with Radio Mitre on June 9. The growers are protesting tax increases, government policies and a lack of railways.

Lower Forecasts

Soybeans will average $11.75 in 2013-2014, 16% less than in the previous season, Deere & Co., the world’s largest agricultural-equipment maker, forecast May 15. The Moline, Illinois-based company was anticipating $12.50 in February. Rabobank International expects a fourth-quarter average of $11.75, or 11% less than now.

“The decline in prices in the second half of 2013 could be significant if weather conditions are near normal or even slightly unfavorable,” because output will jump, Goldman Sachs Group Inc. analysts said yesterday in an e-mailed report.

Worldwide soybean inventories will rise 19% to 74.04 million tons in the 12 months ending in September 2014, the biggest pre-harvest reserve ever, according to the average of 16 analyst estimates compiled by Bloomberg.

Price Cure

“The cure for high prices, as the commodities-market adage goes, is high prices,” Greg Page, the chief executive officer of Cargill Inc., wrote in a column for Bloomberg View on May 30. The Minneapolis-based company dominates U.S. grain handling along with Bunge Ltd. and Archer-Daniels-Midland Co. U.S. farm income rose 14% to $128.2 billion last year as prices surged and insurers made record payouts for ruined fields.

Global food costs retreated for the first time in four months in May, the United Nations’ Food & Agriculture Organization estimates. Prices are now 9.5% below the record reached in February 2011, the Rome-based agency says.

Rising prices for U.S. supply will drive more buyers to South America, said Doug Jackson, a vice president at INTL FCStone Inc. in West Des Moines, Iowa. Shipments from New Orleans cost $1.265 a bushel more than in Paranagua, Brazil on June 7, according to data from the USDA and Sao Paulo-based broker Ary Oleofar Corretora de Mercadorias. They were at a 15- cent discount a year ago.

Export Cancellations

U.S. exporters reported more cancellations than new sales in three of the past seven weeks and shipments are at their lowest for this time of year since 2004, USDA data show. China, the biggest buyer, imported 3.4% less in May than a year earlier and has been canceling purchases from the U.S. for delivery before Aug. 31 as it shifts purchases to cheaper supplies in South America. Brazil’s shipments were a record in May, customs data show.

“The pace of Brazilian exports is very strong and will slow demand for U.S. soybeans,” said Anne Frick, the senior oilseed analyst for Jefferies Bache in New York. “We have plenty of global supplies.”

See the original article >>

All Quiet on the Currency Front

by Jeffrey Frankel

CAMBRIDGE – The term “currency wars” is a catchy way of saying “competitive devaluation.” In the wake of the sharp fall in the value of the yen over the last six months, owing to the monetary component of Japan’s efforts to jump-start its economy, the issue is expected to feature prominently on the agenda at the G-8’s upcoming summit in Northern Ireland. But should it?

This illustration is by Paul Lachine and comes from <a href="http://www.newsart.com">NewsArt.com</a>, and is the property of the NewsArt organization and of its artist. Reproducing this image is a violation of copyright law.

Illustration by Paul Lachine

According to the International Monetary Fund, competitive devaluation occurs when countries are “manipulating exchange rates…to gain an unfair competitive advantage over other members…” But a key point is often missed when the term “currency wars” has been applied to monetary expansion by the Federal Reserve, the Bank of Japan, and other central banks in recent years. The impact of monetary stimulus on a country’s trade balance – and hence on demand for trading partners’ goods – is ambiguous: the expenditure-switching effect when the exchange rate responds is counteracted by the expenditure-increasing effect of expansion. Restored income growth means more imports from other countries.

“Currency wars” is a more apt description when countries intervene to push down their currencies in deliberate attempts to help their trade balances. But national authorities will and should pursue economic policies that are primarily in their own countries’ interests. International cooperation can be fruitful; but there is little point attempting it if the nature of the spillover effects is not relatively clear to all. Everyone agrees, for example, that spillovers from pollution or tariffs are negative, not positive, externalities. But the case is not as obvious in the case of monetary policy.

For example, if unemployment is high and inflation low in the United States, the Fed will naturally ease monetary policy, particularly via low interest rates. If Brazil is in danger of overheating, its central bank will naturally tighten policy, particularly via high interest rates. It is also natural that capital will flow from north to south as a result, causing the Brazilian real to appreciate against the dollar. That is the beauty of floating exchange rates: both countries can choose their own appropriate policies.

Given that the two countries’ are in different cyclical positions, such exchange-rate movements signal that the international economic system is working properly. Although the stronger real will help US exporters (other things being equal) and hurt those in Brazil, such “casualties of war” are not even collateral damage; rather, they are precisely the point. If the goal is to stimulate demand for US goods and dampen demand for Brazilian goods, why shouldn’t exporters in both countries share in that process, alongside construction and other sectors that are sensitive to interest rates via domestic demand?

A more serious dilemma arises if one of the countries is targeting or even fixing the exchange rate, as many Latin American governments did to kill off high inflation in the late 1980’s and early 1990’s. Such a country will not necessarily want to abandon a proven exchange-rate regime at the first sign of trouble. Capital controls and sterilization of reserve flows might help to delay the adjustment, but a persistent one-directional capital flow will eventually force the fixed-exchange-rate country to allow either its exchange rate or its money supply to adjust.

True, in recent years, a wide array of countries has indicated a preference for weaker currencies as a means of improving their trade balances. It is also true, by definition, that not everyone can depreciate or improve their trade balance at the same time. But that does not necessarily mean that depreciators are guilty of violating any agreements or norms, especially if they have merely maintained a pre-existing exchange-rate regime.

Uncoordinated monetary expansion does not even necessarily leave the world in a worse equilibrium. Barry Eichengreen and Jeffrey Sachs have persuasively argued this for the 1930’s (the opposite of the conventional wisdom regarding beggar-thy-neighbor competitive devaluations). Although all countries could not improve their trade balances simultaneously, when they devalued against gold, they succeeded in raising the price of gold, thereby increasing the real value of the global money supply – exactly what a world in depression needed.

Brazil’s finance minister, Guido Mantega, coined the term “currency wars” in response to American efforts to enlist Brazil and other competitors of China in a campaign for a stronger renminbi. But the accusation against the US is especially misplaced. US monetary expansion contributed to global monetary expansion at a time when, on average, it was needed. US authorities have not intervened in the foreign-exchange market or talked down the dollar, and currency depreciation was not the Fed’s goal when deciding to implement its quantitative-easing policy.

Japan comes a little closer to qualifying as a currency warrior, because members of Shinzo Abe’s government were initially foolish enough to mention yen depreciation as an explicit goal.

China qualifies in one important respect: the renminbi was substantially undervalued by most measures from 2004 to 2009 (less so now). But countries have a right to opt for fixed exchange rates. Continuing an existing regime, as China was doing, does not sound very much like “manipulation.”

True, renminbi appreciation was probably in China’s interest. It would have been reasonable, beginning in 2004, for those worried about current-account imbalances to propose that China voluntarily allow some appreciation in exchange for, say, the US putting its fiscal house in order. But this is different from accusing Beijing of violating international norms or rules and threatening retaliation (for example, by imposing tariffs, which is a violation of international rules).

Few countries accused of participating in a currency war have undertaken discrete devaluations in recent years or acted to weaken their currencies by switching their exchange-rate regimes. These are the sorts of deliberate policy changes connoted by a term like “manipulation.” Switzerland perhaps comes the closest. But the franc was so strong, even at the new rate set in September 2011, that no one can accuse the Swiss National Bank of unfair undervaluation.

The world has enough serious disputes as it is. We do not need to invent new ones.

See the original article >>

Strong Gains Develop in Livestock Futures

By DTN/The Progressive Farmer

Strong Gains Develop in Livestock Futures
The surge in lean-hog buying activity is developing widespread gains in the
livestock market. Trade activity is expected to remain firm through the rest of
the session.
By Rick Kment
DTN Analyst
GENERAL COMMENTS:
Livestock futures are holding sharp triple-digit gains at midday as strong
fundamental support is being combined with outside market buying interest. Corn
futures are higher at midday. July corn futures are holding 8 cent gains at
midday. Stock markets are lower in light trade. The Dow Jones is 20 points
lower while Nasdaq is down 11 points.
LIVE CATTLE:
The narrow gains seen through the first hour of trade has been replaced by
triple-digit gains. Although there is still a lot of focus on the direction of
beef values. The support of outside markets is helping draw widespread support
to the complex. Cash cattle activity is quiet with a few token bids of $120 per
cwt in Kansas. Asking prices are at $124 in the South and $200 and higher in
the North. Active trade will likely be pushed off until the end of the week,
although packers will likely remain short bought. Beef cut-outs at midday are
mixed, $0.86 per cwt higher (select) and down $0.12 per cwt (choice) with
active movement of 138 total loads reported (59 loads of choice cuts, 49 loads
of select cuts, four loads of trimmings, 11 loads of ground beef).
Feeder Cattle:
Even though very little buying support was seen through the early part of
the session, traders have quickly jumped back into the market. The surge higher
in both the live cattle futures and lean hog futures market is sparking
interest across the entire feeder cattle market. This could draw additional
support into the market over the end of the trading session.
LEAN HOGS:
Nearby lean hog futures have led the surge higher through the morning. The
focus on the potential firmness in both cash hog values and pork prices are
keeping commercial buyers active through the summer contracts. Traders are
focusing on additional potential gains, which is keeping July futures nearly $2
per cwt higher at midday. Cash prices higher on the National Daily Direct
morning cash hog report. The weighted average price gained $0.16 per cwt to
$95.86 per cwt with the range from $92.23 to $103.00 per cwt on 3,331 head
reported sold. The National Pork Plant Report reported 218 loads with prices
gaining $1.78 per cwt. Lean hog index for 6/07 is at $97.48 up 0.33 with a
projected two-day index of $97.96 up 0.48.
Rick Kment can be reached at rick.kment@telventdtn.com

See the original article >>

Did the ECB Mega Bailout Just Hit the Wall?

by Graham Summers

Few analysts know or admit it, but the only thing that held Europe (and ultimately the financial system) together since May 2012 was the promise of unlimited bond purchases from the ECB.

The reason this worked was because traders poured into European bonds in an effort to front run the coming ECB purchases (much as they have done with Treasuries during every new QE plan in the US).

This in turn became a self-fulfilling prophecy as European bond yields fell which induced more buying… which resulted in politicians proclaiming that the EU Crisis was “over.”

However, none of the structural issues in Europe were solved in any way. And now we’re getting to the details of the ECB’s proposed plan. And they are… nothing. The ECB is asking Germany’s constitutional court to “OK” a plan to buy whatever the ECB wants…without providing any legal details around the deal.

Why is this? How can you ask for unlimited funds without providing any details? Even a mortgage requires contracts. Surely an unlimited bond-buying program would require mountains of documents?

The fact of the matter is that the ECB knows there is no such thing as “unlimited” buying. At some point the bond markets will reject intervention (much as they are in Japan today).

Instead, the ECB used the term “unlimited” because it wanted investors to “imagine” that everything was solved. But Europe doesn’t have much money.

Indeed, Germany initially was going to set the program’s limit at a little over €500 billion… that sounds like a lot, but when you consider that the EU sovereign bond market is over €11 TRILLION and growing monthly, this will only go so far.

Put another way, the entire “unlimited” promise by the ECB was a bluff. The markets are beginning to figure this out which is why Europe is heading back into Crisis.

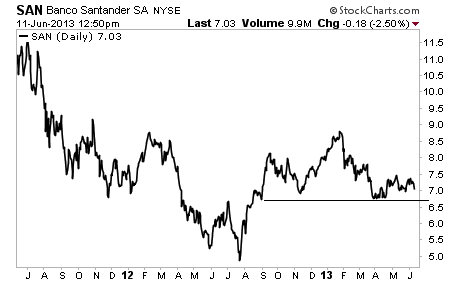
Take a look at Spanish bank Santander: we have a series of lower highs since the peak in January 2013. Whenever we take out the trendline it’s game over.

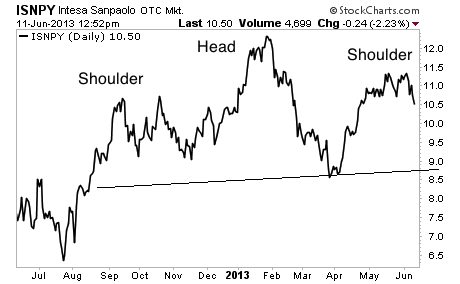
Check out the Head and Shoulders forming in Italian bank Intesa Sanpaolo:

See the original article >>

Nasdaq 100 fell 80% last time this took place! Different this time?

by Chris Kimble

CLICK ON CHART TO ENLARGE

Penny stock volume as a percentage of Nasdaq volume became a very large percentage back in Feb of 2000, reflecting that a high level of speculative trading was taking place. In the next few years the Nasdaq 100 lost over 80% of its value!

Recently Penny stock volume as a percentage of Nasdaq volume took a very sharp increase, surpassing the highest level ever, which took back in 2000 at the Dot.com highs!

Is this the holy grail of indicators?  No!

I do feel investors should be aware of this, especially when Margin debt levels are at levels only seen one other time in history, which happened to be at the same time Penny stock volume hit highs back in 2000!!! (See debt levels here)

Will it be different this time?  I suspect it will!  Even if its one third of the issue it was last time, that might be enough for a few investors!!!

See the original article >>

How to Profit From Japan's New Lost Decade

By Keith Fitz-Gerald

A few weeks ago The Economist depicted Japanese Prime Minister Shinzo Abe as a super-hero on its May 17 cover. Noting specifically, "Is it a bird? Is it a plane? No....It's Japan."

Knowing what I know about how magazine covers tend to affect the markets, I could only shake my head.

Japan

Not only do I think the cover is the harbinger of "Abe-doom," but The Economist may as well have handed him a ginormous lump of kryptonite.

After rising 80% from last year's lows, Japanese stock prices have done a U-turn and unceremoniously have begun to return to earth, falling more than 18% in 10 consecutive trading sessions as of last Wednesday.

The Nikkei regained some ground in wild trading that saw it up 4.94% on Monday and it's still up 56.7% over the past 12 months, but don't hold your breath. "Super Abe" has pulled out every stop, and the markets won't think it's enough for much longer.

What's interesting about that is this actually isn't Abe-san's fault. No, the markets completely ignored history and built in such outrageous expectations that anything short of an economic miracle will be disappointing.

Japan

Today I want to address the two questions on everybody's mind: Is such volatile trading  the start of a major reversal? Or is it a precursor to still-higher trading ahead?

And, what can you do about it?

The Flip-side of Reverse

Let's start with the notion of a reversal.

Parabolic charts are never good, no matter what asset class, stock or individual security you're considering. They are not the signs of growth that many think they are. Instead, parabolic charts like the Nikkei's over the past 12 months have historically suggested imminent collapse.

The reason is simply that exponential growth cannot continue indefinitely because it's unsustainable. In scientific terms, it's impossible to maintain the conditions needed for systemic survival.

In practical economic terms, the situation is no different. However, it's not just the conditions that matter. You have to consider market psychology, too.

The markets got way ahead of themselves based on nothing more than the collective hopes for Abenomics. Now, unfortunately, they're going to have to come to terms with the results...or in this case, lack thereof.

It's not that the thinking is bad. It's wrong given what we know about long-term monetary history, but not necessarily bad. As a market professional, I'm happy to capitalize on whatever is driving the markets.

So what's hit the fan?

When Prime Minister Abe introduced his plans to inject three times the amount of comparative stimulus Bernanke had into his country's economic machine despite the fact that it is one-third the size of the U.S. markets, it was viewed as a good thing because it would weaken the Yen.

After all, went the thinking, Japan is an export nation, so the weaker Yen would make Japanese products more competitive in global markets. The Nikkei took off.

What those folks missed was the fact that Japan has no raw materials of its own to speak of. Therefore, in order to build up exports, Japan's industrial giants would have to build up raw material imports...sharply.

And that's exactly what's happened.

Imports are up sharply and threatening to overwhelm any competitive advantage from lower-priced exports because the costs of manufacturing jumped significantly. This is particularly true for energy-related expenditures, which are now running at post-quake highs. Very shortly, this is going to work its way into quarterly reporting and the numbers won't be good.

Especially when you consider that former export surpluses are now deficits.

Japan

This exposes another dangerous flaw in Abe's programs.

Deflation-busters

Investors and politicians alike have assumed that Prime Minister Abe and his sidekick, Bank of Japan Governor Haruhiko Kuroda, want higher inflation because that's what they've heard about his unlimited stimulus programs...that they're supposed to more than double it to 2%.

In reality, Abenomics are supposed to end deflation.

I'm not splitting hairs. Stopping deflation is very different from creating inflation, especially when you're talking about the imports I've just mentioned. Over 50% of what Japan imports is initially priced in dollars.

So while Japanese exporters are enjoying a boost from the falling Yen, those who are selling into the island nation are loving the boost that's coming from dollar-based goods, especially when they can raise prices at the same time to compensate for tighter conditions.

Over time, what this suggests is that the short-term boost in exports Japan's enjoying today will be cannibalized by the rising cost of imports when prices adjust, effectively negating Abenomics' gains.

So now what?

Japan's got an identity crisis.

Take Japanese bonds, for example. Abe's policies should create inflation that's a bond killer. Yet, a fundamental element in the Bank of Japan's policies at the moment is the continued monetization of Japanese debt which, in plain English, means buying bonds...lots of bonds.

The result is unprecedented volatility in Japanese government bonds and not one, but three global stock market swoons in the last eight weeks caused by Japanese Value at Risk models coming unglued because of it. Nobody knows if they should be buying or selling...except us.

And I'll get to that in a minute, but I have to explain something first.

Many investors have fallen for the very seductive siren of stimulus. While not exactly believing that things will get better, they have placed their faith in an economic doctrine for which there is no precedent of success. Short term, perhaps...but longer term, no - but that's a story for another time and one we've covered extensively in Money Morning.

What's vitally important to understand right now is that Japan has any number of structural challenges that are well beyond whatever Prime Minister Abe cooks up.

For example, the country's energy markets remain completely dependent on global pricing and largess. With no practical homegrown alternatives, Japan has to import at least 80% of its energy.

Most of the country's economic system is hopelessly over-regulated. This robs private capital of return and incentive. Granted, Abe seems to be aware of this, but if you think deregulation happens at a snail's pace in the United States and Europe, you're in for a whole new experience in Japan, where policy changes move at glacial speed.

Trade remains very protectionist especially where agricultural products are concerned. No doubt I like my neighborhood markets and local produce a lot when I'm home in Kyoto, but I have been frustrated for 25 years that I can't get the supplies I need to make a decent burrito easily. And finding Thai rice can be a challenge (rice farmers are one of the most powerful lobbies in Japan).

Compounding all this is a near-completely unworkable immigration policy and demographics that are going in the wrong direction as Japanese citizens age and quite literally die off. Without getting too graphic, let me give you an example that will put Japan's demographics into perspective...there are now more adult diapers sold in Japan than infant nappies.

Bet Against Japan's Politicians

Sadly, as much as I love Japan, its people, and its culture, the better bet right now is against its politicians.

    1) Short the Yen: We've talked a lot about this over the past year and trades I suggested 16 months ago are now up more than 60%. That, incidentally, is more than double the splash George Soros made last February when the Wall Street Journal reported he'd done the same thing.

If you missed the initial recommendation, don't worry. There's still plenty of runway. After a period of base building in the neighborhood of 100 Yen/$1USD, I expect it to weaken to 150 Yen over the next 24 months. Definitely a slow burner, though, because now that the easy money has been made, the Bank of Japan will do everything it can to "prove" to the world that it's in control just like Bernanke is trying to do in the United States.

    2) Short Japanese government bonds: The Bank of Japan dominates Japanese asset markets much more than the Fed does here. That means when the Bank loses control, it's going to be a major liquidity event worldwide. Bill Gross of PIMCO fame alluded to that recently and is of a similar view. My favorite way of doing this is the PowerShares DB Inverse Japanese Government Bond Fund (NSDQ: JGBS) which is designed to exploit the breakdown in Japanese government long bonds as rates rise and the situation deteriorates.

    3) Short Japanese equities: The unprecedented Japanese bond volatility that's already played a role in three major global equity shakeouts is just a taste of what's coming. If VaR models get out of line again, the selling will be very fast and very intense. One way to capture that is via the ProShares UltraShort MSCI Japan (Ticker: EWV). Or, simply go short the Nikkei 225 itself. But do it in stages. Better yet, average in by building a position over time.

At the end of the day, nobody likes to bet on economic failure. But it sure can be profitable if you can get over any hang-ups you have about doing so.

Just ask George Soros and Jim Rogers, whose Quantum Fund returned 4,200% over a 10-year period - versus only 47% in the S&P 500 - driven in large part by opportunities nobody else saw at the time.

See the original article >>

U.S. Politicians and Central Bankers Crushing the Middle Class

By: John_Browne

Like a carefully memorized religious incantation, politicians and central bankers continually stress how their stimulus policies are designed to promote the interests and prosperity of the middle class. Cynical observers may note that this brave political stance may have something to do with gaining the support of the vast majority of voters who identify themselves as "middle class." However, the cumulative effect of their economic programs has achieved the opposite. The middle class is being crushed under increased taxes, negative real interest rates, debased currencies and increasingly intrusive regulations.

A large and healthy middle class is the single most important bastion of democracy and freedom in the modern world. Individuals who identify with the middle class exhibit strong support of their nation and economic system. A small, weak middle class opens the political door to dictatorial control and tyranny. This was the case in the waning days of czarist Russia when, the small Bolshevik party was able to court the discontent of the underclass to seize control over more than one hundred million people.

Many government policy decisions lead Americans to take on debt, such as Clinton's home ownership push, Bush's post-911 spending prescription, or the tax code's mortgage interest deduction. As the largest debtor in the world, it is not a leap in logic to imagine the U.S. Government prefers policies that favor debtors rather than creditors. These efforts can be magnified if central bank monetary debasement destroys the value of any savings the middle class had managed to save. The explicit policy of the Federal Reserve is now to hold interest rates below the rate of inflation, which by definition discourages saving and encourages debt.In exchange for the loss of their savings, the middle class can't point to any significant gains. Wage rates in America and Europe have been largely flat for several years. In Japan, a similar recession caused a flat economy that has lasted for more than ten years while the broader economy has largely stagnated.

Meanwhile the middle classes are reeling from price increases in many of the areas that are most vital to their lives, such as food and energy. Statistics show that the share of income that Americans must devote to these basics has increased significantly in recent years. In addition, huge new stealth taxes, such as ObamaCare, threaten to dig the hole even deeper. The combination has been a serious reduction in the net disposable income of many consumers in the middle classes. However, even these reduced incomes disqualify many in the middle from government aid programs such as mortgage relief, Medicaid, and food stamps. In short, the middle class is being squeezed between lower net earnings and higher living costs. It's no wonder that many have turned to debt to get by.

Many of those members of the middle class, who have scraped and saved during their working lives, now face serious unemployment, often long-term in nature as old skills become redundant. In retirement, these people live often on fixed incomes. Many who are fearful of recession and the resulting market vulnerabilities of securities have hoarded cash in bank deposits. Today's interest rates manipulated downwards by central banks offer depositors less than half of one percent a year on most deposits. With even 'official' inflation running at just over one percent, bank deposits and short-term financial instruments offer only negative yields. If a more realistic rate of inflation were widely known, almost all fixed instruments, other than those of very high risk, would offer negative real yields.

Finally, the oppressive regulations and aggressive intrusion of today's government are reducing the incentive and raising the costs of starting and continuing in small businesses. In fact, a recent report detailed the increasing difficulties of starting a small business in America. Despite small but steady increases in the overall employment picture, more small businesses are cutting workers rather than bringing on new hires.

In short, the policies of central banks, combined with those of overbearing government, are crushing the middle class and with them the single most important bastion of democracy. Students of history recognize this trend as dangerous. People who believe that society offers no hope of improvement are often willing to enlist in open class warfare and subscribe to the views of dangerous demagogues. Perhaps this is the direction that Washington, Brussels, and Tokyo want to go? We should take great efforts in spreading the word that freedom is good for everyone, not just the rich.

See the original article >>

German court says won't be swayed by ECB bond-buying success

By Annika Breidthardt

European Central Bank (ECB) President Mario Draghi speaks during the monthly ECB news conference in Frankfurt June 6, 2013. REUTERS/Ralph Orlowski

(Reuters) - The head of Germany's Constitutional Court said on Tuesday that the success of the European Central Bank's bond-buying program in restoring calm to the euro zone would have no impact on its ruling of whether the scheme is constitutional or not.

In a two-day hearing, the court is looking into complaints by over 35,000 Germans that the ECB scheme, dubbed Outright Monetary Transactions (OMT), is really a vehicle to fund euro zone members through the back door, in violation of German law.

ECB President Mario Draghi, who unveiled the program last year as fears of a catastrophic euro breakup flared, has called it "probably the most successful monetary policy measure undertaken in recent time".

But Jens Weidmann, head of the Bundesbank and a member of the ECB's governing council, is testifying against OMT at the hearing in the southern city of Karlsruhe, setting up a rare public clash with his German colleague Joerg Asmussen, a member of the ECB board.

At the outset of the hearing on Tuesday morning, court President Andreas Vosskuhle said the success of the bond program would play "no role" in the assessment of its constitutionality.

The court cannot revoke the ECB bond-buying scheme but, in considering whether it violates the German parliament's sovereign right to control the budget, it could challenge certain aspects of the program, such as its "unlimited" nature.

This would hamper the effectiveness of the OMT, which has worked largely by giving investors the confidence to buy bonds issued by troubled countries such as Spain and Italy, assured the ECB would intervene on the secondary market if any government were at serious risk of defaulting on its debt.

"WHATEVER IT TAKES"

The crisis has subsided significantly since Draghi promised to do "whatever it takes" to save the euro last July, before unveiling details of the bond scheme two months later.

Even though the ECB has not bought a single bond of any distressed government under OMT, yields on 10-year Spanish bonds have fallen from 7.6 to 4.6 percent, while their Italian equivalents have dipped from 6.6 to 4.3 percent.

Speaking at an industry conference in Berlin, Chancellor Angela Merkel said her government would make the case in Karlsruhe that the ECB was acting appropriately to stabilize the euro. She also stressed the importance of the currency bloc's permanent rescue mechanism, on which the court still has to deliver a final verdict.

Her Finance Minister Wolfgang Schaeuble, attending the court hearing, said: "The German government sees no signs that the measures taken by the ECB so far violate its mandate."

The complaints against the OMT reflect fatigue in Europe's largest economy at funding the lion's share of the bailouts. On Tuesday, about 20 members of the new anti-euro "Alternative for Germany" party demonstrated outside the court.

For Weidmann, the OMT is tantamount to printing money to finance struggling euro states. The ECB maintains the OMT fits within its mandate of securing price stability.

The eight red-robed judges are not expected to reach a final ruling until after a German parliamentary election in September.

But they are expected to signal what they think of the OMT and will also have to decide whether it falls within their jurisdiction. If they decide it does not, the court could refer the issue to the European Court of Justice in Luxembourg.

"This raises the most difficult legal question," Vosskuhle said, noting that the ECB, though based in Frankfurt, is bound European Union and not German law.

In earlier rulings the court has approved euro zone bailout schemes while insisting the German parliament be consulted more fully. For plaintiffs like Peter Gauweiler, on the eurosceptic fringe of Merkel's conservatives, this is not clear enough.

"A 'yes, but' does not help anymore. A clear 'no' is what is needed," his lawyer Dietrich Murswiek told the court.

See the original article >>

China downplays talk of mounting corn imports

by Agrimoney.com

China's influential CNGOIC think tank downplayed forecasts of a huge rise in the country's corn imports, flagging the potential for domestic output, but acknowledged the prospect of more soybean purchases.

Wang Xiaohui, director of the market monitoring department at the state-run bureau, highlighted the pressure on the country to raise its corn supplies, in the face of rapidly-growing demand, from industrial as well as feed users.

"Higher income [for consumers] means more consumption of food," Mr Wang said, told the International Grains Council conference, pegging China's feed use alone at 131.0m tonnes in 2013-14, and industrial use at 19.0m tonnes.

However, with the domestic harvest expected at 214.0m tonnes, imports would be constrained to 5.0m tonnes next season, if a figure nearly double the 2.7% brought in during 2012-13.

The USDA foresees China importing 7.0m tonnes in 2013-14.

Demand vs supply

And further ahead, Mr Wang said that while "strong industrial demand and livestock feeding" will further raise demand, domestic production will increase too to meet most of the extra demand.

"Corn area is expected to rise slightly above current levels over the next 10 years," he said, with improved agricultural techniques improving yields too, even assuming China maintains curbs on growing genetically modified varieties.

"China will still need to import 10m tonnes to make up the difference," he said, a figure well below the 19.6m tonnes that the USDA foresees for 2022-23.

However, it concurs more closely with a forecast last week from the OECD and UN Food and Agriculture Organization that China's imports of coarse grains overall, including the likes of barley and sorghum, will reach 13.2m tonnes in 2022.

China's prospects for corn imports are closely watched by markets given the country's change from self-sufficiency to being a structural importer and, given the size of its needs, the potential for huge purchases if the domestic harvest falls short.

Soybean outlook

China's soybean import prospects are also keenly monitored by investors, given the country's status as the top buyer.

Mr Wang forecast that China's domestic soybean production will remain constrained by plantings which are "projected to decrease" longer-term, squeezed by the country's land constraints.

With consumption by feed groups rising by some 3% a year, "more soybeans will need to be imported", he said.

However, Mr Wang stopped short of making a forecast for China's import needs.

See the original article >>

Gold Major Reversal Imminent, Rare Opportunity to Buy at Ridiculously Low Prices

By: Clive_Maund.

We are very close to or at a major bottom in gold and silver now, regardless of the potential for another short term downleg. This is made plain by the charts we are going to look at in this update. COTs and sentiment are now at extraordinary extremes not seen in the entire history of this bullmarket. This means that when the turn really comes we are likely to see a scorching rally which will be driven by massive short covering that will leave most investors standing, mouths agape.

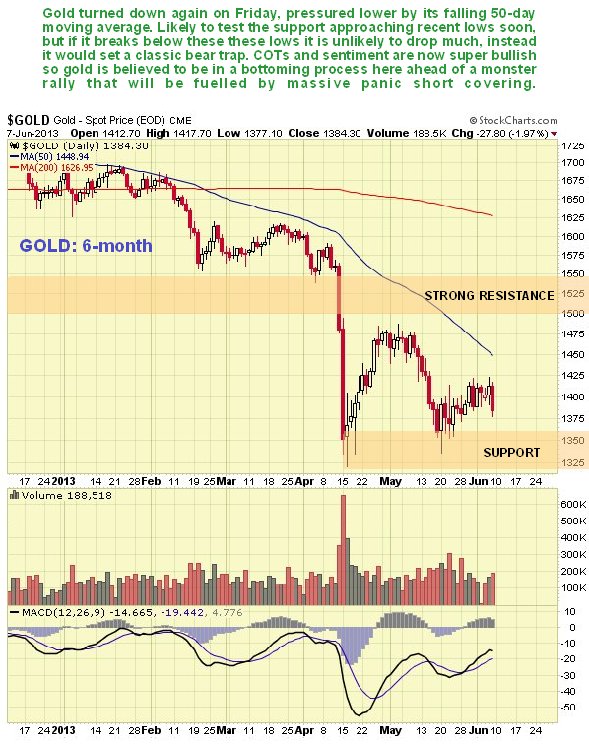
On its 6-month chart we can see gold starting to be pressured lower again by its falling 50-day moving average, after a feeble recovery rally. Although it looks set to continue lower short-term probably into the support approaching its April panic lows, for reasons that we will come to later there is considered to be a fair chance that these lows will hold, or that if the price does break to new lows, it won't be by much before it reverses to the upside after setting a bear trap. The position of the MACD indicator, which has largely neutralized following oversold extremes, certainly allows for further downside, but at the same time gold's overall oversold condition is shown by the large gap that has opened up between the price and its 50-day moving average, and the 200-day moving average quite far above.

Gold 6-Month Chart

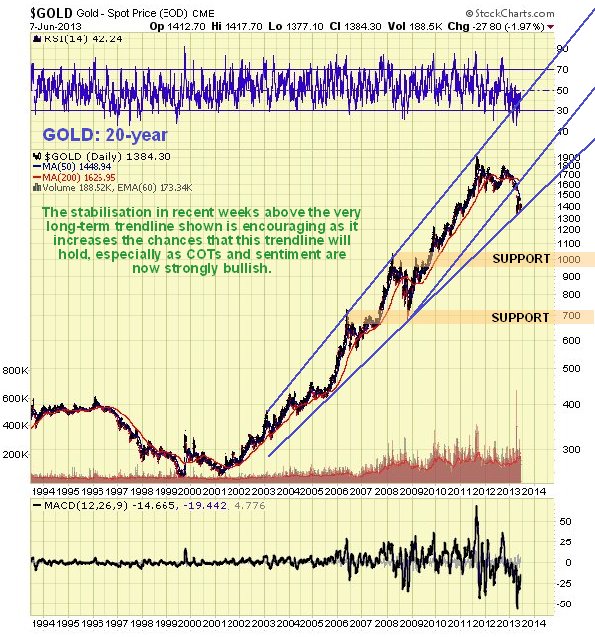
Gold's 20-year chart is interesting as it shows that a very long-term trendline is in play that is supporting the price at about the current level. Given the now strongly bullish COTs and sentiment there is considered to be a fair chance that this trendline will cause the price to reverse to the upside very soon now. If it breaks down from this uptrend it will open up the risk of a drop to the strong support in the $1000 area, but this is considered unlikely because of the aforementioned positive COTs and sentiment.

Gold 20-Year Chart

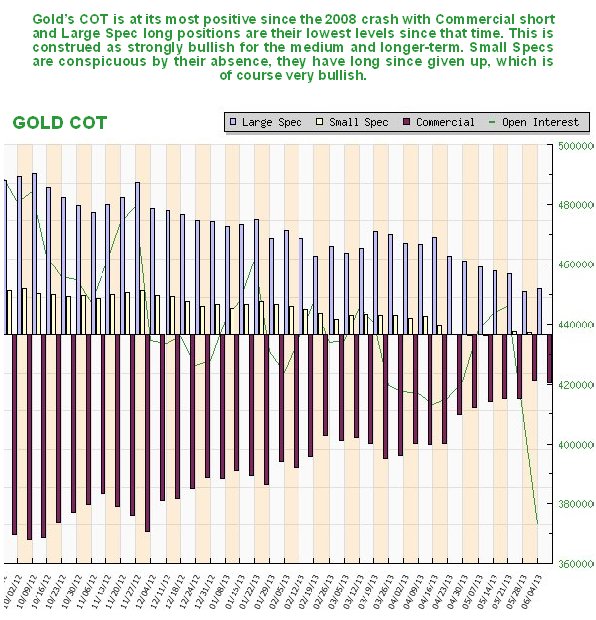
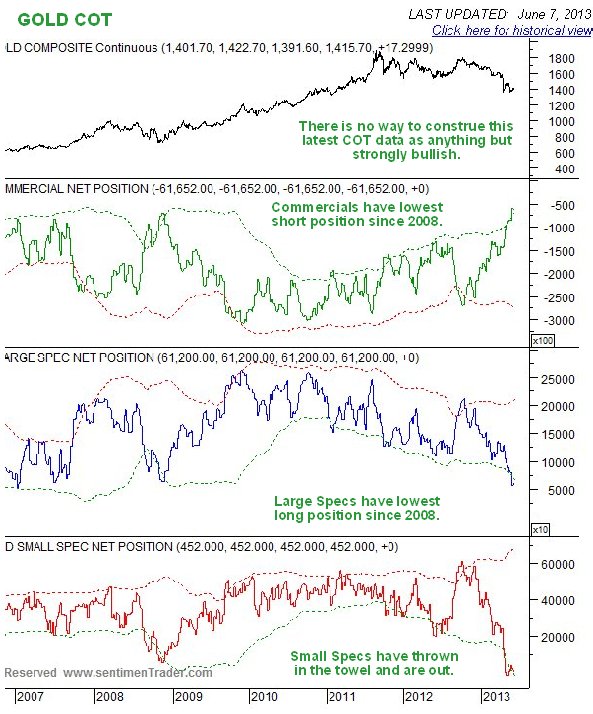
Gold's COT structure is little changed from last week. It is still strongly bullish with the Commercials having scaled back their short positions to a very low level, and Large Spec long positions having dropped back to a low level, while Small Specs have given up on the game altogether, which is a very positive sign. The slight uptick in Commercials' short positions last week is thought to be evidence of some position taking ahead of Friday's drop.

Gold COT Chart

The long-term COT chart looks very bullish indeed, with the Commercials having scaled back their short positions to the lowest level since the bullmarket began. Meanwhile Large Spec long positions have been reduced to their lowest level since 2008, indicating general despondency typical of a market bottom, and Small Specs have abandoned all hope, with their long positions disappearing altogether. This all pervasive negativity on the part of traders is the stuff of which important bottoms are made.

Gold COT Chart 2

Chart courtesy of www.sentimentrader.com

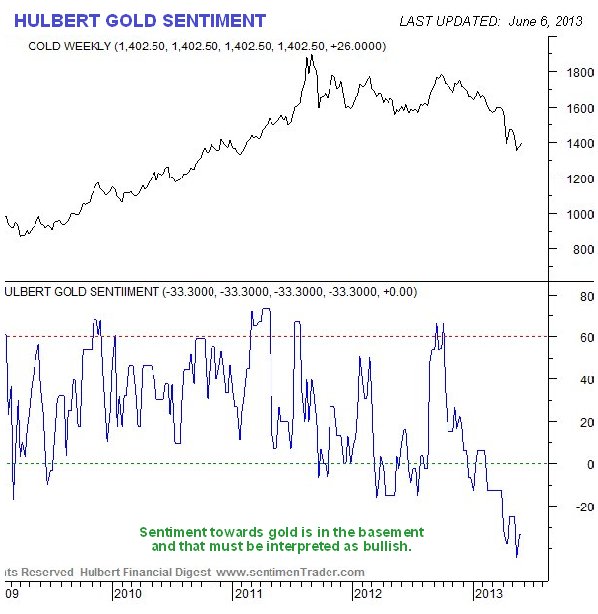
Meanwhile, Hulbert Gold Sentiment is in the basement, which is bullish!

Hulbert Gold Sentiment Chart

Chart courtesy of www.sentimentrader.com

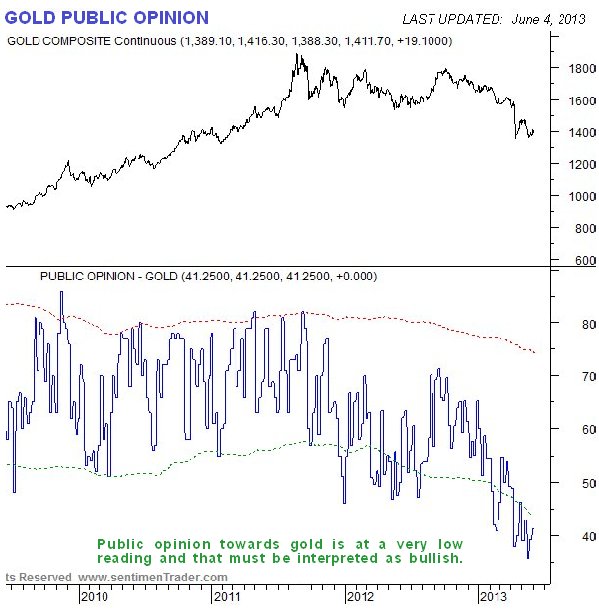
The public have a low opinion of gold, another positive, as the time to buy is when most investors aren't interested!

Gold Public Opinion Chart

Chart courtesy of www.sentimentrader.com

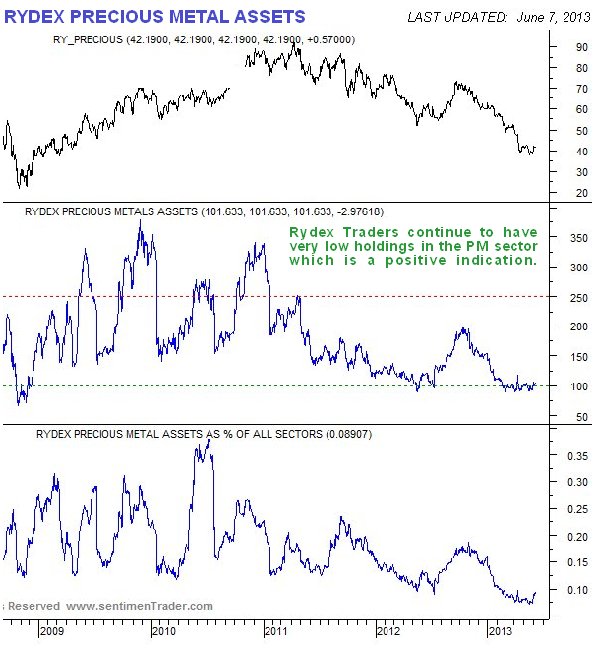
The Precious Metals assets of the Rydex traders are at a very low level, which is a good sign, as they make a science of being wrong!

Rydex Precious Metals Assets Chart

Chart courtesy of www.sentimentrader.com

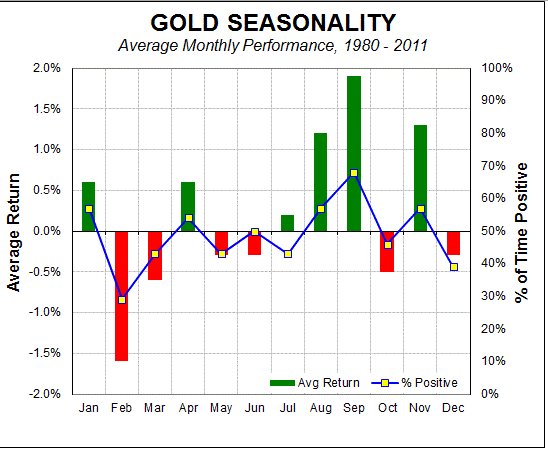
The seasonal chart for gold shown below reveals that while June is overall a negative month, the best time of the year seasonally speaking is just around the corner, with August and September being the best months. The script this year could therefore involve a selloff over the short-term into a final bottom, and then a reversal and big rally in the ensuing months.

Gold Seasonality Chart

Chart courtesy of www.sentimentrader.com

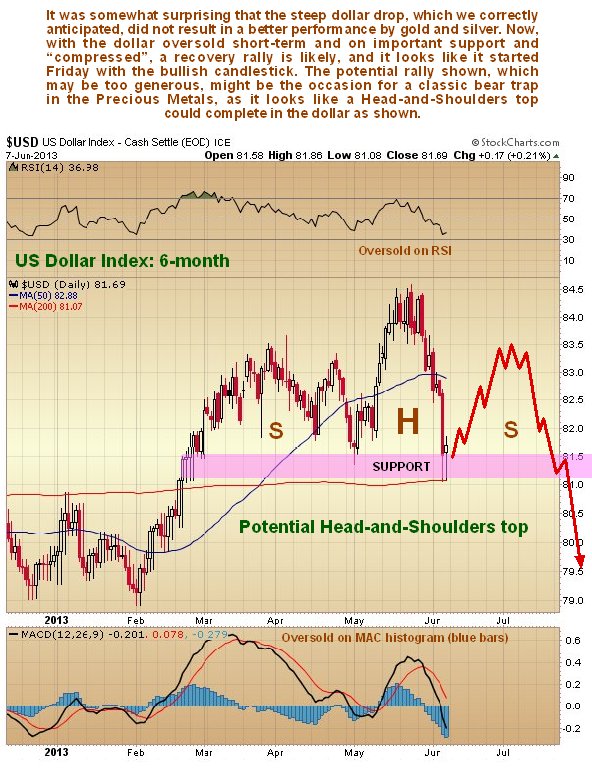
The dollar's rally reversed as predicted in the last update. After forming a choppy top area, it went into a steep decline which stopped abruptly right at important support near to its 200-day moving average on Thursday. Given the magnitude of the dollar's decline it is surprising that gold did not fare better, and this does not bode well for gold short-term, as the dollar now looks set to bounce back, although longer-term the outlook for it is bleak.

US Dollar Index 6-Month Chart

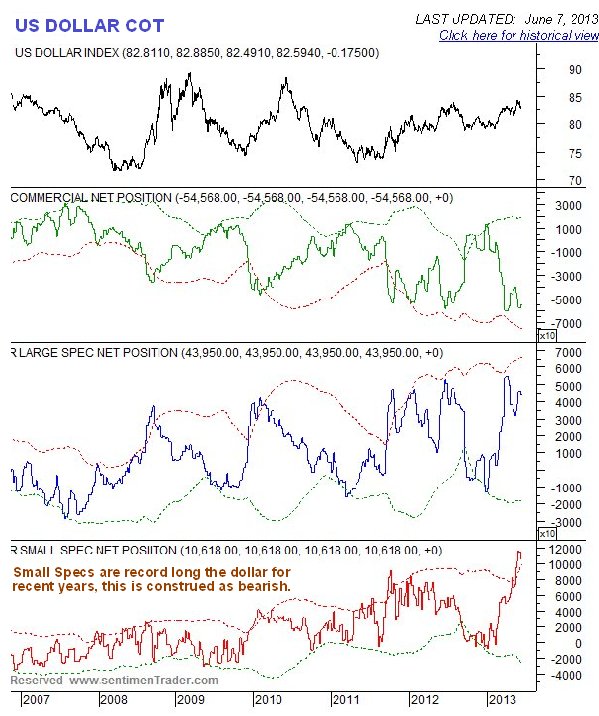
While we can all chortle with mirth at Japan's laughable attempt to imitate the Fed by printing money recklessly - laughable because they do not have the comfy cushion of being in possession of a global reserve currency - and how they drove straight at a brick wall leading to the distinctive sound of rapidly crumpling metal. What happened in Japan to the Yen and then to the stockmarket should serve as a dire warning to the Fed of what could happen if it continues to abuse the dollar relentlessly as it has been doing. The dollar chart now looks very scary, and although it does look set to bounce back short-term from oversold, which could clobber gold and silver one last time, what looks likely to happen is that it will rally up to form the Right Shoulder of the potential Head-and-Shoulders top shown on our 6-month chart for the dollar index below. Use this as your guide for when to reverse positions - dump the dollar when it tops out at the prospective Right Shoulder high, we'll offload our 'insurance' PM sector Puts for a nice profit and we'll go aggressively long the PM sector across the board - ETFs, better producing gold and silver miners with low or no debt, and Calls. Note here that the dollar rally up to mark out the Right Shoulder of our prospective H&S top may not get as far as shown on our chart - we could see a stunted Right Shoulder. COTs for the dollar are still extremely bearish, with Small Specs being insanely bullish, which is a huge negative.

US Dollar COT Chart

Chart courtesy of www.sentimentrader.com

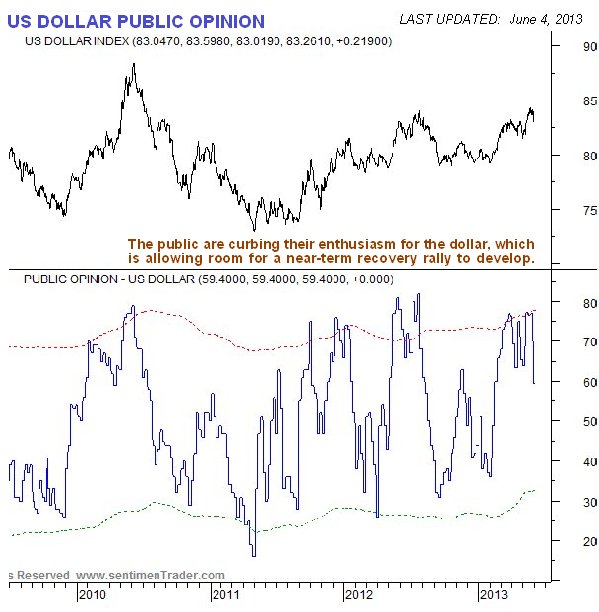
US dollar Public Opinion has moderated from its earlier positive extreme which also called for the recent drop. This moderation has created room for the expected short-term relief rally to develop.

US Dollar Public Opinion Chart

Chart courtesy of www.sentimentrader.com

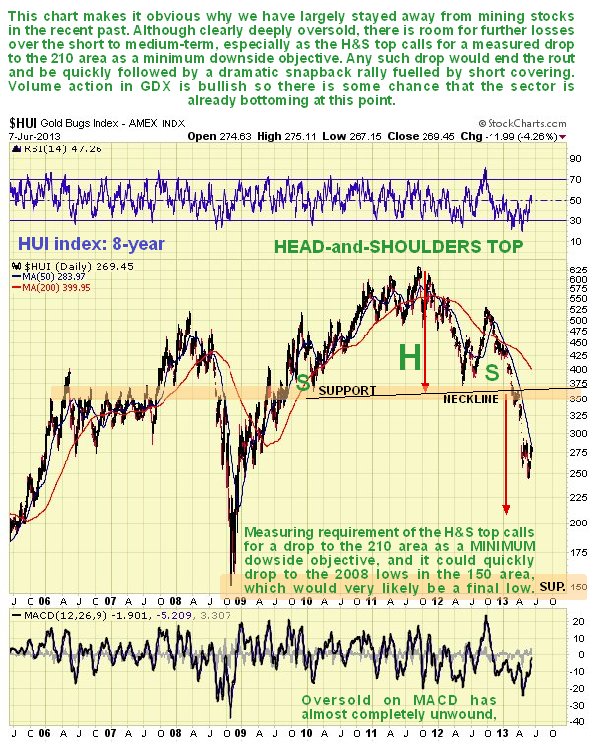
Although obviously cheap compared to last year it may still be a little early to buy PM stocks aggressively, which could easily fall victim to another short-term downleg, for reasons that are made plain by the 8-year chart for the HUI index shown below. This index broke down from a Head-and-Shoulders top earlier this year, whose minimum downside target on an equal move basis is about 210. If gold and silver drop short-term in response to a dollar bounce, they could get clobbered again, particularly as the oversold condition has unwound as is shown by the MACD indicator at the bottom of the chart having neutralized. There is some risk of them plummeting back to the vicinity of their 2008 lows. One big fundamental reason for the dreadful performance of mining stocks relative to gold is the huge increase in mining costs. However, when the turn does come a dramatic recovery is to be expected that will likely be amplified by short covering.

HUI Index 8-Year Chart

While mining stocks are vulnerable to further short-term losses, there is plenty of evidence that they are close to putting in a major bottom. This includes of course the positive indications that we have already looked at above for gold and silver, but also various indications that the sector is way oversold already and approaching extremes that call for a reversion to the mean.

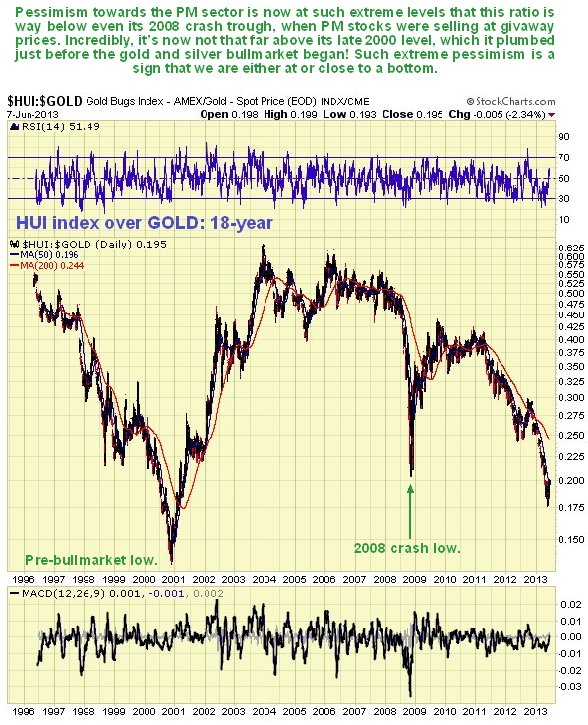
One powerful indication that the entire sector is close to a reversal is the chart below showing the ratio of the HUI index to gold. When this is at a very low level as now it shows over pessimism - when investors are scared and very negative towards the sector they favor bullion over stocks, and the more that this is the case, the more bullish it is. The situation is already really extreme, with this ratio already way below its low readings at the depths of the 2008 crash, and amazingly it is even approaching the dismal levels plumbed in late 2000 before the Precious Metals bullmarket even began. This is surely a sign that a bottom is close at hand.

HUI Index Over Gold 18-Year Chart

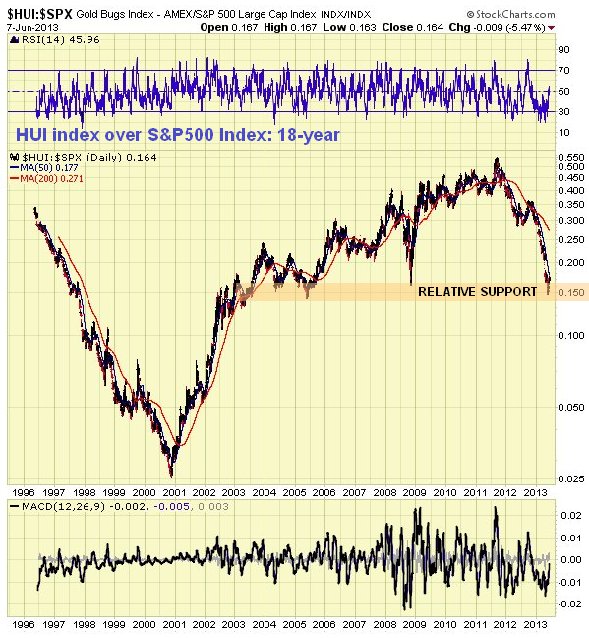
The recent rotten performance of the Precious Metals sector is made plain by the chart below showing the ratio of the HUI index to the S&P500 index over an 18-year timeframe. This chart shows that the PM sector outperformed for most of the time from late 2000 right through to 2011, only really going into reverse since the late 2011 peak. However, the dreadful performance of recent months has brought it down close to an important relative support level, where there is a strong probability that it will reverse to the upside, and thus outperform the broad market once again.

HUI Index over S&P500 Index 18-Year Chart

Conclusion: all of the indications are that a major PM sector reversal is imminent, but we might see one last down first, particularly by stocks. Any such drop will be viewed as throwing up a rare opportunity to buy the sector at ridiculously low prices.

See the original article >>

Is the Stock Market Ready to Take the Plunge?

By: Anthony_Cherniawski

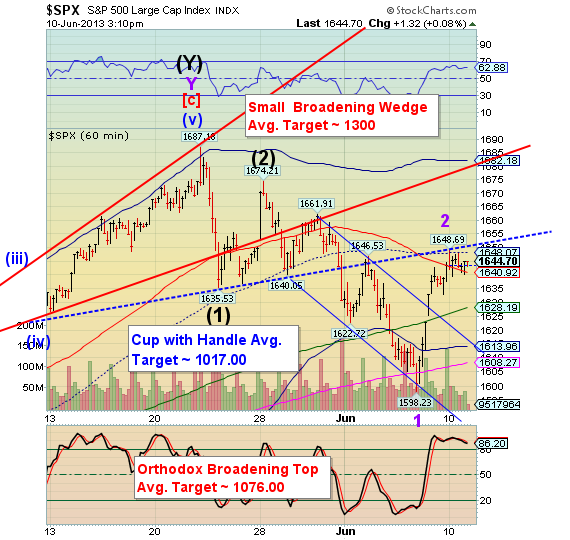
SPX behaved as expected today, stopping at mid-Cycle resistance and the Lip of its Cup with Handle. The sell-off may now begin. The institutional traders will be coming into play this hour, so be alert to what is going on.

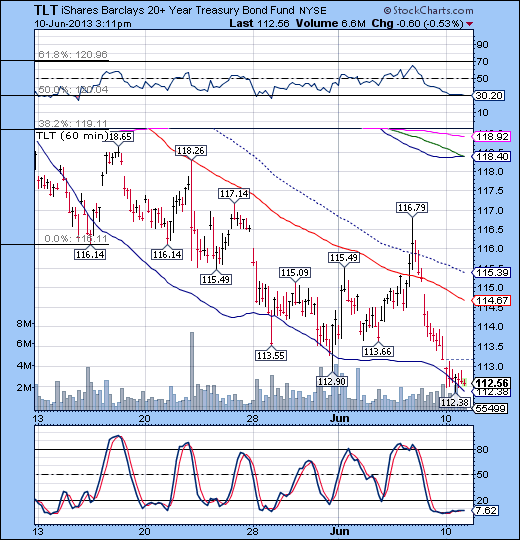
TLT continues its decline. I suspect that we had a Master Cycle low on May 31 in TLT and June 4 in USB. If so, that was a very quick and bearish bounce, lasting a little over 3 days (26 hours) in TLT and two days (13 hours) in USB. I have market June 4 as the Master Cycle low in USB (which I follow in the cycles) and will remain alert for any unforeseen changes. However, the June 6 high was a retest of the Cup with Handle formation and agrees with deeper lows to come in the Long Bond. This may be the undoing of the Fed.

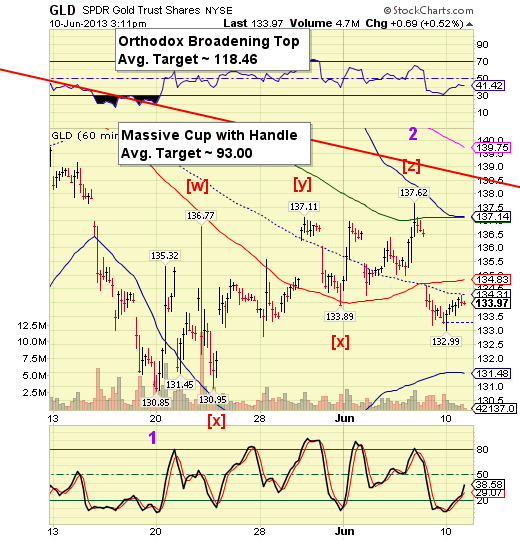
GLD may have put in its final high for the summer on June 6, leaving the door open for a probable two-month decline into its Master Cycle bottom in late July or early August. If you think the decline from April 4 to April 16 was bad, then I have news for you! The next two weeks may be as bad or worse.

See the original article >>

Yen Soars Most In Over Three Years, Nikkei Futures Plummet

by Tyler Durden

Two days ago we made a very simple observation: "Whenever Goldman openly commands the muppets to buy, you know the situation is serious, and Goldman has a lot of unwinding to do. Which is precisely what just happened following the Squid's reco to buy Nikkei September futures (NKU3) ahead of the BOJ meeting. What is Goldman's thesis in a nutshell: hope may be fading in Abenomics, but the "incentives for Governor Kuroda to use the [upcoming BOJ] meeting to signal a firmer and clearer commitment to the easing course, and to highlight the potential to do more, are high and rising." In other words, please bet the farm on more of the same jawboning that lead to a 20% loss for anyone who bought as recently as 2 weeks ago. Oh, and by the way, complete the sentence, whenever a client is buying from a Goldman flow trader, the Goldman flow trader is [____]." The answer, by the way, was "selling", as any muppet who may have taken Goldman's most recent advice just found out.

Overnight, following the disappointing BOJ announcement which contained none of the Goldman-expected "buy thesis" elements in it, things started going rapidly out of control, and culminated with the USDJPY plunging from 99 to under 96.50 as of minutes ago, which was the equivalent of a 2.3% jump in the Yen, the currency's biggest surge in over three years. Adding insult to injury was finance ministry official Eisuke Sakakibara who said that further weakening of yen "not likely" at the moment, that the currency will hover around 100 (or surge as the case may be) and that 2% inflation is "a dream." Bottom line, NKY225 futures have had one of their trademark 700 points swing days, and are back knocking on the 12-handle door. Once again, the muppets have been slain. Golf clap Goldman.

Of course, all of the above wouldn't be quite as hilarious if one didn't keep the following primary objective of the Bank of Japan in mind:

Price Stability

The Bank of Japan Act states that the Bank's monetary policy should be "aimed at achieving price stability, thereby contributing to the sound development of the national economy."

Price stability is important because it provides the foundation for the nation's economic activity. In a market economy, individuals and firms make decisions on whether to consume or invest, based on the prices of goods and services. When prices fluctuate, individuals and firms find it hard to make appropriate consumption and investment decisions, and this can hinder the efficient allocation of resources in the economy. Unstable prices can also distort income distribution. For example, in times of high inflation, people holding only financial assets whose value is fixed in nominal terms, such as bank deposits, will suffer a decline in the value of these assets in real terms.

Funny, nowhere in the above does it say "maximizing year end bonuses for Goldman traders and partners"...

There was little else notable with the world's attention now focusing on the German Constitutional Court's hearing of the constitutionality of the ECB's OMT operation. Spoiler alert: nothing will happen. Why? Because the biggest beneficiary of the ECB's generosity is not Greece, not Italy, not Spain. The beneficiary is best captured by the following chart (hint: DB stands for Deutshce Bank):

The key overnight news bulletin highlights, via Bloomberg:

  • Treasuries fall as JPY surges as much as 2.3% vs USD after BoJ kept its stimulus unchanged and refrained from expanding tools to address bond-market volatility.
  • BoJ left unaltered its one-year fixed-rate loan facility and plan for JPY60t-70t annual rise in monetary base; Governor Kuroda said the central bank will discuss longer funding operations if they become necessary
  • Turkish riot police retook Istanbul’s Taksim Square, the center of nearly two weeks of unrest, from anti-government activists today, using tear gas and water cannons to break pockets of resistance
  • The Turkish central bank said it will tighten monetary policy to support currency
  • Former Goldman Sachs Asset Management chairman Jim O’Neill said investors should get used to U.S. yields nearer 4% than 2%, sees recovery of “equity culture” and end to bond market rally
  • The ECB’s OMT bond-buying plan may force Germany’s top court to choose between market stability and the principles of democracy, lawyers for political groups that oppose the plan said at a hearing; court will consider the case starting today
  • Germany’s finance minister Schaeuble said the ECB can’t be targeted in a German court; ECB’s Draghi said he trusts the constitutional court
  • Citigroup could lose as much as $7b on currency swings if Portales Partners analyst Charles Charles Peabody is right, putting the analyst at odds with peers who say the stock will be the best performer among big U.S. banks in the year ahead
  • U.K. industrial production unexpectedly rose in April, boosted by increased output at oil and water companies. Manufacturing fell after gains in February and March
  • Sovereign yields surge. Nikkei -1.5%; China closed for holiday. European stock markets, U.S. equity index futures gain. WTI crude, metals fall

SocGen's FX team lays out the key macro events:

The week got off to a calm start for financial markets, but will the German Constitutional Court hearings unsettle them today?

German Finance Minister Schaeuble, ECB member Joerg Asmussen and Bundesbank President Jens Weidmann will speak. The question is whether Germany will consider the ECB's Outright Monetary Transactions (OMT) program constitutional, given that the country is attempting to limit its potential commitment in the event OMT is activated. Although the German position has been known for a long time, any move to block the process could prompt tension on peripheral yields. We note that 10Y Bonos and BTPs yields increased last week, as the ECB indicated that it was in no hurry to activate OMT or use other non conventional measures. Although fire walls were put in place last year to contend with the euro debt crisis, they still have not been tested: until proven effective, the euro debt crisis will remain a downward risk factor for the EUR.

Turning to the UK, we will be looking out for industrial production data: any positive surprise will continue to put off further Quantitative Easing by the BoE. Could the EUR/GBP rapidly fall back to recent lows of 0.8430/0.84? That is the main risk.

* * *

DB's Jim Reid concludes the overnight event recap:

The Japanese central bank wrapped up its two-day policy meeting overnight by sticking to its target of increasing the monetary base by JPY60-70 trillion a year and keeping other policy unchanged. In what is likely to disappoint those looking for measures to stem to the volatility in JGBs, the BoJ refrained from making any reference to extending the duration of fixed-rate fundsupplying operations, as was expected by some forecasters. Also in terms of JREIT and ETF purchases, the BoJ refrained from expanding the pace of purchases which will likely disappoint equity markets. The central bank left the door open to future changes though, saying that it will “make (policy) adjustments as needed”.

The immediate market reaction following the BoJ’s policy statement saw the USDJPY and Nikkei futures lose 1% and 2.5% respectively but both have recovered some losses since. Japan 30yr yields are now unchanged after initially spiking 2bp. In its outlook, the BoJ described the economy as being on a moderate recovery path and that some indicators suggest a rise in inflation expectations. In terms of other measures, the BoJ said that it will disperse loans totalling JPY3.15trillion to 70 financial institutions under a scheme to help stimulate bank lending.

This all follows a remarkably steady session yesterday where the S&P500 closed broadly unchanged (-0.03%) after spending virtually all of the session range-trading within 4pts of its closing level of 1642.8. Sentiment in equities was buoyed at the open after S&P announced that it had changed its outlook on the US sovereign rating to “stable” from “negative”. S&P appeared to dampen the notion that the US could regain its AAA rating soon though, noting that no sovereign has ever recouped its AAA rating in less than 9 years. Indeed, it took Finland and Canada nine years to return to AAA according to the agency. S&P expects that net general government debt as a share of GDP will stabilise at around 84% for the next few years, allowing policymakers some additional time to take steps to address pentup age-related spending pressures.

Outside of equities, fixed income asset classes were again pressured by the rise in rates after 7yr, 10yr and 30yr UST yields hit fresh 1 year highs yesterday. This came despite dovish comments from St Louis Fed president James Bullard who said that he would support the continuation of QE in its current form if inflation remains below the Fed’s 2% target. Bullard said he wants “to see some reassurance” from inflation data “before we start to taper”. With the rates backdrop, protection in the major credit indices remained fairly well bid with CDX IG (+3bp), European iTraxx (+2.4bp) and Crossover (+14bp) all wider on the day while cash markets traded with a softer tone.

On a related note, EM weakness remains one of the main market themes globally. Mexican peso bonds are garnering a fair amount of attention following yesterday’s selloff that saw 10yr mbono yields add 17bp to close at 5.66%. The magnitude of the selloff has caught a number of investors off guard. Foreign holdings of fixedrate peso bonds reached a 13yr peak of 58% of outstanding in May 7th, around the time that 10yr yields reached their a record low of 4.43%. Since that point, 10yr yields have sold off by almost 120bp as foreign investors trim positions in a market that has been described as “one-directional”. The fact that the Mexican peso is 7.8% weaker during the same time frame is not helping matters for foreign investors either. The Mexican finance ministry will be auctioning 3yr, 5yr and 30yr bonds today as is probably worth looking out for.

Elsewhere Asian credit spreads are another leg wider overnight as the pressure continues to build. The Asia iTraxx IG index is 10bp wider on the day as we type and is about +40bp off its recent tights in early May. Indonesia and Philippine 5-year sovereign CDS are also 18bp and 15bps wider respectively in overnight trading and have now widened by about 60bps and 20bp since Bernanke’s JCE testimony on the 22nd May. Indonesia 10yr local rates are about 25bps higher overnight at 6.60% or about 110bps more than where they were a month ago. In corporate credit Asian HY is generally about 1pt lower overnight.

Elsewhere in Asia, equities are trading with a cautious tone with the Hang Seng (-0.8%) and KOSPI (-0.6%) seeing moderate losses. The Australian dollar is 0.5% weaker against the USD after disappointing housing finance numbers, extending its two month losing streak against the USD to almost 11%.

Turning to the day ahead, attention will turn to the German constitutional court’s hearings on the ECB’s OMT programme which will be attended by the Bundesbank’s Jens Weiddman and the ECB’s Joerg Asmussen. The two-day hearing begins today. The US data calendar features wholesale inventories, JOLTs job openings and the NFIB business optimism survey. The market's reaction to the BoJ and the price action in EM will likely dominate the agenda though.

See the original article >>

5 Biggest IPO Fails in History

By tothetick

There’s always a lot of fanfare when it comes to Initial Public Offerings. The bunting is brought out, the trumpets sound, the people stand up with killer actor and actress smiles and the champagne is popped at the New York Stock Exchange.

Then? Sometimes, the hype works, the people are still popping the fizz. But, sometimes, even when the company is doing wonders before being launched on the stock exchange, it suddenly goes all nightmarish on Wall Street and the price just belly-flops instead of doing a super-duper double flip.

But, who knows, when you jump into the deep blue unknown of the stock market what is actually going to happen? Or rather, who knows, sometimes, what people out there in the market will find out about your company the day it goes public. Then it really does hit the fan, big time!

Here are the worst IPO fails of all time in the world. The ones that we thought would be unfailingly good. The ones that we thought we could bet our bottom dollar on and still strike it rich. But, the unpredictability of the market, failing to show through brought the image of these companies to their knees when the stock prices crashed as the doors of the stock exchanged opened, and the shares flowed out like water going down the plug-hole!

1.       Facebook

Facebook

Facebook

In 2012, Mark Zuckerberg launched Facebook in a $16 billion IPO. Initially the company had filed for a $5 billion IPO and the company had been valued at $104 billion (which was incidentally the largest evaluation ever in the history of new public companies). Each share was worth $38. Shares struggled to keep their head above water on the opening of trading on May 18th, but surprisingly there were 460 million shares changing hands and that was the largest ever trading volume for an IPO. It was discovered that Morgan Stanley, JP Morgan and Goldman Sachs, the underwriters for Facebook’s launch had cut their forecast earnings for Facebook.

The stock was free-falling and the only thing that stopped it was the circuit breaker or the trading curb (when the stock market stops trading for a while due to too-heavy falls in the price of stock). Trading curbs were set up after Black Monday in order to prevent panic-selling taking place. Had there been no use of this, we would have said goodbye to Facebook. Could we have lived without it?

After the first day of trading and the investigation by the Financial Industry Regulatory Authority (FINRA), it was discovered that there had been technical hitches and glitches with the systems and when people had tried to sell, it was impossible for them to do so, as they were being delayed. When the sales went through, they ended up losing even more money. It was said that the scheme was nothing more than artificial inflation of the price of the stock. The stocks were ‘chop stocks’ or microcap-stock fraud.

Legal action was taken as a consequence against Morgan Stanley for having provided certain people with adjusted figures on earnings for Facebook. It was called a ‘fiasco’ by the Wall Street Journal.

Today Facebook has a stock value of $24.33, which is way below the initial $38. But, it’s better than it was. At the end of 2012 Facebook was trading at just half of that, so it lost half its market value. But, now it has added on 50% to what it lost. It’s currently worth in the region of $67 billion. But, that’s still enormous volatility in movements. What’s going to happen next? Maybe the other flops have the answer?

2.       eToys.com

etoys.com

etoys.com

eToys wasn’t always a dismal failure. It was once at the top of the toy market, competing with Toys ‘R’ us and the others and giving as good as they could get. Then the Lego just fell apart and eToys was forgotten going into Chapter 11 in 2001. It was Goldman Sachs that was the head underwriter this time for the floatation.

The prices of a share should have been somewhere around the $10-$12-mark on opening in 1999. But, the final offering ended up at $20. It soared as the price of its shares reached $77 at the close of business on the first day. Child’s play, right? Those same shares ended up being worth just $0.09 when things went topsy-turvy and the shareholders started dumping the stock big time. What went wrong? Over-investment in advertising and also putting too much money into warehouses, while failure to keep up with orders at Christmas-time. The public is rarely forgiving when little Johnny doesn’t get his toy train on time.

3.       Pets.com

Pets.com

Pets.com

Pets.com is another one that rolled over and died with its legs in the air. It opened shop in 1998 and lasted just over two years. It had a high profile and it drew enormous attention, quickly becoming almost a household-name. $300 million in investment capital went up in smoke as Pets.com went down the tubes and closed shop. It raised $82 million for its IPO and shares were at $14. But, whoever was working for them got it all wrong. They undercharged shipping costs and sold most of their products at cost-price or for less than it actually cost to produce them (sometimes at up to 1/3 of the price). Shares fell to a record low of just $0.19, ruining both the company and the investors.

4.       Vonage

Vonage

Vonage

Vonage is a voice-over IP network. It still exists and is one of the few that managed to scrape through even though it hit rock bottom. It went public in 2006 at a share price of $17. It dropped by over $23% in just that first day and ended up at $13. It was the worst for any IPO up until 2006. Looks like it’s always the worst so far, but sometimes it can get much worse with the next one waiting round the corner. The good thing about records is that they are there to be broken! Share sales weren’t going through and it was down to a technical glitch once again! Went they went through, they were ruining the sellers. That was for the sellers. For the buyers however, it was whole different kettle of fish. The glitch in the system meant that buyers weren’t able to buy. But when they did, they were told that they had to stick to the original share price. Any voice-over IP network that can’t get its act together isn’t worth its weight in anything, is it really? The company currently has over 2.5 million subscribers.

5.       LastMinute.com

LastMinute.com

LastMinute.com

LastMinute.com is still around too, but only by being bought up itself at the last minute by Travelcity in 2005. LastMinute.com is specialized in anything that you can buy at the last minute from cheap airline tickets to the theatre tickets for the show you always wanted to see. At its peak it had 500, 000 visitors per day. Pretty good in terms of concept. Others thought so too as its original share price of 380p on the London Stock Exchange valued the company at £571 million. Shares rose by 28% on that first day to 511p. But within a few months the shares were only worth 190p which was half the value at the start. LastMinute.com wiped off £35 billion in just one day at one point. The company went from bad to worse. Pre-tax profits in November 2003 were only £200, 000, while analysts had expected £4 million. The company got bad publicity from unhappy customers on the net and it used a policy of negative option selling (unless customers un-ticked boxes for things like insurance, etc., then the sale for that item automatically went through).

This is just the top few companies that have failed beyond our wildest expectations. We thought they were the top companies, doing so well, that they would float upwards and upwards. But, what goes up must come down, someone once said. These companies came down with a thud sometimes. Few have managed to stick it out to the bitter end. But, that’s business! We are all in in it for that, aren’t we? Should try to remember though, that one false move and the sniper (read: customer) will be waiting to know you down and then it’s downhill free-falling until you hit the bottom. Only the best have managed to stick it out.

Something obviously was amiss when these companies were floated. Something went wrong either before with the over-evaluation of their stock, or during with the glitches and the system failures, or after with the over-spending and ‘I’m-the-king-of-the-castle’ attitude. Nobody(s the king of the castle unless the customer says so, right?

What do you think these companies did wrong?

See the original article >>

Low coffee price leaves farmers swallowing losses

by Agrimoney.com

The International Coffee Organization raised doubts over a revival in the premium of arabica coffee over robusta beans, as it cautioned that the weak market had cut prices below the cost of production.

The intergovernmental group acknowledged some recovery in the arabica premium last month, by 1.7%, from April levels which at one point fell below 40 cents a pound – less than half the gap a year before.

The small revival has been attributed to improved prospects for coffee crops in Vietnam, the top producer of robusta coffee which, in generally being considered of lower quality than arabica, trades anyway at a discount.

However, the ICO, flagging that the "the structure of the market has changed significantly", cautioned that the arabica premium would struggle to make much more headway, echoing comments on Monday from Macquarie.

Emerging market demand factor

Arabica prices faced pressure from "the new reality of a greatly diminished on-off cycle in Brazil", the top producing country, which is seeing a reduction in the swings it sees between alternate higher and lower harvest years.

"The possibility of increased carry‐over stocks, is resulting in a more constant availability of arabicas year on year," the ICO said.

"Parallel to this is the sustained appetite for robustas," evident in a "negligible increase" in certified stocks held for delivery against London futures "despite the strong levels of shipments coming from Vietnam".

The ICO attributed the rise in demand for robusta from the growth in demand for coffee in emerging markets, which prefer the soluble coffee typically high in robusta content.

"Given these developments, the current range for the arabica/ robusta arbitrage could be expected to continue in the short‐term."

Production costs rise

The comments came as the group cautioned that the decline in coffee prices - which have more than halved over the past two years for New York-traded arabica futures - was causing financial hardship among producers.

Although world arabica exports have remained stable at 8m-10m bags a month over the past two years, revenues from this trade has slumped from more than $2bn to about $1.5bn.

Meanwhile, "the cost of production has been rising in many exporting countries" particularly in Colombia – which this year witnessed demonstrations by producers over low prices - where they have soared nearly 150% since 2004.

"There is concern that many producers may be selling at a price which is not remunerative compared to the cost of production.

"Whether the price paid to coffee growers has dropped below the cost of production will vary from country to country, but the trend appears to be heading in that direction."

See the original article >>

Japan central bank keeps extreme easing steady

By ELAINE KURTENBACH

TOKYO (AP) — Japan's central bank ended a two-day policy meeting on Tuesday with an upbeat assessment for the world's No. 3 economy and a pledge to persist with its aggressive monetary easing policies aimed at ending years of growth-sapping deflation.

The Bank of Japan refrained, however, from taking further action to curb unusual volatility in the market for Japanese government bonds that has raised concern over the potential impact of Prime Minister Shinzo Abe's economic strategies on the country's rising public debt.

"Japan's economy has been picking up," the central bank said, supported by government and consumer spending.

The stronger assessment followed a revision of data to show growth recovered to 4.1 percent in January-March, raising hopes that Prime Minister Shinzo Abe's heavy-spending recovery strategy may be helping end a two-decade-long slump.

However, data remain mixed. Data released Tuesday showed machinery orders fell 7.4 percent in May from a year earlier. Orders by domestic companies fell 11.2 percent, while overseas orders dropped 5.7 percent.

The central bank's assessment was that corporate fixed investment in factories and equipment "appears to have stopped weakening." A recovery in such investment, and in hiring and wages, would be crucial for a sustained recovery from over two decades of economic stagnation, but most businesses remain wary of sinking more money into Japan at a time when its population is aging and shrinking.

To encourage more investment, the government plans to draw up plans for tax reform by the autumn, when it is due to decide whether the recovery is strong enough to endure the blow to demand from sales tax hikes due in 2014 and 2015.

The tax increases are needed to cope with a growing public debt that already is more than twice the size of Japan's economy.

While Abe's "Abenomics" economic policies have helped boost share prices and raised hopes for a sustained recovery, the central bank remains far from its target of achieving 2 percent inflation within the next two years.

Prices have continued to fall despite aggressive efforts to counter deflation by doubling the monetary base, the central bank said, though it added it expects the rate of change in the inflation benchmark to "gradually turn positive."

The bank noted, however, a "high degree of uncertainty" for Japan, as well as the U.S., Europe and emerging economies, and lackluster activity in Japanese manufacturing.

See the original article >>

Stocks slide in Asia as Japan holds policy steady

By ELAINE KURTENBACH

TOKYO (AP) — Stock markets slid Tuesday in Asia, as Japan's central bank ended a policy meeting with no fresh stimulus or moves to curb bond market volatility.

Uncertainty also weighed on emerging markets in Asia, with mainland China's financial markets closed for a national holiday following the weekend release of discouraging data for the world's second largest economy.

Japan's Nikkei stock index fell 1.1 percent to 13,354.60 a day after soaring 4.9 percent following an upward revision of first quarter economic growth data.

A statement issued by the Bank of Japan at midday called for no major policy changes but reiterated its expectation for a moderate recovery in coming months, noting an improvement in exports and resilient demand in Japan.

However, the central bank offered no new monetary easing or measures to curb volatility in government bond prices that has alarmed some in recent weeks.

Regionally, an overnight decline on Wall Street weighed on sentiment, while investors in Hong Kong awaited the reopening of China's markets on Thursday, following the Dragon Boat festival.

"During the holiday, the data from China was not so good. It was below market expectations, so investors are waiting," said Linus Yip, a strategist at First Shanghai Securities.

Hong Kong's Hang Seng index was down 1.1 percent at 21,389.09, while Korea's KOSPI slipped 0.7 percent to 1,919.33. Shares were lower in Taiwan, the Philippines, Indonesia and Singapore but rose in Australia.

A decision by the Standard & Poor's ratings agency to raise its outlook Monday for its credit rating on the U.S. government's long-term debt did little to boost spirits, as the Dow Jones industrial average slipped 0.06 percent, or 9.53 points to 15,238.59. The broader S&P 500 index was down 0.03 percent at 1,642.81

In Europe, the FTSE 100 index of leading British shares edged down 0.2 percent to 6,400.45 while Germany's DAX rose 0.6 percent to 8.307.69. The CAC-40 in France fell 0.2 percent to 3,864.36.

Over recent weeks, investors have grown fearful that the Federal Reserve will reduce the amount of financial assets it buys in the markets — so-called tapering.

The prospect of unchanged Fed policy in the near-term, which became more likely last week following the release of strong job numbers, has weighed on the dollar. The euro rose to $1.3270 from $1.3261 late Tuesday in New York. The dollar fell to 98.18 yen from 98.70 yen.

Oil prices held steady, with the benchmark rate down 2 cents at $95.75 per barrel in electronic trading on the New York Mercantile Exchange. The contract fell 26 cents to close at $95.77 per barrel on the Nymex on Monday.

See the original article >>

China’s Cold Eye on Hot Money

by Zhang Monan

BEIJING – With China feeling the pressure from large-scale inflows of short-term capital, the State Administration of Foreign Exchange (SAFE) issued a notice in early May outlining a set of measures aimed at controlling “hot money” and reducing external risks. Indeed, the new regulations are essential to managing the renminbi’s rapid appreciation and ensuring the accuracy of trade data. But will they be enough?

This illustration is by Paul Lachine and comes from <a href="http://www.newsart.com">NewsArt.com</a>, and is the property of the NewsArt organization and of its artist. Reproducing this image is a violation of copyright law.

Illustration by Paul Lachine

A variety of data indicates the massive scale of the inflows. In the first quarter of this year, Chinese banks’ foreign-exchange purchases skyrocketed to a record ¥1.2 trillion ($195 billion) – more than double last year’s total. Such purchases increased by some ¥294.3 billion from March to April, which was the fifth consecutive month of growth.

Over the same period, China’s foreign-exchange reserves swelled by $128 billion, to $3.4 trillion – the largest quarterly increase since 2011 and equal to the total rise in 2012. Given China’s $43 billion trade surplus and $30 billion in foreign investments during this period, capital inflows must have been a contributing factor.

Furthermore, since the beginning of this year, Chinese banks’ valet foreign-exchange settlement (foreign-exchange purchases that designated banks make for their clients and themselves) has outstripped corresponding sales, resulting in a consistently large surplus – also an indication of increased capital inflows. The difference, which banks offset through transactions in the inter-bank currency market, has a significant impact on China’s foreign-exchange reserves, but is not equivalent to the net change in foreign-exchange reserves during the same period.

According to SAFE, individuals and institutions exchanged $152.2 billion in foreign currency for renminbi through Chinese banks in March, and purchased $107.6 billion in foreign currency from financial institutions. As a result, the banks’ foreign-exchange surplus reached $44.6 billion, rising 38% from February and marking the seventh consecutive month in which bank-to-client transactions created a surplus.

The consequences of abnormal capital flows into China are becoming increasingly apparent, particularly in foreign-exchange markets. Despite slowing GDP growth – currently only 7.7% annually – the renminbi has appreciated rapidly, reaching a record-high central parity of 6.2082 against the US dollar at the beginning of May.

With no sign of improved economic fundamentals, the renminbi’s rapid rise must be related to substantial foreign-currency inflows. Since China’s current benchmark interest rate is higher than the comparable rate in the United States, individuals and institutions have an incentive to keep renminbi as assets and dollars as debt. The current round of monetary easing underway in many advanced countries, together with strong expectations of renminbi appreciation, are also fueling currency speculation, placing further upward pressure on the exchange rate.

The new SAFE regulations will attempt to curb this trend by imposing, for the first time, limits on net open positions held by Chinese banks with foreign-currency loan/deposit ratios (LDRs) exceeding 75% and by foreign banks with LDRs above 100%. A higher foreign-currency LDR will mean tighter restrictions on long renminbi positions. By providing an incentive for banks to hold more foreign-exchange deposits against their loans, the new rules will drive up the price of foreign-currency loans, thereby deterring firms from using dollar loans to speculate on renminbi gains.

Although the regulations did not take effect until June 1, their impact was felt immediately. The renminbi ended its upward trend against the US dollar on May 6, closing at 6.1667, down 112 basis points from the previous trading day – the steepest decline since last December. On the same day, stricter controls on capital inflows caused the offshore renminbi to close at 6.1790 against the US dollar, down 0.4% – the largest drop since January 2012. This suggests that the measures will succeed in stemming upward pressure on the renminbi.

At the same time, the new regulations aim to end many firms’ practice of channeling capital into China disguised as trade bills. By inflating export deals in order to move foreign currency – mostly US dollars – into China, firms have evaded capital controls and distorted trade data. In order to transform the funds into renminbi outflows, the firms then increase the scale of renminbi settlements in cross-border trades. In March and April, cross-border renminbi trade settlement increased by ¥412.8 billion, up 57.6% year on year.

The growing discrepancies between foreign-trade data and port data have cast doubt on the reliability of the former. Last year, China’s exports grew by roughly 6.2%, and container throughput completed at China’s above-scale ports increased by 6.8% year on year.

By contrast, in the first quarter of this year, Chinese foreign trade increased to $974.6 billion, reflecting a higher growth rate than in 2012, while Chinese ports completed 800 million tons of cargo throughput, representing a growth rate that was 4.2 percentage points lower than in the same period last year. In March, container traffic at China’s above-scale ports was 15.29 million TEUs (twenty-foot equivalent units), with month-on-month growth 1.7 percentage points slower than in the previous two months.

Clearly, trade data are being inflated as companies carry out fake transactions to bring capital into the country. Firms know that as long as the hot money can reach mainland banks through Hong Kong, they can expect risk-free yields of more than 2%. Considering the renminbi’s recent appreciation, the rate of return could reach 3-4%.

According to the new regulations, SAFE will issue a warning ten days after finding that a firm’s capital flows do not match its physical shipments. Such firms will be more closely monitored for at least three months, until the relevant figures return to normal.

One can only hope that these measures will be sufficient to bring China’s export data gradually back to reality. At a minimum, the new measures are an important step toward improved management of cross-border capital flows, which is bound to benefit China’s economic transformation and restructuring significantly.

>">See the original article >>

Negative Earnings Guidance Weakest Since Q1 2001

by Cullen Roche

Second quarter earnings season officially starts in a few weeks and things are all set to get off to the usual “under promise” and “over deliver” environment that sets the mainstream media in a frenzy over the high level of earnings beats.  This earnings season will be particularly easy to “beat” given that earnings guidance is coming in extremely weak.  According to Thomson Reuters this is the weakest quarterly guidance since Q1 2001:

Second-quarter earnings guidance looks extremely weak, with 93 of the 116 preannoucements negative. The healthcare sector has the most negative N/P ratio, and the consumer discretionary sector is also very negative.

With the first-quarter earnings season mostly complete, investors are anticipating second-quarter earnings results. First-quarter earnings growth is currently at 5.0%, up from the 1.5% that analysts were predicting at the beginning of earnings season. Second-quarter earnings expectations are similarly low, with 2.8% growth currently forecast. This is down from the 6.1% estimate from the beginning of April. While some of the decline is likely due to the normal seasonal estimate revision pattern, company-issued guidance has not helped.

Of the 116 second-quarter earnings preannouncements given by S&P 500 companies, 93 of them have been negative, while only 14 have been positive. The resulting 6.6 negative to positive guidance ratio is the most negative since the first quarter of 2001. As seen below in Exhibit 1, the recent trend has been toward more negative preannouncements as earnings growth has slowed. While there is still more guidance to come as the second-quarter earnings season approaches, the N/P ratio as it stands is significantly more negative at 6.6 than for the first quarter, which itself was the most negative since Q3 2001, at 4.3. Over the long term, there have been 2.4 negative preannouncements for each positive one.

ER_Chart1


See the original article >>

Follow Us