Monday, July 25, 2011

Volatility may drive soy futures near record high

by Agrimoney.com

Soybean futures are to lose the stability which has marked the first half of 2011, and potentially approach record highs, as buyers compete for diminishing supplies.
Rabobank analysts, while saying it was likely that Chicago soybean futures would follow grains lower in the rest of 2011, lifted by $0.50 a bushel to $13.25 a bushel its forecast for prices of the oilseed in the last quarter of the year.
And higher volatility, fostered by a second year of falling world production at a time of buoyant demand, could yet see prices come close to the all-time high of $16.63 a bushel reached three years ago.
"The type of price movements we expect to see are in stark contrast to the narrow trading range of less than $2.00 a bushel witnessed during the first half of 2011," the bank said.
"In a worse-case [sic] scenario for US soybean production, we not the potential upside in excess of $16.00 a bushel should the US crop conditions continue their rapid descent."
'Signs of stress'
The proportion of the US soybean crop – the world's biggest - rated as in "poor" or "very poor" health has already reached 10%, the highest for this time of year since 2008-09, when the yield ended up at just below 40 bushels per acre.
The US Department of Agriculture is, for this year's harvest, forecasting a domestic yield of 43.4 bushels per acre.
"The late-planted crop is already showing signs of stress", the bank said, highlighting risks of disappointing production in Argentina, China and India too.
'Demand-rationing mode'
Meanwhile, demand is being spurred by record-high margins for manufacturers of biodiesel from soyoil, and by a return to positive margins for soybean crushers in China, the top soybean importer.
"Already more than 20% of the expected US soybean export volume for 2011-12 has been sold - a record-large amount for this time of year," Rabobank said.
This implied an export programme 30% above the USDA's current estimate of 40.7m tonnes – in contrast to a downgrade the department made two weeks ago to its forecast for shipments.
"This pace of both domestic and export demand will not be sustainable for a rapidly-shrinking US soybean crop.
"Soybean prices must transition into demand-rationing mode."
'Large speculative inflows'
The comments come as speculators appear to be renewing their interest in the oilseed, with non-commercial investors – a grouping which include hedge funds – near-doubling to 78,000 contracts their net long position in Chicago soybeans, official data late on Friday showed.
This represented the highest net long position for three months.
"The soybean complex saw large speculative inflows," Australia & New Zealand Bank analysts said.
"Speculative interest in the soybean complex leapt higher on the back of increased spreading and outright longs in soybeans and soyoil."

See the original article >>

The Perverse Politics of Financial Crisis


In trying to understand the pattern and timing of government interventions during a financial crisis, we should probably conclude that, to paraphrase the French philosopher Blaise Pascal, politics have incentives that economics cannot understand.

From an economic point of view, the problem is simple. When a sovereign borrower’s solvency has deteriorated sufficiently, its survival becomes dependent on market expectations. If everybody expects Italy to be solvent, they will lend to Italy at a low interest rate. Italy will be able to meet its current obligations, and most likely its future obligations as well. But if many people start to doubt Italy’s solvency and require a large premium to lend, the country’s fiscal deficit will worsen, and it will most likely default.

Whether a borrower like Italy ends up in the lap of good expectations or tumbles into a nightmare scenario often depends upon some “coordinating news.” If everyone expects that a credit-rating downgrade will make Italian debt unsustainable, Italy will indeed default after a downgrade, regardless of the downgrade’s real economic effects. This is the curse of what we economists call multiple equilibria: once I expect others to run for the exit, it is optimal for me to run as well; but if everybody stays put, I have no interest in running.

Given this economic dynamic, there seem to be two obvious policy prescriptions. First, it is too dangerous for any country to come even remotely close to the point where insolvency can be triggered by a sunspot. While nobody knows exactly what this danger level is, it is clear where the alarm starts to arise. Given the enormous cost of a default, any government should stay far away from the danger zone.

The second prescription assumes that if, for any reason, a country does end up in the danger zone, only two responses make economic sense. Either officials recognize immediately the inevitability of default and waste no resources trying to prevent it, or they believe that a default can be avoided and deploy all the resources at their disposal as fast as possible. As in many wars, a staged escalation in a financial crisis often leads to the worst possible outcome: a defeat with large losses.

That, unfortunately, is story of the American authorities’ intervention during the 2008 financial crisis. After the collapse of Bear Stearns, it was clear that more problems were coming, yet the United States government did nothing. In July 2008, when Fannie Mae and Freddie Mac (the government-backed housing-loan agencies) were found to be insolvent, then Treasury Secretary Hank Paulson promised a “bazooka,” but delivered what turned out to be a slingshot. It was only after Lehman Brothers collapsed that Paulson went to Congress seeking $700 billion to stabilize the financial system. Even that turned out to be insufficient.

The same travesty appears to be playing out in Europe. If European officials thought Greece needed to be saved, an immediate European intervention in favor of Greece would have minimized the resources required. If they thought Greece needed to go bankrupt, an immediate decision to that effect would have minimized the cost as well. Now we are already at the second rung of intervention, and there seems to be no end in sight. In the meantime, Italy is sinking.

One could argue that politicians behave this way because they do not understand the economic nature of crises. I disagree. I think that what leads them to behave this way is not lack of knowledge, but perverse incentives.

First of all, even for someone with the best incentives, it is difficult to choose a smaller cost that must be paid now over a larger cost that might fall due in the future. For an elected politician who is unlikely to be in office (or even alive) when the bigger costs materialize, the choice is clear. That is why countries build up debt levels that put them in the danger zone.

Second, there is no political reward for fighting a preventive war, while there is great political capital to be earned by acting after problems have exploded. Had Franklin Roosevelt succeeded in preventing the Pearl Harbor attack with a preemptive strike against Japan, we would still be discussing whether war with Japan was inevitable. Roosevelt waited to act until after the catastrophe, and he has been revered as a savior. To act, politicians need consensus, which often does not emerge until the costs of inaction have become highly visible. By that point, it is often too late to avoid a much worse outcome.

These incentives are present in all democracies. They cannot be eliminated, but they can be tempered. The European Stability and Growth Pact was an effort to accomplish exactly that – by creating incentives for eurozone countries to steer clear of the danger zone for debt. Unfortunately, the pact failed miserably. But if the euro is to survive – and if other countries are to avoid sovereign-debt crises of their own – we still need politician-proof rules.

Luigi Zingales is Professor of Entrepreneurship and Finance at University of Chicago Graduate School of Business and co-author, with Raghuram G. Rajan, of Saving Capitalism from the Capitalists.

Default Is Not Such A Horrible Idea At This Point


After a certain point, debt becomes toxic – for a household as well as for a nation. For a nation, Professors Carmen Reinhart and Kenneth Rogoff put that ‘point of no return’ at 90% of GDP. Greece, Japan, and the U.S. – all are beyond that point. America’s gross debt is 100% of GDP. Greece has debt of 120% of GDP. And Japan is off the charts, at 229%.

Reinhart and Rogoff say that once you get past 90% your GDP growth declines by 1%. Sure enough, the U.S. used to run at about 3% annual GDP growth. Now it is down around 2%. Greece, the last time we looked, would be lucky to get any growth at all this year. And Japan, the biggest debtor of all, is actually going backwards with negative growth.

When you are in this situation, by the way, you can’t “manage” it. You can’t ignore it. You can’t turn knobs or adjust levers to make the problem go away. And you can’t grow your way out of it either because the debt suppresses your growth.

All you can do is to get out of debt as soon as possible. Default. Go broke. Chapter 11. Chapter 7. Turn your pockets inside out and your mouth down. Let it be.

Borrowing more money to keep from admitting the truth is disastrous. Europe just proved it.

Word got out last week that Europe had solved its Greek debt problem. As predicted, the authorities cobbled together an odd boot. And now they use it to kick the can further down the road.

But the nice thing is this: it’s now a smaller can. After resisting the inevitable for more than a year, the authorities are finally giving bondholders a 20% haircut.

The debt deal in Europe doesn’t solve the problem. The can will be kicked again. But at least the 20% loss to bondholders reduces its size. It’s now back to about where it was when the euro geniuses first started to kick it down the road!

Naturally, reports of salvation in Europe turned attention to America’s budget troubles.

“Hope for US debt deal,” says The Financial Times headline.

In Washington, of course, the problem is a little different. It’s the central government that needs to be saved – from itself.

I support that narrow fringe of the Tea Party, the tiny part of it not invited to share the cakes and sandwiches, the part that actually wants the US government to default.

Whoa! We know what you’re thinking. A default would be dangerous. Suicidal. Unthinkable. Ben Bernanke. Tim Geithner. Larry Summers. They all said so! The old folks wouldn’t get their medicine. The soldiers wouldn’t get their ammunition. Tops would go back onto honey pots all over the Washington DC area. The whole system would fall into anarchy and pandemonium. There would be riots. Revolution. Bourbon would disappear from the liquor store shelves. The dead would rise from their graves and the living would fall into the open holes. A man would be happy to see his dead wife alive again. Another would be even happier to see his living wife dead!

Well, maybe they’re right. It would probably be a catastrophe. A disaster. But let’s take the chance anyway!
Because the real problem is debt. The quicker it is eliminated…the faster the economy can get back to work.
So, don’t raise the debt ceiling. Let the feds figure out how to get by like everyone else – spending no more than they take in as income. Is that really so tough?

See the original article >>

Market Topography – Sector Review 7/24/11


The study of the surface of the Earth, Topography, reveals all sorts of different shapes and patterns. When these patterns repeat we get insights into hidden features of the planet. For instance the size, range and placement of mountain ranges or volcanic island chains advancing knowledge of plate tectonics. In much the same way the repetition of patterns of price in the markets can reveal similar insights. Reviewing the charts of the Select Sector SPDR Funds shows several distinct patterns this week. Knowing how they have played out in the past gives insights to what to look for going forward. Let’s take a look.

The Bull Flag

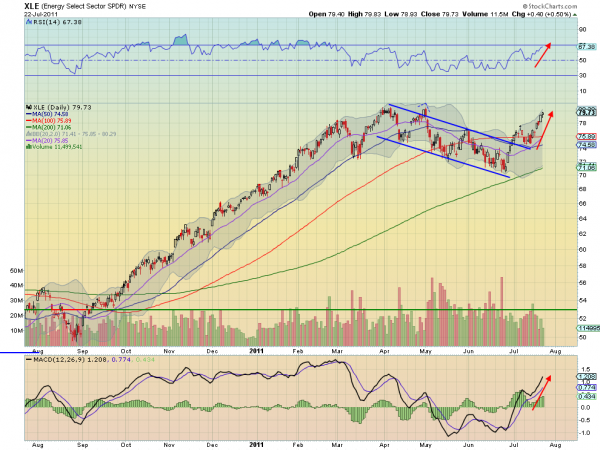
The Energy Select Sector SPDR, $XLE has broken higher out of a 3 month Bull Flag. Like an area of weakness on a mountainside that has eroded away the flag shows minor weakness in what is clearly an uptrend. Often these break outs retest the break point and from the chart below you can see this one has and is now moving higher. Like many continuation Bull Flags the break out higher is

Energy Select Sector SPDR, $XLE
xle3 e1311429871972 stocks
supported by a rising Relative Strength Index (RSI) and an increasing Moving Average Convergence Divergence (MACD) indicator. Note how on the major leg up the price remained above the 20 day Simple Moving Average (SMA) but fell below it during the flag. As it breaks higher it is back above the 20 day SMA. The next move for the $XLE is to resistance at the 80 area and then a Measured Move (MM) from the initial leg higher to a target of 100.

Higher Highs and Higher Lows

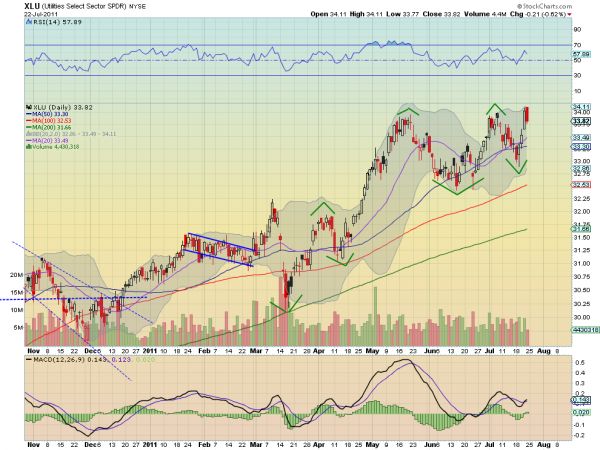
Sometimes looking far off into the distance you can see a series of rolling foothills heading higher into the mountains. Each peak and valley is a bit higher than the last as the path continues higher. This same pattern shows up in two sector charts, the Utilities Select Sector SPDR, $XLU and Consumer Discretionary Select Sector SPDR, $XLY. Looking below at the chart of

Utilities Select Sector SPDR, $XLU
xlu3 e1311430811243 stocks
$XLU shows the series of green tops and bottoms rising as it moves through time. Note that the RSI has spent the majority of its time in bullish territory over the mid line during this dance higher. The candle from Friday, a Dark Cloud Cover, may signal another higher top in the series if it confirms Monday, but eh trend remains higher until a new lower low is created. The $XLY is still heading towards a new high with a supportive RSI and MACD.

Triple Tops

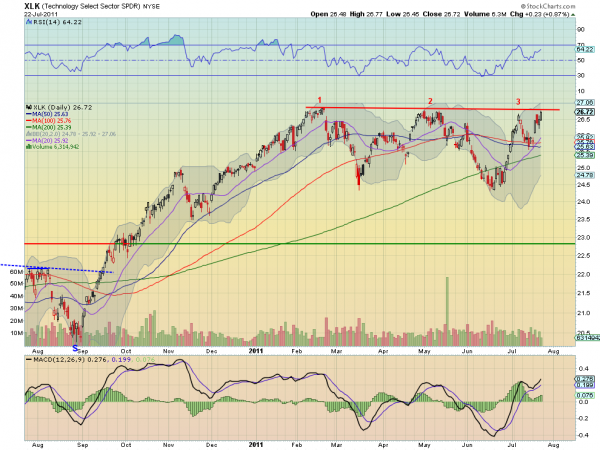
When you get high enough and deep enough into the mountains all of the peaks start to look to be about the same height. Still at lofty levels but no longer running higher. This happens with price action as well in a triple top, as seen in the charts of the Materials Select Sector SPDR, $XLB, Industrials Select Sector SPDR, $XLI, and the Technology Select Sector SPDR, $XLK. From the chart of $XLK below notice that it

Technology Select Sector SPDR, $XLK
xlk3 e1311431609953 stocks
is now approaching a fourth time, but from a higher low and with a RSI that is rising and not yet overbought and a MACD that is growing and not yet losing slope. Unlike the mountains it does not mean that the only future direction is down. It stands a good chance of breaking through the the triple top this time. If it is successful then a new target of 29.50 is established on the MM out of the channel from 24.50 to 27. Failure does not threaten to turn into a downturn unless it then falls under 24.50. The $XLB is similar with the channel between 36 and 41 and break higher establishing a target of 46, and $XLI with a channel between 35 and 38.50 leading to a target higher at 41.

Symmetrical Triangles

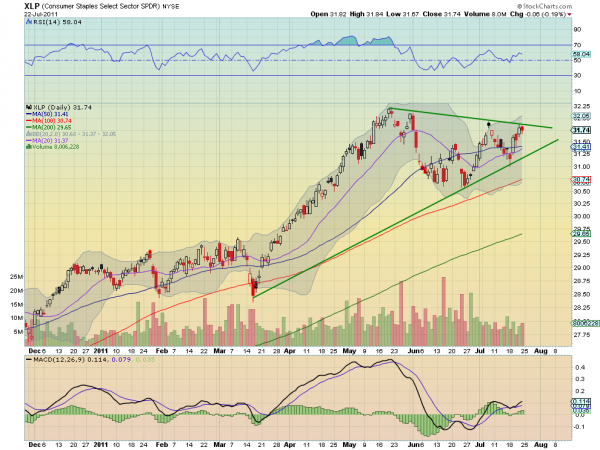
The closest proxy for a symmetrical triangle in Topography would be a cliff face jutting out. It is pointy but through time erosion flattens the point, making the place where a drop from the precipice closer to the base, where the material is stronger. In the charts this the move out of a triangle is rarely at the apex and said to be strongest at the 2/3 point. Three sector charts fit this category heading to ward the apex and getting in the action zone. They are the Consumer Staples Select Sector SPDR, $XLP and the Health Care Select Sector SPDR, $XLV. Using the $XLP to demonstrate, you can see a fourth touch of the

Consumer Staples Select Sector SPDR, $XLP
xlp3 e1311432668428 stocks
top rail approaching after two touches to the bottom rail, which is an extension of trend support back to mid March. Unlike a cliff face, price can also break out higher. A break above the top rail at 31.90 would establish a target of 34.30 out of the pattern, and it has support of the rising RSI and increasing MACD. The $XLV is identical with a break above 36 establishing a target of 39.50.

Double Bottom

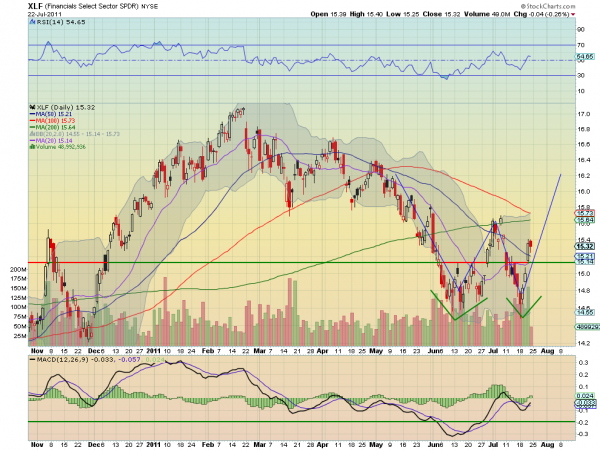
Like the ruts of two canyon channels seen from space a Double Bottom shows the lowest point where ancient waterways carved the floor of a river. And like the Grand Canyon, this does not have to be at a relatively low elevation. The chart of the Financials Select Sector SPDR, $XLF is showing a potential double bottom at 14.60 as see in the chart below. Rising out of that

Financials Select Sector SPDR, $XLF
xlf3 e1311433674799 stocks
bottom now it has some promise for a move higher with resistance at 15.70 and above that the target for a ‘W’ pattern at 16.40. The MACD is crossed positive and the RSI is rising as it attempts higher. Financials have not been participating in the market move higher is this a sign of a change after our journey into the mountains and falling from the cliffs that the new bottom is in?

The Future of Economic Growth


Perhaps for the first time in modern history, the future of the global economy lies in the hands of poor countries. The United States and Europe struggle on as wounded giants, casualties of their financial excesses and political paralysis. They seem condemned by their heavy debt burdens to years of stagnation or slow growth, widening inequality, and possible social strife.

Much of the rest of the world, meanwhile, is brimming with energy and hope. Policymakers in China, Brazil, India, and Turkey worry about too much growth, rather than too little. By some measures, China is already the world’s largest economy, and emerging-market and developing countries account for more than half of the world’s output. The consulting firm McKinsey has christened Africa, long synonymous with economic failure, the land of “lions on the move.”

As is often the case, fiction best reflects the changing mood. The émigré Russian novelist Gary Shteyngart’s comic novel Super Sad True Love Story is as good a guide as any to what might lie ahead. Set in the near future, the story unfolds against the background of a US that has slid into financial ruin and single-party dictatorship, and that finds itself embroiled in yet another pointless foreign military adventure – this time in Venezuela. All the real work in corporations is done by skilled immigrants; Ivy League colleges have adopted the names of their Asian counterparts in order to survive; the economy is beholden to China’s central bank; and “yuan-pegged US dollars” have replaced regular currency as the safe asset of choice.

But can developing countries really carry the world economy? Much of the optimism about their economic prospects is the result of extrapolation. The decade preceding the global financial crisis was in many ways the best ever for the developing world. Growth spread far beyond a few Asian countries, and, for the first time since the 1950’s, the vast majority of poor countries experienced what economists call convergence – a narrowing of the income gap with rich countries.

This, however, was a unique period, characterized by a lot of economic tailwind. Commodity prices were high, benefiting African and Latin American countries in particular, and external finance was plentiful and cheap. Moreover, many African countries hit bottom and rebounded from long periods of civil war and economic decline. And, of course, rapid growth in the advanced countries generally fueled an increase in world trade volumes to record highs.

In principle, low post-crisis growth in the advanced countries need not impede poor countries’ economic performance. Growth ultimately depends on supply-side factors – investment in and acquisition of new technologies – and the stock of technologies that can be adopted by poor countries does not disappear when advanced countries’ growth is sluggish. So lagging countries’ growth potential is determined by their ability to close the gap with the technology frontier – not by how rapidly the frontier itself is advancing.

The bad news is that we still lack an adequate understanding of when this convergence potential is realized, or of the kind of policies that generate self-sustaining growth. Even unambiguously successful cases have been subject to conflicting interpretations. Some attribute the Asian economic miracle to freer markets, while others believe that state intervention did the trick. And too many growth accelerations have eventually fizzled out.
Optimists are confident that this time is different. They believe that the reforms of the 1990’s – improved macroeconomic policy, greater openness, and more democracy – have set the developing world on course for sustained growth. A recent report by Citigroup, for example, predicts that growth will be easy for poor countries with young populations.

My reading of the evidence leaves me more cautious. It is certainly cause for celebration that inflationary policies have been banished and governance has improved throughout much of the developing world. By and large, these developments enhance an economy’s resilience to shocks and prevent economic collapse.

But igniting and sustaining rapid growth requires something more: production-oriented policies that stimulate ongoing structural change and foster employment in new economic activities. Growth that relies on capital inflows or commodity booms tends to be short-lived. Sustained growth requires devising incentives to encourage private-sector investment in new industries – and doing so with minimal corruption and adequate competence.

If history is any guide, the range of countries that can pull this off will remain narrow. So, while there may be fewer economic collapses, owing to better macroeconomic management, high growth will likely remain episodic and exceptional. On average, performance might be somewhat better than in the past, but nowhere near as stellar as optimists expect.

The big question for the world economy is whether advanced countries in economic distress will be able to make room for faster-growing developing countries, whose performance will largely depend on making inroads in manufacturing and service industries in which rich countries have been traditionally dominant. The employment consequences in the advanced countries would be problematic, especially given an existing shortage of high-paying jobs. Considerable social conflict could become unavoidable, threatening political support for economic openness.

Ultimately, greater convergence in the post-crisis global economy appears inevitable. But a large reversal in the fortunes of rich and poor countries seems neither economically likely, nor politically feasible.

Dani Rodrik, Professor of International Political Economy at Harvard University, is the author of The Globalization Paradox: Democracy and the Future of the World Economy.

The $1 Billion Armageddon Trade Placed Against the United States

By Jack Barnes

Someone dropped a bomb on the bond market Thursday - a $1 billion Armageddon trade betting the United States will lose its AAA credit rating.

In one moment, an invisible trader placed a single trade that moved the most liquid debt market in the world.

The massive trade wasn't placed in bonds themselves; it was placed in the futures market.

The trade was for block trades of 5,370 10-year Treasury futures executed at 124-03 and 3,100 Treasury bond futures executed at 125-01.

The value of the trade was about $850 million dollars. In simple terms, if that was a direct bond buy, no one would be talking about it.

However, with the use of futures, you have to have margin capacity behind the trade. That means with a single push of a button someone was willing to commit more than $1 billion of real capital to this trade with expectations of a 10-to-1 return ratio.

You only do this if you see an edge. 

This means someone is confident that the United States is either going to default or is going to lose its AAA rating. That someone is willing to bet the proverbial farm that U.S. interest rates will be going up.

I believe what happened is a debt-ceiling deal was done in Washington and leaked to a major proprietary trader. Everyone knows the debt negotiations in Washington have been an extreme game of brinksmanship between political parties, but now someone knows how that game played out.

This had the hallmarks of one of the largest bond shops in the world knowing something the rest of the market didn't.

The number of shops or even central banks that can take on this level of market risk is extremely small. Some that come to mind are hedge fund manager John Paulson, Bill Gross's PIMCO, and the U.S. and Chinese central banks.

Paulson already scored big - about $6 billion big - on a similar trade years ago when he bet against subprime mortgages, the investments that helped bring down Lehman Bros. and many other investors.

Whoever was behind it wanted a trade on ASAP, and didn't care about the ripples they would cause.

Armageddon trade

You can see how this trade caused fear to be unleashed in the market once it got out and the implications hit by looking at U.S. Treasuries. People who were long 30-year Treasuries panicked as they saw the huge short put on the futures market, and started to unwind their long exposure.

What you, as investors, should do now is look at the bond exchange-traded funds (ETFs) that provide a positive rate of return when U.S. Treasuries drop in value. Yields are going up sooner rather than later, if the person behind this Armageddon trade is correct.

Dollar May Find Lifeline in US Debt Impasse, Global Slowdown Fears


Major Currencies vs. US Dollar (% change)
18 Jul 2011 22 Jul 2011
Dollar May Find Lifeline in US Debt Impasse Global Slowdown Fears body Picture 5 forex

EUR/USD: Euro to Fall with Stocks on US Debt, Global Growth Fears

With sovereign fears on the decline in the Euro Zone after an unexpectedly bold EU leaders’ summit outcome last week, the US debt ceiling fiasco has taken center stage as the core macro-level issue guiding sentiment over the near term. Negotiations on the so-called “Gang of Six” bipartisan initiative that would trim $3 trillion from the shortfall over the next decade broke down on Friday as House of Representatives Speaker John Boehner walked away from negotiations, saying he was unwilling to sign off on tax increases envisioned in the deal. Talks over the weekend appear to have proven no more fruitful. Continued brinksmanship will feed uncertainty and weigh on stock markets, which correlation studies suggest will once again translate into gains for the US Dollar and push EURUSD lower. Needless to say, the emergence of a viable solution is thereby likely to have the opposite effect.

The landscape will be complicated by a busy US economic data calendar, with the Fed Beige Book survey of regional economic conditions and the second-quarter GDP report taking top billing. Evidence of a broad-based slowdown in global growth is piling high as all three leading output engines – the US, the EU and China – show acute signs of weakness. With US output expected add 1.8 percent, marking the softest reading in a year, that narrative will be reinforced further and add to upward pressure on the greenback as market confidence sours. On the local data front, German Unemployment as well as the preliminary set of July Consumer Price Index figures for the Euro Zone’s top economy and the region as a whole headline the calendar.
Dollar May Find Lifeline in US Debt Impasse Global Slowdown Fears body Picture 6 forex
Source: Bloomberg

GBP/USD: Pound Subverted by Risk Aversion, Slowing GDP Growth

While the correlation between GBPUSD and the MSCI World Stock Index remains the most pronounced of the conflicting catalysts driving the British Pound, the domestic data docket seems likely to prove at least as important early in the week as the second-quarter Gross Domestic Product reading crosses the wires. Expectations call for output to add 0.2 percent on a quarterly basis while the annual growth rate slows to a paltry 0.8 percent, the weakest since the UK emerged from the Great Recession a year ago. The result is likely to weigh further on BOE interest rate hike expectations. The risk-averse cues already evident in price action would only find reinforcement from the report, hinting Sterling may find itself facing stiff selling pressure in the days ahead.
Dollar May Find Lifeline in US Debt Impasse Global Slowdown Fears body Picture 7 forex
Source: Bloomberg

USD/JPY: Yen Link to Treasury Yields to Transmit Sentiment Trends

The spread between US and Japanese 2-year Treasury bond yields remains the core driver of USDJPY. With no serious waves likely to be made in the outlook for Japanese rates, this puts the onus on the US portion of the rates differential. As before, this points toward the lingering US debt ceiling debate and the second-quarter corporate earnings reporting season.

Risk aversion emanating from uncertainty amid continued standstill on the US debt front is – somewhat counter-intuitively – drive safe-haven demand for Treasuries and weigh on their yields as prices rise, pressuring USDJPY lower in the process. A palatable solution would naturally produce the opposite effect.
On the earnings front, the reports of growth-sensitive firms such as industrials and basic-materials producers are likely to prove most important, amounting to a referendum on global growth prospects amid increasingly compelling evidence of a slowdown on tap in the second half of the year. For the same reason, Wednesday’s Fed Beige Book survey of regional economic conditions and Friday’s second-quarter US GDP report ought to prove of interest.
Dollar May Find Lifeline in US Debt Impasse Global Slowdown Fears body Picture 8 forex
Source: Bloomberg

USD/CAD, AUD/USD, NZD/USD: Stocks Influence Mixes with Busy Data Calendar

The so-called “commodity bloc” currencies remain firmly anchored to stock markets, reflecting a shared sensitivity to the trajectory of global economic growth expectations. As with the Yen, this puts the US debt ceiling debate and the second-quarter earnings season firmly in focus, with prices tracking the ebb and flow of broad-based risk sentiment.

The Reserve Bank of New Zealand interest rate decision as well as Australian CPI and Canadian GDP figures headline the local economic calendar. The RBNZ announcement seems likely to produce the most fireworks, with the recent string of strong economic data fueling expectations of a hawkish shift in rhetoric that prepares the market for a faster reversal of the 50bps cut enacted in March than the early-2012 assumption everyone had been working on. The Canadian GDP outcome ought to prove telling as well considering recent data has been somewhat mixed of late. Australian CPI is expected to post a modest increase – something already predicted by the RBA – and is unlikely to meaningfully buoy the rates outlook.
Dollar May Find Lifeline in US Debt Impasse Global Slowdown Fears body Picture 9 forex
Source: Bloomberg
Dollar May Find Lifeline in US Debt Impasse Global Slowdown Fears body Picture 10 forex
Source: Bloomberg
Dollar May Find Lifeline in US Debt Impasse Global Slowdown Fears body Picture 11 forex
Source: Bloomberg

Dollar Index Setting Up For Further Losses Toward 9350


Dollar Index Setting Up For Further Losses Toward 9350 body dxy7 forex
Even as the Dow Jones FXCM Dollar Index (ticker: USDollar) consolidates in the early week around the 9450 level we effort that now that this support has been taken out and closed below further losses toward the next downside target below 9350 are in the offing. We have talked for some time about the range bound nature of trade in the dollar index and a move back toward the lows by 9350 certainly stretch this range bound theory to its limits but by no means will lead us to a re-think just yet. Naturally, a significant break higher in the next few sessions will negate this outlook and we will once again look upward toward the 9750 region to see if the index can finally break out of its recent range.

While technical analysis is all well and good at such a time we believe that even the biggest techies should keep a keen eye on the fundamental developments which have been directing trade on a day to day basis. Therefore, we recommend closely watching the US debt limit talks and how the market is interpreting the moves as well as any further ratings agency talk about EMU periphery debt.

See the original article >>

Profitable Year Predicted for Commodities In 2012


A recent University of Illinois Farm Economics Facts and Opinions report predicts net returns for 2012 at $269 per acre for corn and $136 per acre for soybeans, indicating a profitable year.
 
“For corn we’re looking at non-land cost at $513 per acre for central Illinois high-productivity land,” said agricultural economist and farm management specialist Gary Schnitkey. “That’s up from last year when we had $418 projected for 2011. The $513 cost, if it happens, is the second highest on record, with 2009 higher at $535. Soybeans are projected to be $301 per acre, which would be the highest ever.”
 
Schnitkey said the costs were figured using data from 2010, which is the last year with actual numbers, then projected forward based on current input prices. The costs are based on data from farms enrolled in Illinois Farm Business Farm Management (FBFM) and the fertilizer and seed costs come from a variety of sources, Schnitkey said.
 
“The cost includes direct costs which are fertilizer, pesticides, seeds, drying and storage and crop insurance, power costs relating to machinery and general overhead costs,” Schnitkey said. “We also added a line cost which is an average cash-rent. We used $230 per acre as an average.”
 
Schnitkey reported that the projected a break-even prices, which would cover all costs of production, are $3.81 per bushel for corn and $9.48 per bushel for soybean.
 
“Both of those are pretty high and suggest prices above $4.00 per bushel for corn and $10 for soybeans for farmers to be profitable in this new cost environment,” he said. “But, while we’re looking at a good year, agriculture can change quickly.”
 
Visitors to the U of I farmdoc website can view the full report.

See the original article >>

Is Corn Being Replaced By Wheat?


It seems that the market has done its job for at least the time being. Corn prices rose to significant enough levels to curb enough demand this summer that supplies appear to be adequate enough for the remainder of this marketing year. But that brings on a new set of problems and weather remains the determining factor in success or failure.
 
"I think we’ve successfully rolled the problem of tight stocks from old crop to new crop. There is some discussion that we’re below trendline now, and I think we’ve priced in about 157-158/bu. acre national yield. If we keep the heat in here, as good as the crop is in Iowa, Illinois and Nebraska, we could hurt it at night like we did last year."
 
 
That concern is dark respiration and the fact that corn essentially get a chance to rest during the night when overnight temperatures remain too high. The plant’s energy is then spent trying to cool itself down rather than producing kernels of corn. That was the case last year and yields were lower than normal, Gulke says. It’s still too early to say if it will be a problem this year or not, but the heat wave of 2011 isn’t doing this crop any favors right now.
 
There is anticipation that crop ratings will drop again on Monday and how much will they drop? They dropped 3% last week before we had that real hot weather this week."
 
Futures for all grains and soybeans moved mostly sideways in futures trading this week. Following rains late in the week, they opened lower on Friday, which would have brought prices for the week lower. The only old crop month remaining on the CBOT for corn did close lower for the week, but new crop closed mostly even on the week as fears over the heat dome mounted throughout trading on Friday, Gulke says.
 
Wheat prices and corn prices are becoming more tied as the limited corn supplies are causing livestock feeders to look at wheat as an alternative feed. "We’re talking to more of our clients recently who are shifting to wheat for feed," he says. "One of our clients who runs a mill in California said recently that we wouldn’t believe how much wheat they are importing for feed. And he says it didn’t start a week ago…it started 2-3 months ago."

Morning markets: grain futures choke on US debt wrangle

by Agrimoney.com

If one debt problem – the eurozone's - was resolved, for now, another – America's - remained very much alive.
US lawmakers are still squabbling over a deal to raise the US debt ceiling, with apparently little progress over the weekend on a resolution.
That led to Monday looking very much "risk-off" in its aspect, with a disaster in China – a rail crash that killed at least 43 people – only adding to the gloom.
Shanghai shares plunged 2.8% in late deals, with Tokyo's already having closed down 0.8%, while, on commodities markets, both copper and oil fell too. West Texas Intermediate crude dipped 1.0% back below $99 a barrel.
'Pretty strong cold front'
That only made things worse for farm commodities, many of which are used in making biofuels. They fell even as far as Kuala Lumpur, where palm oil, a biodiesel source, went back to the defensive tumbling 1.5% to 3,092 ringgit a tonne as of 07:05 GMT (08:05 UK time).
Data from cargo surveyor Intertek Testing Services showing Malaysia's palm oil exports up 2.3% this month, implying a slowdown over the past week, did little to help.
In Chicago, corn tumbled 2.0% to $6.84 a bushel for December, and by 2.0% to $6.76 a bushel for September, with forecasts for cooler weather for heat-stressed US crops.
Storms over the weekend that moved into states such as Illinois, Indiana and Ohio were "heavier larger than what the model data was forecasting last Friday", WxRisk.com said.
"There is heat in the forecast, especially over the eastern Corn Belt and the lower portions of the western Corn Belt at the end of this week. But there is there is also a pretty strong cold front which arrives July 29-30 with potential for more significant rainfall."
Further danger ahead?
OK, that may not be the end of the heat-stress threat, with the forecast for days around August 4-8 showing a new "heat dome", currently centred below the main corn-growing states, but which "will have to be watched", the weather service said.
"It will not take much of a shift in the model data or the atmosphere to move the heat dome back into the Upper Plains and the Midwest during the month of August."
But it was too slim a hope for bulls to pin their flag on. And, with corn lower, wheat faded too, if not as fast and its fellow grain, so managing to rebuild a bit more of its usual premium.
Chicago's September contract dipped 1.4% to $6.82 ¾ a bushel. High-protein wheats this time performed better, or less badly, with Kansas hard red winter wheat for September losing 0.9% to $7.72 ¾ a bushel while Minneapolis hard red spring wheat shed 0.9% to $8.30 ¾ a bushel.
New best friend
And even soybeans fell, after being confirmed by weekly regulatory data late on Friday as speculators' new best friend, or up-and-coming one anyway, with a sharp rise in their net long exposure.
"Large funds nearly doubled their long position to 78,011 contracts, their largest long in over three months," Kim Rugel at Benson Quinn Commodities noted.
Australia & New Zealand Bank said: "The soybean complex saw large speculative inflows. Speculative interest in the soybean complex leapt higher on the back of increased spreading and outright longs in soybeans and soyoil."
Nonetheless, the best-traded November lot lost admirers on Monday, shedding 1.1% to $13.73 ½ a bushel, while soyoil for August dipped 1.2% to 55.85 cents a pound.
Data later
Mr Rugel added: "If weather situation were to dramatically improve, the market will be prone to mass long liquidation, but trade may be hesitant to sell till more is known about mid-August outlook."
Also crucial, after the market closes, will be data showing just how much damage the US heatwave has already done, following the surprise three-point dip in the "good" and "excellent" rating last week.

Renewable Energy

By Anna W

Click to enlarge
Renewable Energy - Infographic
Source:
Carrington College’s Renewable Energy Degree

Social Networking a Bubble.

By MICHAEL SANTOLI

Three issues leap out to me from that paragraph:
1) Tight float: The trick we have seen already is to only sell a small amount of stock to the public between 5-15%. It take very little public buying to send that stock soaring. These companies are “Semi Public;” put the other 80-95% on the market, and see how much interest — and valuation there actually is.
2) Second Markets: The $65, $75, or $100 billion valuation for Facebook comes via the exchange of shares on a very small, uninformed, opaque market. No public disclosures required, no transparent pricing, just blind fumbling. I have yet to see any evidence that these markets come anywhere near pricing equities accurately.
3)Facebook: Assuming the data is correct, Facebook trades at 100 times revenue. Not earnings, revenue. Unless you expect their profit growth to be historically unprecedented, its hard to see how that $100B ism not terribly expensive.
All of the above are interesting, but not telling as to what is or isn’t a bubble. 8 Stocks do not typically make for a frenzy . . .
>


Three Competing Theories

by Van R. Hoisington and Lacy H. Hunt

The three competing theories for economic contractions are: 1) the Keynesian, 2) the Friedmanite, and 3) the Fisherian. The Keynesian view is that normal economic contractions are caused by an insufficiency of aggregate demand (or total spending). This problem is to be solved by deficit spending. The Friedmanite view, one shared by our current Federal Reserve Chairman, is that protracted economic slumps are also caused by an insufficiency of aggregate demand, but are preventable or ameliorated by increasing the money stock.

Both economic theories are consistent with the widely-held view that the economy experiences three to seven years of growth, followed by one to two years of decline. The slumps are worrisome, but not too daunting since two years lapse fairly quickly and then the economy is off to the races again. This normal business cycle framework has been the standard since World War II until now.

The Fisherian theory is that an excessive buildup of debt relative to GDP is the key factor in causing major contractions, as opposed to the typical business cycle slumps (Chart 1). Only a time consuming and difficult process of deleveraging corrects this economic circumstance. Symptoms of the excessive indebtedness are: weakness in aggregate demand; slow money growth; falling velocity; sustained underperformance of the labor markets; low levels of confidence; and possibly even a decline in the birth rate and household formation. In other words, the normal business cycle models of the Keynesian and Friedmanite theories are overwhelmed in such extreme, overindebted situations.

Economists are aware of Fisher’s views, but until the onset of the present economic circumstances they have been largely ignored, even though Friedman called Irving Fisher “America’s greatest economist.” Part of that oversight results from the fact that Fisher’s position was not spelled out in one complete work. The bulk of his ideas are reflected in an article and book written in 1933, but he made important revisions in a series of letters later written to FDR, which currently reside in the Presidential Library at Hyde Park. In 1933, Fisher held out some hope that fiscal policy might be helpful in dealing with excessive debt, but within several years he had completely rejected the Keynesian view. By 1940, Fisher had firmly stated to FDR in several letters that government spending of borrowed funds was counterproductive to stimulating economic growth. Significantly, by 2011, Fisher’s seven decade-old ideas have been supported by thorough, comprehensive and robust econometric and empirical analysis. It is now evident that the actions of monetary and fiscal authorities since 2008 have made economic conditions worse, just as Fisher suggested. In other words, we are painfully re-learning a lesson that a truly great economist gave us a road map to avoid.

High Dollar Policy Failures

If governmental financial transactions, advocated by following Keynesian and Friedmanite policies, were the keys to prosperity, the U.S. should be in an unparalleled boom. For instance, on the monetary side, since 2007 excess reserves of depository institutions have increased from $1.8 billion to more than $1.5 trillion, an amazing gain of more than 83,000%. The fiscal response is equally unparalleled. Combining 2009, 2010, and 2011 the U.S. budget deficit will total 28.3% of GDP, the highest three year total since World War II, and up from 6.3% of GDP in the three years ending 2008 (Chart 2). Importantly, the massive advance in the deficit was primarily due to a surge in outlays that was more than double the fall in revenues. In the current three years, spending was an astounding $2.2 trillion more than in the three years ending 2008. The fiscal and monetary actions combined have had no meaningful impact on improving the standard of living of the average American family (Chart 3).


Why Has Fiscal Policy Failed?

Four considerations, all drawn from contemporary economic analysis, explain the underlying cause of the fiscal policy failures and clearly show that continuing to repeat such programs will generate even more unsatisfactory results.

First, the government expenditure multiplier is zero, and quite possibly slightly negative. Depending on the initial conditions, deficit spending can increase economic activity, but only for a mere three to five quarters. Within twelve quarters these early gains are fully reversed. Thus, if the economy starts with $15 trillion in GDP and deficit spending is increased, then it will end with $15 trillion of GDP within three years. Reflecting the deficit spending, the government sector takes over a larger share of economic activity, reducing the private sector share while saddling the same-sized economy with a higher level of indebtedness. However, the resources to cover the interest expense associated with the rise in debt must be generated from a diminished private sector.

The problem is not the size or the timing of the actions, but the inherent flaws in the approach. Indeed, rigorous, independently produced statistical studies by Robert Barro of Harvard University in the United States and Roberto Perotti of Universita Bocconi in Italy were uncannily accurate in suggesting the path of failure that these programs would take. From 1955 to 2006, Dr. Barro estimates the expenditure multiplier at -0.1 (p. 206 Macroeconomics: A Modern Approach, Southwestern 2009). Perotti, a MIT Ph.D., found a low but positive multiplier in the U.S., U.K., Japan, Germany, Australia and Canada. Worsening the problem, most of those who took college economic courses assume that propositions learned decades ago are still valid. Unfortunately, new tests and the availability of more and longer streams of macroeconomic statistics have rendered many of the well-schooled propositions of the past five decades invalid.Second, temporary tax cuts enlarge budget deficits but they do not change behavior, providing no meaningful boost to economic activity. Transitory tax cuts have been enacted under Presidents Ford, Carter, Bush (41), Bush (43), and Obama. No meaningful difference in the outcome was observable, regardless of whether transitory tax cuts were in the form of rebate checks, earned income tax credits, or short-term changes in tax rates like the one year reduction in FICA taxes or the two year extension of the 2001/2003 tax cuts, both of which are currently in effect. Long run studies of consumer spending habits (the consumption function in academic circles), as well as detailed examinations of these separate episodes indicate that such efforts are a waste of borrowed funds. This is because while consumers will respond strongly to permanent or sustained increases in income, the response to transitory gains is insignificant. The cut in FICA taxes appears to have been a futile effort since there was no acceleration in economic growth, and the unfunded liabilities in the Social Security system are now even greater. Cutting payroll taxes for a year, as former Treasury Secretary Larry Summers advocates, would be no more successful, while further adding to the unfunded Social Security liability.

Third, when private sector tax rates are changed permanently behavior is altered, and according to the best evidence available, the response of the private sector is quite large. For permanent tax changes, the tax multiplier is between minus 2 and minus 3. If higher taxes are used to redress the deficit because of the seemingly rational need to have“shared sacrifice,” growth will be impaired even further. Thus, attempting to reduce the budget deficit by hiking marginal tax rates will be counterproductive since economic activity will deteriorate and revenues will be lost.

Fourth, existing programs suggest that more of the federal budget will go for basic income maintenance and interest expense; therefore the government expenditure multiplier may become more negative. Positive multiplier expenditures such as military hardware, space exploration and infrastructure programs will all become a smaller part of future budgets. Even the multiplier of such meritorious programs may be much less than anticipated since the expended funds for such programs have to come from somewhere, and it is never possible to identify precisely what private sector program will be sacrificed so that more funds would be available for federal spending. Clearly, some programs like the first-time home buyers program and cash for clunkers had highly negative side effects. Both programs only further exacerbated the problems in the auto and housing markets.

Permanent Fiscal Solutions Versus Quick Fixes

While the fiscal steps have been debilitating, new programs could improve business considerably over time. A federal tax code with rates of 15%, 20%, and 25% for both the household and corporate sectors, but without deductions, would serve several worthwhile purposes. Such measures would be revenue neutral, but at the same time they would lower the marginal tax rates permanently which, over time, would provide a considerable boost for economic growth. Moreover, the private sector would save $400-$500 billion of tax preparation expenses that could then be channeled to other uses. Admittedly, the path to such changes would entail a long and difficult political debate.

In the 2011 IMF working paper, “An Analysis of U.S. Fiscal and Generational Imbalances,” authored by Nicoletta Batini, Giovanni Callegari, and Julia Guerreiro, the options to correct the problem are identified thoroughly. These authors enumerate the ways to close the gaps under different scenarios in what they call “Menu of Pain.” Rather than lacking the knowledge to improve the economic situation, there may not be the political will to deal with the problems because of their enormity and the huge numbers of Americans who would be required to share in the sacrifices. If this assessment is correct, the U.S. government will not act until a major emergency arises.

The Debt Bomb

The two major U.S. government debt to GDP statistics commonly referred to in budget discussions are shown in Chart 4. The first is the ratio of U.S. debt held by the public to GDP, which excludes federal debt held in various government entities such as Social Security and the Federal Reserve banks. The second is the ratio of gross U.S. debt to GDP. Historically, the debt held by the public ratio was the more useful, but now the gross debt ratio is more relevant. By 2015, according to the CBO, debt held by the public will jump to more than 75% of GDP, while gross debt will exceed 104% of GDP. The CBO figures may be too optimistic. The IMF estimates that gross debt will amount to 110% of GDP by 2015, and others have even higher numbers. The gross debt ratio, however, does not capture the magnitude of the approaching problem.

According to a recent report in USA Today, the unfunded liabilities in the Social Security and Medicare programs now total $59.1 trillion. This amounts to almost four times current GDP. Modern accrual accounting requires corporations to record expenses at the time the liability is incurred, even when payment will be made later. But this is not the case for the federal government. By modern private sector accounting standards, gross federal debt is already 500% of GDP.

Federal Debt – the End Game

Economic research on U.S. Treasury credit worthiness is of significant interest to Hoisington Management because it is possible that if nothing is politically accomplished in reducing our long-term debt liabilities, a large risk premium could be established in Treasury securities. It is not possible to predict whether this will occur in five years, twenty years, or longer. However, John H. Cochrane of the University of Chicago, and currently President of the American Finance Association, spells out the end game if the deficits and debt are not contained. Dr. Cochrane observes that real, or inflation adjusted Federal government debt, plus the liabilities of the Federal Reserve (which are just another form of federal debt) must be equal to the present value of future government surpluses (Table 1). In plain language, you owe a certain amount of money so your income in the future should equal that figure on a present value basis. Federal Reserve liabilities are also known as high powered money (the sum of deposits at the Federal Reserve banks plus currency in circulation). This proposition is critical because it means that when the Fed buys government securities it has merely substituted one type of federal debt for another. In quantitative easing (QE), the Fed purchases Treasury securities with an average maturity of about four years and replaces it with federal obligations with zero maturity. Federal Reserve deposits and currency are due on demand, and as economists say, they are zero maturity money. Thus, QE shortens the maturity of the federal debt but, as Dr. Cochrane points out, the operation has merely substituted one type for another. The sum of the two different types of liabilities must equal the present value of future governmental surpluses since both the Treasury and Fed are components of the federal government.

Calculating the present value of the stream of future surpluses requires federal outlays and expenditures and the discount rate at which the dollar value of that stream is expressed in today’s real dollars. The formula where all future liabilities must equal future surpluses must always hold. At the point that investors lose confidence in the dollar stream of future surpluses, the interest rate, or discount rate on that stream, will soar in order to keep the present value equation in balance. The surge in the discount rate is likely to result in a severe crisis like those that occurred in the past and that currently exist in Europe. In such a crisis the U.S. will be forced to make extremely difficult decisions in a very short period of time, possibly without much input from the political will of American citizens. Dr. Cochrane does not believe this point is at hand, and observes that Japan has avoided this day of reckoning for two decades. The U.S. may also be able to avoid this, but not if the deficits and debt problem are not corrected. Our interpretation of Dr. Cochrane’s analysis is that, although the U.S. has time, not to urgently redress these imbalances is irresponsible and begs for an eventual crisis.

Monetary Policy’s Numerous Misadventures

Fed policy has aggravated, rather than ameliorated our basic problems because it has encouraged an unwise and debilitating buildup of debt, while also pursuing short term policies that have increased inflation, weakened economic growth, and decreased the standard of living. No objective evidence exists that QE has improved economic conditions. Even before the Japanese earthquake and weather related problems arose this spring, real economic growth was worse than prior to QE2. Some measures of nominal activity improved, but these gains were more than eroded by the higher commodity inflation. Clearly, the median standard of living has deteriorated.

When the Fed diverts attention with QE, it is possible to lose sight of the important deficit spending, tax and regulatory barriers that are restraining the economy’s ability to grow. Raising expectations that Fed actions can make things better is a disservice since these hopes are bound to be dashed. There is ample evidence that such a treadmill serves to make consumers even more cynical and depressed. To quote Dr. Cochrane, “Mostly, it is dangerous for the Fed to claim immense power, and for us to trust that power when it is basically helpless. If Bernanke had admitted to Congress, ‘There’s nothing the Fed can do. You’d better clean this mess up fast,’ he might have a much more salutary effect.” Instead, Bernanke wrote newspaper editorials, gave speeches, and appeared on national television taking credit for improved economic conditions. In all instances these claims about the Fed’s power were greatly exaggerated.

Summary and Outlook

In the broadest sense, monetary and fiscal policies have failed because government financial transactions are not the key to prosperity. Instead, the economic well-being of a country is determined by the creativity, inventiveness and hard work of its households and individuals.

A meaningful risk exists that the economy could turn down prior to the general election in 2012, even though this would be highly unusual for presidential election years. The econometric studies that indicate the government expenditure multiplier is zero are evidenced by the prevailing, dismal business conditions. In essence, the massive federal budget deficits have not produced economic gain, but have left the country with a massively inflated level of debt and the prospect of higher interest expense for decades to come. This will be the case even if interest rates remain extremely low for the foreseeable future. The flow of state and local tax revenues will be unreliable in an environment of weak labor markets that will produce little opportunity for full time employment. Thus, state and local governments will continue to constrain the pace of economic expansion. Unemployment will remain unacceptably high and further increases should not be ruled out. The weak labor markets could in turn force home prices lower, another problematic development in current circumstances. Inflationary forces should turn tranquil, thereby contributing to an elongated period of low bond yields. The Fed may resort to another round of quantitative easing, or some other untested gimmick with a new name. Such undertakings will be no more successful than previous efforts that increased over-indebtedness or raised transitory inflation, which in turn weakened the economy by directly, or indirectly, intensifying financial pressures on households of modest and moderate means.

While the massive budget deficits and the buildup of federal debt, if not addressed, may someday result in a substantial increase in interest rates, that day is not at hand. The U.S. economy is too fragile to sustain higher interest rates except for interim, transitory periods that have been recurring in recent years. As it stands, deflation is our largest concern, therefore we remain fully committed to the long end of the Treasury bond market.
Emerging Markets Could Be Poised For A Strong Outperform


Emerging-market equities have underperformed mature-market equities since the start of the year, with the MSCI Emerging Market Index down 1.4% while the MSCI World Index is up 2.04% and the S&P 500 4.6%. This raises the question of whether investors have lost faith in emerging-market equities.
Let us first look at the issue of valuation. In order to compare emerging-market equities and the S&P 500, I used two exchange-traded funds (ETFs), namely iShares MSCI Emerging Markets Index Fund (EEM) and iShares S&P 500 Index Fund (IVV). I calculated the annual trailing dividend yields on both since 2004 on a daily basis and compared them in the graph below. Please note that the prices I used were in fact the net asset values of the funds.

But why the dividend yield and not the price-to-earnings ratio, you may ask? Apart from a lack of information regarding the price-to-earnings ratio, I believe dividend yield is a better indication for investors in the ETFs as it is part of their actual returns. Furthermore, dividends are unaffected by accounting policy changes and adjustments that frequently occur and distort the earnings base of companies and indices.

Sources: iShares; Plexus Asset Management.

It is evident that the EEM has generally traded at a premium to the IVV since the EEM was launched, with the dividend yield significantly lower than that of the IVV. The major exception was from the third quarter of 2008 to mid-2009 during the global liquidity crisis sparked by the Lehman saga where the EEM actually traded at a discount to the IVV.
 
Why should the EEM trade at a premium to the IVV? The age-old investment adage of “relative earnings drive relative price”, and in this case “relative dividends drive relative price”, applies. The compounded growth in dividends of the EEM since 2004 has been 11.6% per annum while that of the IVV has been 1.5% per annum.

Sources: iShares; Plexus Asset Management.

The reason why the EEM moved from a premium rating to a discount to the IVV is evident in the graph below. The market expected dividends for the EEM in 2009 to be sliced significantly more than those of the IVV on the back of 2008/2009’s liquidity crisis.

As the liquidity crisis eased because global trade normalised, the price of EEM relative to IVV reverted to the relative dividend index and thereby moved to trade at a premium rating to the IVV. Since the fourth quarter of last year the gap between the relative dividend and price indices has opened as more and more black swans entered the global pool. The gap surged at the end of the second quarter, though, after both the EEM and IVV went ex dividend in June.

Sources: iShares; Plexus Asset Management.


This resulted in the EEM trading on a par with IVV on a dividend yield basis.

Sources: iShares; Plexus Asset Management.


What this is telling me is that the EEM is currently priced in a similar way as in June 2008 just before the 2008/2009 liquidity crisis started in earnest.

Sources: iShares; Plexus Asset Management.

My reading is therefore that the EEM is priced for an imminent global financial disaster.

Sources: iShares; Plexus Asset Management.

I do not know whether such a disaster is indeed imminent, but I can play around with various scenarios, such as the Eurozone crumbling, the debt situation of local authorities in China catching up with them, another earthquake disaster in Japan, etc. But no one can tell.

My research also revealed an interesting feature about the EEM. Its rating relative to the IVV has been steadily falling over the years with the relative dividend gradually trending upwards. The dividend yield of the EEM relative to that of the IVV is currently approaching the upward channel of the trendline (which is the trendline plus 15 basis points).

The last time, barring the 2008/2009 crisis period, the relative rating of the EEM found itself at the upper end was in December 2006 through February 2007, after which the EEM outperformed the IVV by a significant margin.

Sources: iShares; Plexus Asset Management.

If I assume that the historical dividend growth rates of EEM and IVV remain unchanged at 11.6% and 1.5% respectively, it means that to receive $1 dividend in 5 years’ time I am paying USD 32.09 now for the EEM compared to $51.57 for the IVV – a 37.8% discount!

Yes, despite the risks, I can live with that. Put another way, given the respective dividend growth rates for the EEM and, IVV it will mean that the relative dividend yield of EEM to IVV will swell to 1.61. Allowing for a further derating from the current dividend yield ratio of 1 to 1.1, it means a relative price outperformance of 46%.

But what really caused the recent slump in the MSCI Emerging Markets Index? To eliminate the distortions caused by currencies, I decided to convert the MSCI Emerging Markets Index from US dollar to Swiss franc.

Are you prepared for this? The MSCI Emerging Market Index in Swiss franc has an extremely good correlation with China’s CFLP manufacturing PMI. This demonstrates the importance of China’s economy, and especially the manufacturing sector, for emerging-market equities.

Sources: CFLP; Li & Fung; I-Net Bridge; Plexus Asset Management.

It is no coincidence, though. Look at how the monthly high/low of the Shanghai Composite Index corresponds with the CFLP manufacturing PMI.

Sources: CFLP; Li & Fung; I-Net Bridge; Plexus Asset Management.

It is evident that the Shanghai Composite Index is currently anticipating a jump in July’s CFLP manufacturing PMI. But will it happen? The impact of my calculated seasonality of the PMI on the Shanghai Composite Index is clearly evident in the graph below. It also indicates that the players in China’s equity market as reflected by the Shanghai Composite Index may be a bit optimistic.

Sources: CFLP; Li & Fung; I-Net Bridge; Plexus Asset Management.

What stands out, though, is that the manufacturing sector in China is on the verge of a period of seasonal strength. that will last through end September.

Sources: CFLP; Li & Fung; I-Net Bridge; Plexus Asset Management.

On the other hand, the MSCI Emerging Markets Index in terms of Swiss franc is solidly anticipating the seasonally weak PMI. I think there is a more than even chance that the MSCI Emerging Markets Index in terms of Swiss franc will continue to follow the seasonal pattern in China’s CFLP manufacturing PMI in coming months. I am thus inclined to believe that July will also mark a seasonal low for emerging-market equities in general.

Need I say more?

See the original article >>

Follow Us