Thursday, June 27, 2013

Stock Market Pop-n-Drop?

By: Anthony_Cherniawski

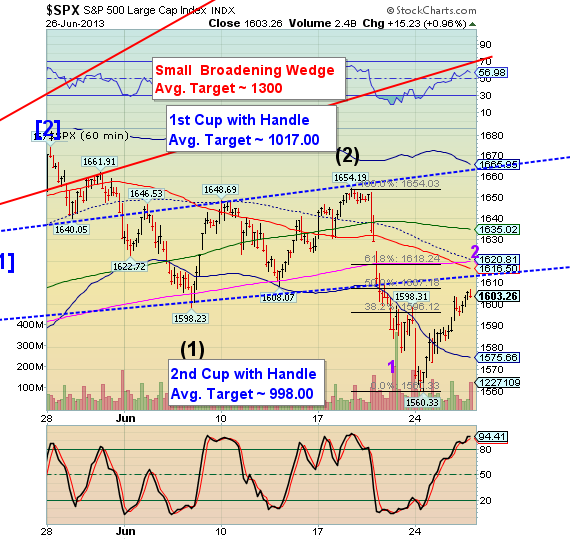
Sometimes analyzing very short-term charts can be misleading. For example, an a-b-c formation often subdivides so that Wave a also is an a-b-c. That is what appears to have happened at yesterday’s close.

The hourly charts often show the most granularity, since they also show support and resistance, while smaller degree charts only show wave structure.

There are several resistance points that may offer a stopping place for this retracement. The first is the Lip of the Cup with Handle at 1613.00, followed by short-term resistance at 1616.50. The next set of resistances are the 50-day and mid-Cycle resistance, both currently at 1620.61.

Considering that the Pre-Market is up nearly 11 points, it appears that the upper resistance is the prime candidate for a reversal. The Cycles Model allows up to 24 hours on either side of the Pivot date, since in this case 4.3 X 14 = 120.4. So we may see a final spike up and a probable reversal sometime this morning.

There is a storm front moving through the area this morning, leaving us an unreliable power supply. I am still in northern Michigan for the rest of the day, but will be packing soon for the drive back home.

See the original article >>

Retail Investor Nightmare: The Bond Fund Rout

by AuthorWolf Richter

The bond selloff didn’t surprise anyone. Investors knew that it would happen, would have to happen. Gurus of all stripes had predicted for years that it would happen, that the ridiculously low yields weren’t sustainable, that the Fed would eventually have to back off – only to watch with a mix of helpless frustration and ironic bemusement as the Fed or some other central bank opened the spigot even wider.

Meanwhile, investors decided to brush off the razzmatazz and just hang in there until it would happen, then get out in the nick of time. And they rode up the most gigantic bond bubble in history. But real cracks appeared in the Treasury market last fall when yields rose despite the Fed’s announcement of QE infinity designed to repress yields.

So, on April 30, it became official. In light of sky-high corporate bond prices and record low yields, billionaire Wilbur Ross of WL Ross & Co. warned during a panel discussion of the long-term issues in bond la-la land. This – whatever was coming down the pike – wouldn’t be just a brief dip that you could buy. A mountain of debt had been issued in recent years at artificially low rates, thanks to the Fed’s machinations. It would have to be refinanced in a few years at much higher rates. “There’s a tremendous amount of interest-rate refinancing risk being built up,” he said. “We’re just building a bigger and bigger time bomb.”

Others chimed in. Joshua Harris, co-founder and chief investment officer of private-equity powerhouse Apollo Global Management, offered this tidbit of immortal wisdom to the still euphoric bondholders: “run – do not walk!”

And they did. All at the same time. It stopped the crazy feeding frenzy for yield. It turned the junk-bond bubble into a rout overnight. That “time bomb” would hit them the hardest. There’d be defaults. Value would just vanish. These risks are worth taking, if yields are high enough. But they weren’t. As the average yield on junk bonds hit a record low of 5.24% on May 9, investors opened their eyes [my take: The Day The Big Fat Junk-Bond Bubble Blew Up]. By June 26, it had jumped to 7.02%. And it’s just the beginning. The chart shows this vicious 6-week spike:

Even some of the least risky and most liquid paper out there, Treasuries, started diving in early May. Last week, the 10-year note experienced its worst selloff since June 2009 – the depth of the Financial Crisis! On Monday, yields hit 2.66% – up from 1.66% on May 2, and more than double the August low of 1.3%! Now they’ve settled a bit, at 2.58%. Investors are contemplating losses of over 10% since early May – in what is considered one of the most conservative investments around.

Those who own actual bonds, and don’t sell them, will be able to ride out the storm – assuming the issuer doesn’t default – patiently collecting puny coupon payments and allowing inflation to eat into their investment. But most retail investors, when they buy bonds, buy bond funds. And there, the massacre has been brutal: $48 billion have been yanked out of bond mutual funds so far in June.

Bond fund investors have a problem that holders of actual bonds don’t have: if your bond fund gets hit by massive waves of redemptions, you can’t ride out the storm without losses!

At first, a bond fund typically uses its cash cushion to deal with redemptions and then sell bonds gradually. Fund investors might not know the difference. But during big waves of redemptions, such as those recently, bond funds scramble to sell what they can sell into an increasingly illiquid market. So they’re selling Treasuries and their most liquid high-quality corporates – where losses are relatively small. The best stuff first.

Even in good times, corporate bonds can be fairly illiquid. There may be days and sometimes weeks or even months between trades of a particular issue. So marking illiquid bonds to market on a daily basis, when there is no discernible market, can be tricky.

But when bond prices drop, liquidity dries up further. The gap between what sellers want and what buyers are willing to pay becomes so wide that many bonds essentially stop trading – unless there is a forced sale! Hit with a wave of redemptions, a bond fund might have to sell less liquid bonds for whatever it can get for them – much less than the “market value” on its books. With each sale, the fund recognizes the loss. And as the fund dips deeper into its illiquid lower-quality bonds, particularly junk bonds, during the worst bouts of a selloff, losses accelerate. Investors get spooked and bail out. Hence, more redemptions. And more losses. It’s the reverse of the Fed-inspired feeding frenzy. The reverse of the wealth effect.

In the worst cases, such as the formerly $14-billion Schwab YieldPlus Select Fund, now defunct, it ends in a bloodbath. Even well-managed bond funds can have some ripples. Bond funds that realize losses while they’re forced to sell at the worst moment can’t recuperate those losses even if bonds – those that don’t default – rise again. Those gains go to whoever was on the other end of the transaction. And the buy-and-hold bond fund investor ends up holding the bag.

In an environment of rapidly rising interest rates, bonds with long maturities require nerves of steel and the willingness to sit on a crummy investment for years, or even decades. But bond funds can be outright treacherous – yet, in another display of Wall Street genius, it’s the conservative retail investor who gets lured into them.

It was the day when Private Equity firms – the smart money, the great beneficiaries of the Fed’s money-printing and bond-buying binge – announced their intentions to the rest of the world. The heavy hitters were there, and they let fly some pungent words. In short, they were “selling everything that’s not nailed down.” It was greeted with incredulity. Turns out, they weren’t kidding. They saw what was coming. Read.... The Smart Money Is Dumping “Everything That’s Not Nailed Down”

See the original article >>

Commodity Currencies Are Looking Up

by Greg Harmon

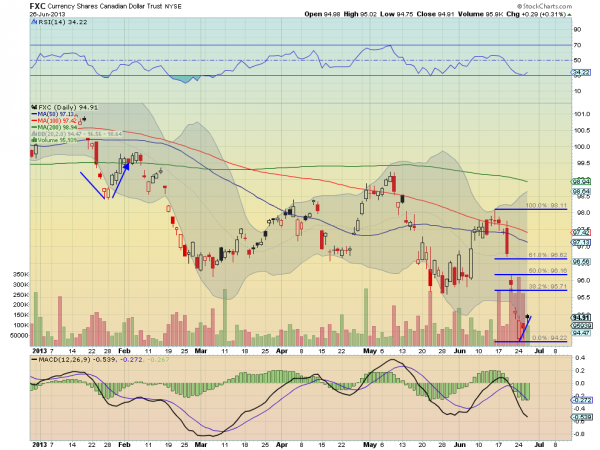
The commodity currencies got hit hard and fast last week. But with 3 days in the books it looks like a turn around may be brewing. The chart below of the Currency Shares Canadian Dollar Trust ($FXC), the ETF which is intended mimic the price movement in the Canadian Dollar, shows the volume subsiding after a big build up on the drastic move lower. There is also the Relative Strength Index (RSI) turning up with a Moving Average Convergence Divergence indicator (MACD) that has stopped dropping on the histogram. Even if it only retraces 50% of the last leg lower that is a sizable move for a currency.

fxc

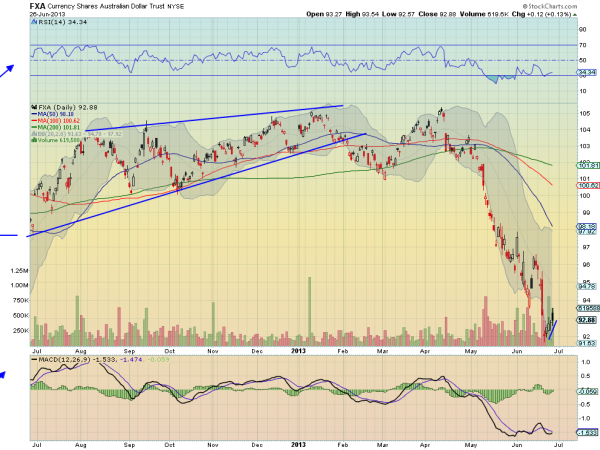
The Australian version ($FXA) is also improving but is not quite as strong in its bounce as this point. Filling a downside gap with a MACD histogram that is nearly back to zero, with the signal line flat and a RSI that may be rising. It is very extended from the falling 50 day Simple Moving Average (SMA) so a bounce could alleviate some oversold pressure.

fxa

But what is maybe more interesting is that these commodity currencies have been highly correlated with commodities, and in particular Gold. A bounce and fall back, otherwise known as a dead cat bounce, may be enough to play for in the currencies. But if the bounce holds and continues higher then maybe it is time to dabble in Gold.

See the original article >>

Massive decline in euro area's excess reserves is not an indication of improved lending

by SoberLook

The decline in euro area banks' excess reserves has been quite spectacular. Excess reserve levels are back to 2011 levels.

Source: ECB

Some are attributing this to banks "no longer hoarding cash" and therefore lending. That's nonsense. This decline in excess reserves was a direct result of banks reducing their borrowing from the Eurosystem. The combination of the MRO, the LTRO, and the MLF loans from the ECB has been falling.

Source: ECB

Why are banks paying off their loans? Some have found alternative sources of funding in the private markets (repo or secured bonds for example), but a great number of Eurozone banks are simply deleveraging. As they reduce their assets, they don't need to borrow as much. Sadly, this deleveraging has resulted in extraordinarily weak loan growth, both to households,

YoY growth in loans to Eurozone households (source: ECB)

... and to corporations.

YoY growth in loans to Eurozone non-financial companies (source: ECB)

While there are some signs of economic improvements in certain parts of the Eurozone, the deleveraging of the banking system and nonexistent loan growth does not bode well for a near-term recovery.

See the original article >>

Stock-Market Crashes Through the Ages – Part IV – Late 20th Century

By tothetick

The late 20th century was a jam-packed time for stock-market crashes that would change, shape and alter our lives in so many ways. We had gone through the post-war period and there was heightened wealth in western economies. People were asking for greater recognition and wealth was being distributed and redistributed in the construction of a new world that was supposed to be better and safer. Groups that had until then been largely left unrecognized were now asking to partake in that wealthy society that was being constructed. Women gained even more rights, kids where no longer treated like babies, minority groups were given greater equality.

Consumerism had been born and it changed our outlook on the world. The world had been through great recessions and had suffered enormous losses due to World War II. The United Nations had been set up in 1945 leading to greater cooperation between countries. We would turn into capitalist countries, in true proof of the ‘Golden-Arches Theory’ (i.e. countries that have McDonald’s restaurants), referring to the theory developed by Thomas L. Friedman in 1999, stating that those countries are more likely to avoid war with each other and do business to maintain their wealth. Countries that are rich enough to have developed a middle class (meaning greater wealth distribution, in general) are less likely to put that in danger by going to war with another country that is also a ‘McDonald’s country’. But, it doesn’t stop them waging war on these countries, with whom they won’t necessarily trade, anyhow.

Bretton Woods

Bretton Woods

The Bretton Woods system had been established fixing rules and regulations among the world’s industrial and economic actors with regard to commercial and financial exchange. It meant the setting up of the International Monetary Fund and also the International Bank for Reconstruction and Development. Money was tied to the US Dollar, by monetary policies that maintained exchange rates between those currencies. It was the period of postwar expansion and economic boom, the Golden Age of Capitalism, lasting around thirty years. The thirty glorious years of the post-war world of capitalism, which came to an end in the 1970s with the oil crises and the Bretton Woods system collapsing.

The 1970s saw the onset of economically-troubled times and the consequences of all of the decisions that had been taken before.

The world became computerized, virtual, distant and yet local at the same time. We were no longer held back and could go anywhere and do anything (or at least we believed that we could). We could even go to the Moon and back. But, our interconnectedness, the fact that we had made the world a smaller place meant that we were to all intents and purposes living in each other’s’ pockets. The age of cascading failure had also been born. We were such a system of interconnectedness that failure in one place triggered failure in successive places, and there was no way of getting out of that. The end of the Golden Age of Capitalism was marked by a succession of stock-market crashes that rocked the world.

Here are a few of them.

1. 1973 Crash

Between January 1973 and December 1974, 699 long days when the Dow Jones Industrial Average plummeted and lost 45.1% of its value. The FT 30 lost 73% of its value on the London Stock Exchange. The 1973 crash is the 7th worst crash in history. It began on 11th January 1973 and ended on December 6th 1974 to be precise.

DJIA 1973 Crash

DJIA 1973 Crash

What caused it? The collapse of the Bretton Woods system, coupled with the devaluation of the Dollar and the oil crisis of 1973. Nobody expected the bubble to burst like it did. The DJIA had made gains of up to 15% in the previous 12-month period. It was also the Nixon shock that played a major part in the collapse of the economies around the world at this time. President Richard Nixon decided to unilaterally stop the direct convertibility of the US Dollar into gold. Thanks to Nixon we have free-floating currencies today.

  • Bretton Woods had meant that the Dollar had to be backed by gold (at $35 an ounce) overseas, with all currencies being pegged to the US Dollar. While the US fared well during the post-war period, it suffered from the recovery in particular of Japan and Germany, seeing its economic output fall from 35% to 27% in the world.
  • The US-gold stock had also fallen due increased spending at home, the Vietnam War and inflation.
  • Thus the money supply had increased (10%) and the USA found itself in the position where it was unable to back the amount of currency in circulation with gold.
  • West Germany decided to leave Bretton Woods in May 1971 and countries started asking for gold, redeeming the Dollar.
  • The Dollar fell by 7.5% against the Deutsche Mark. Nixon decided to suspend the convertibility of the Dollar into gold and the fixed exchange rate was transformed into a floating one.

Recovery for the countries around the world was slow and arduous after the 1973-1974 crash. The UK never returned to the level prior to the 1973 crash until 1987, just in time for another crash to occur just a few months later. In real terms, the USA only returned to the same level in 1993!

2. 1987 Black Monday

Black Monday 1987 Crash

Black Monday 1987 Crash

Monday October 19th 1987 will go down in history. Mondays are bad days. October 28th 1929 bringing about the Great depression and Monday 17th September 2001 stand to testify to that. Why Mondays? Probably because people have the weekend to think over what’s happening, worrying, waiting for the markets to open on Monday morning. They then rush and sell on mass, hoping to cut their losses. Maybe we should work seven days out of seven and cut the thinking time.

  • The crash originated in Hong Kong. It moved on to Europe and then lastly the USA.
  • Within two weeks Hong Kong’s stock market had dropped by 45.5%.
  • The UK had lost 26.45% and the USA suffered a loss of 22.68% (losing 508 points, down to 1738.74).
  • It took two years nearly for the DJIA to get back to the same levels prior to the crash.

Program trading has been cited as the major cause of the 1987 crash, although analysts do still dispute this. Program trading is a sample of stocks that are traded according to the evaluation of the market via predetermined conditions. It enables the trading of large quantities of stocks at the same time. In 2012, program trading made up for about 30% of all volume of shares being traded on the New York Stock Exchange. Technological advances were relatively new in 1987 regarding the world of IT. Perhaps today (at least we might hope) the software programs are more sophisticated and reduce the margin of error. There is no need for human intervention and thus large quantities can be bought and sold at the click of a button.

3. 1989 Friday 13th

Friday 13th 1989 Crash

Friday 13th 1989 Crash

Friday 13th is unlucky for some! This crash was only a mini one in comparison with all of the others that we experienced in the late 20th century. It occurred on Friday October 13th 1989. It seems to have been the result of the failure in the leveraged buyout of UAL Corporation (the parent company of United Airline), worth $6.75 billion. The deal didn’t come off and it resulted in the collapse of the junk bond market.

  • The Dow Jones Industrial Average plummeted 190.58 points (6.91%) to 2, 569.26 in just a few hours after the announcement of the deal failing.
  • The S&P 500 fell 6.12% to 333.65 (-21.74 points).
  • The NASDAQ lost 3.09% (down 14.90 points to 467.3).
4. 1997 Asian Financial Crisis

Asian Financial Crisis

Asian Financial Crisis

The Asian financial crisis began in July 1997 in Thailand and was triggered by the collapse of the Thai Baht. The government of Thailand did not have enough foreign currency to back its fixed-xchange rate and it was forced to float the Thai Baht, removing its peg to the US Dollar. Thailand was already greatly in debt. It was crippled by foreign debts that had led to the bankruptcy of the country prior to this also.  It rapidly spread to Indonesia and South Korea. Then, it hit Hong Kong and Malaysia and the Philippines, dragging them all into a slump.

  • The International Monetary Fund intervened in an attempt to halt the economies spiraling out of control and provided $40 billion to stabilize South Korea, Thailand and Indonesia with regard to their currencies.
  • Debt-to-GDP ratios for the Association of Southeast Asian Nations (ASEAN) increased by a staggering 180% at the worst moments of the crisis.
  • The USA suffered momentary losses, but not to the extent of Asian countries. The DJIA plunged 7.2% in October 1997 as a result. However, the NYSE suspended trading, worried that there was going to be a bigger ripple coming.
  • Japan suffered enormously since Asia represented about 40% of their market. GDP real growth for Japan fell from 5% to 1.6% and Japan entered into recession in 1998.
5. 2000 Dot-Com Bubble

dot com bubble burst

dot com bubble burst

The dot-com speculative bubble lasted from 1997 until 2000. March 10th 2000 was the peak with the NASDAQ closing at 5, 048.62 (which was double its value in comparison with the year before). As a comparison, the NASDAQ stands at 2, 891.5 today. The 90s was the decade of the beginning of internet and it saw the launch of internet-based companies (that largely and spectacularly failed). The first web browser was launched in 1993. Whether or not the company was actually internet-based or not, it was sufficient at the time just to let others believe that you were, by adding e- in front of the company name.

  • The public was advised by economists and reputable newspapers such as the Wall Street Journal to invest and hit the jackpot, believing that the bubble would not burst.
  • But, in 1999, the economy began to slow down. It was announced by analysts that hundreds of internet start-ups would go bankrupt in the coming year. Panic ensued.
  • At the time internet-based companies represented 8% of the US stock market, to the value of $1.3 trillion.
  • The majority of the 371 publically-traded companies failed that year or they were bought out by some stronger competitors only to be closed down later on.
  • They had not managed to turn a profit as they had spent vast sums getting their name known and increasing their customer bases. They collapsed having eaten up their venture capital.
  • Boo.com for example spent the sum of $188 million in half a year creating an online fashion company. It closed in May 2000.
Conclusions

People always say that history repeats itself. With our analysis-technology software, with our data and empirical evidence, it is hard to believe that we might have believed for one moment that the stocks that were bought and sold in the latter part of the 20th century would continue to rise without end. With hindsight, it might be easy to look back and see where things went wrong. The hardest thing is to actually avoid the euphoria and the frenzied buying and selling and look at what history has taught us, so that we don’t make the same mistakes again. But we do, time and time again.

See the original article >>

This Popular Set of Stocks Could Be Headed for a Crash

By Sasha Cekerevac

Is the housing market moving up too fast? As strange as that sounds, considering the crash in the housing market a few years ago, there is a very real possibility that people are beginning to aggressively speculate once again in the housing market.

That flurry of speculators out for quick cash is partially what led to the boom in the housing market last decade. Many people considered the housing market as a means to get rich, and it was fuelled by very low interest rates. That escalation of buying and selling resulted in prices for the housing market far higher than it could sustain. And to the inevitable crash.

Recent data shows that the housing market, instead of stabilizing, is actually seeing an acceleration of price increases.

According to the S&P/Case-Shiller report, April 2013 set a record for the greatest monthly increase in home prices nationwide, with a 12.1% year-over-year increase in the 20-city composite index. (Source: “Home prices set record monthly rise in April 2013 according to S&P/Case-Shiller home price indices,” S&P Dow Jones Indices, June 25, 2013.)

The recent rise in interest rates over the past couple of weeks is now sparking debate over whether the housing market rebound will slow down.

But it will be the refinancing business that will suffer; far more than the housing market. That’s because new single-family home construction is still running below one million units per year.

While that might seem like a large number, new family formation requires approximately 1.3 million to 1.5 million new homes per year. Even with the recent increase in construction for the housing market, there is still a shortage in relation to demand.

Higher interest rates will certainly have an effect on the housing market—but that effect will depend entirely on the extent of the rise. If a 30-year mortgage moves up over four percent, that is a substantial increase in percentage terms; but relative to interest rates over the past several decades, it’s still very low.

The chart for the S&P Homebuilders Index is featured below:

XHB SPDR Homebuilders Index Chart

Chart courtesy of www.StockCharts.com

Of course, the stock market is a forward-looking mechanism. Because of this, homebuilder stocks have moved up impressively over the past couple of years as investors anticipated a rebound in the housing market.

While the housing market should remain fairly strong itself, I see homebuilder stocks as being vulnerable to a pullback. The reason is that higher interest rates will slightly slow sales and expectations of future revenues.

The current level for homebuilder stocks shows an anticipation of a huge amount of revenue generation over the next couple of years. While interest rates currently remain relatively low, I can foresee significantly higher interest rates over the next few years.

Even though a slowdown in the housing market can still result in positive gains for homeowners, it would be extremely detrimental to homebuilder stocks. That’s because current investors are anticipating a continuation of the massive rebound in the housing market.

With the index of homebuilder stocks up approximately 300% over the past two years, most of the gains in the housing market have already been priced in. At this point, I urge caution: Many investors will begin taking profits in these stocks.

While there remains strong demand for housing, if investors have priced in this demand, any slight setback will be a large negative for homebuilder stocks. Investing is all about market perception, as stocks swing from under-valued to over-valued.

See the original article >>

Why the Status Quo Is Doomed

by Charles Hugh Smith

The wheels have come off the endless growth via expanding debt machine.


Progressives and conservatives have long shared a single agenda: growth. Growth increases prosperity and wealth, and this makes for contented voters who will keep voting for incumbents.

This agenda makes three implicit assumptions:


1. Inflation is OK as long as the economy and household wealth expand at a rate that exceeds inflation

2. Increasing debt is OK as long as income and assets both grow faster than debt

3. Wealth/income inequality is OK as long as the wealth/income of the bottom 90% is expanding at the same rate as the top 10%

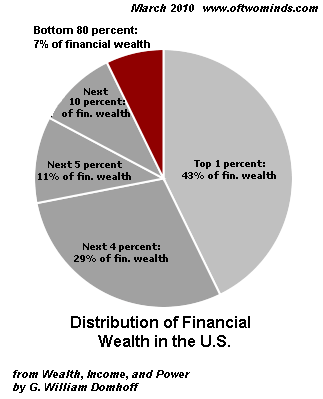
In other words, if most of the wealth generated by growth flows to the top 10% (who coincidentally fund 99% of political campaigns) that's OK, as long as enough "trickles down" to the lower 90% to boost their wealth/income by an equivalent percentage. (The top 10% actually own 83% of the wealth, and the top 1% own 43%)


It's important to understand the distinction being made here between relative and absolute wealth: if the top 10% own 90% of the wealth, then $90 of every $100 of new wealth flows to them. This is politically acceptable to the status quo as long as the wealth of the bottom 90% expands by the same percentage.

Should the bottom 90%'s share of the new wealth rise at a faster rate than the top 10%'s, that's actually preferable, as over time that shrinks wealth inequality while leaving the wealth already owned by the top 10% untouched.

In other words, the top 10% do not suffer any decline in wealth if they collect $80 of each $100 of new wealth rather than $90. This slight reduction in the rate of growth makes little difference to the top wealth holders but it has a much larger impact on the bottom 90% because they own so little wealth.

Every one of these implicit assumptions has been turned on its head: growth is barely above the rate of inflation; by some measures, it has already fallen below the real rate of inflation.

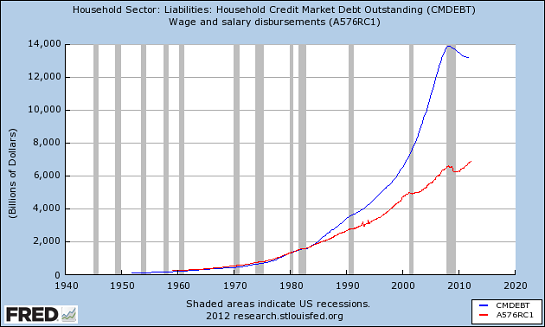
Debt is increasing much faster than income or wealth.

Virtually all of the recent expansion of wealth/income is flowing to the top 10%.

This is why the status quo is doomed: there is no Plan B or even conceptual alternative to the "more growth forever" agenda.


Here is a chart which shows household debt has outrun income for decades:

Debt can be expanded at a rate that exceeds the rise in real income in only one way: by lowering interest rates so the same income can support a larger debt.

This is of course the reason the Federal Reserve has lowered interest rates to near-zero with the ZIRP (zero-interest rate policy).

Eventually the buyers of newly issued debt at near-zero (or even negative) yields start to fear they will never get their capital back or they will be paid back in depreciated currency, and so they demand a higher yield. Since income has already been stretched to the limit to support a towering mountain of debt, this rise in yield catapults the borrower into insolvency.

The real financial situation is considerably bleaker than the conventional view maintains. Federal debt is only the tip of the iceberg: the killer liabilities are the unfunded liabilities for Medicare and Social Security which are estimated at $87 trillion--a number I suspect understates reality, but which is larger than all U.S. household wealth.

Assets have risen as a result of reflated bubbles in bonds, stocks and housing:

The Federal Reserve has created these bubbles by creating trillions of dollars out of thin air to buy Treasury bonds and mortgages to lower yields to near-zero, pushing investors into risk assets while injecting "free money" into the banking system:

Does this trajectory of Federal debt look sustainable?

Here is total credit market debt:

Here is GDP, the standard metric of growth:

The oft-touted fantasy is that "we're going to grow our way out of this," but it is abundantly clear that debt is rising far faster than growth or incomes. Financialization has widened the wealth inequality canyon to the point that the 95% on one side can no longer see the other side through the haze of propaganda and political fog.

Financialization = Inequality (June 25, 2013)

Those relative few on the other bank can no longer see the 95%, either; and since the political and financial Elites are on this side, they are rapidly losing touch with the 95% and the real (i.e. unfinancialized) economy.

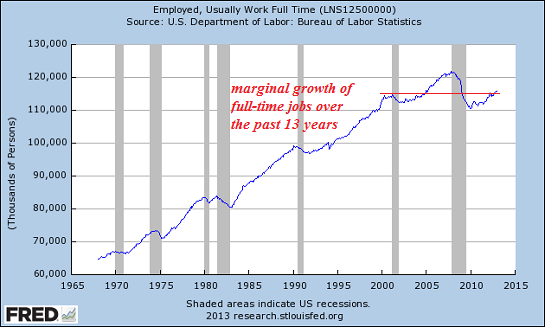
Meanwhile, back in the real world, fulltime jobs--the foundation of household income for the 95%--have stagnated, registering no real growth in 13 years ago while the the working age population has added millions of new entrants:


The wheels have come off the endless growth via expanding debt machine. Rising interest rates are the final blow to this agenda, and the political and financial classes have no Plan B. They are floundering, clueless, bereft of historical context, creativity and courage. Their failure of imagination is total, complete and catastrophic: We Have No Other Choice (March 15, 2012)

Questioning "Progress" and the Poverty of our Imagination (June 11, 2010)

How Empires Fall (April 17, 2013)

Why The Debt-Dependent Status Quo Is Doomed in One Chart (June 29, 2012)

See the original article >>

Chinese Industrial YOY Profits up 15.5% May 2013

By tothetick

The National Bureau of Statistics of China has issued a report today stating that the industrial profits of Chinese enterprises reached 470.55 billion Yuan ($76 billion), which is an increase of 15.5% since May 2012. Profits of state owned companies also increased by 5.7% during the same period. Analysts had predicted a rise of just 7-8% for industrial firms’ profits.

Profits Up

Profits Up

Only yesterday analysts were suggesting that the slowdown in the economy was going to take a hold on profits and slow that to just 7-8%. They also stated that they were going to fall even more in the months to come. So, how come the roundabout turn in frog-march fashion with the hike in industrial profits that is up by double the estimates that were being predicted? It certainly begs the question as to the veracity of such statistics. We all heard about the fact that China was faking export data back at the end of May.

Analysts believed there to be even negative activity with regard to economic growth by the 3rd quarter of this year. The suggested figure of 7-8% for profits was a reduction in comparison with April’s yoy figure of 9.3%. But, now, according to the National Bureau of Statistics, figures have shot through the roof. This all comes at the same time when the baking sector is suffering from liquidity setbacks causing tapering in the number of loans being made to small businesses and individuals. It would seem highly dubious as to whether the figures are indeed true given the fact that two of the largest banks have cut back on lending.

The analysts were obviously basing their predictions upon the dull prospects regarding economic growth this year being experienced by China. Chinese exports had their lowest percentage increase this year and showed signs of a considerable slowdown in economic activity. Imports also fell by 0.3% in May in comparison with the previous year (whereas it was expected that there would be a 6% increase). Exports to the USA dropped by 1.6% in May from one year ago. The USA is China’s number one importer.

Much has been said about the growing fears that China doesn’t have such a healthy economy as they might have the rest of the world believe. First-quarter results showed only an increase of 7.7% in GDP growth, which was considered as the alarm bells ringing announcing the bubble bursting. Between January and March 2013, China had the worst economic growth it has experienced in three years.

Analysts have suggested now that investors should not be looking at monthly data as rebounds may temporarily occur, but that overall the Chinese economy is faltering. Tis will probably get worse as the credit crunch and the lack of liquidity deposits hits some of China’s banks hard in the coming months. That being said, there are still quite a few elsewhere in the world that would sell their grannies to get that sort of figure! But if the Shanghai Composite is anything to go by, it signaled today that investors are doing their own thing. The Shanghai Composite was down by 0.08%, by 1.48 points to 1, 950.01.

President Xi Jinping stated mid-May that he would tackle fiscal reform in the country as well as liberalize interest rates. However, injection of stimulus into the economy was out of the question back then. Will this be enough to maintain the hike?

See the original article >>

Corn swings to limits on China-sized errors

By Jeff Wilson

Traders’ forecasts for U.S. corn stockpiles are missing official estimates by an amount equal to China’s annual imports, driving swings in futures markets to exchange-imposed limits.

The average gap in the past 12 quarters was 5.28 million metric tons, twice the error rate in the previous five years, data compiled by Bloomberg show. The U.S. Department of Agriculture updates its estimates tomorrow.

Reserves are getting tougher to predict because of an expansion of storage capacity on farms that isn’t tracked by government inspectors and increased use of alternatives to corn in animal feed. The widening gaps spurred the USDA in September to commission a one-year review of its methodology. Limits on price moves set by the Chicago Board of Trade were reached after nine of 12 reports since March 2010, with an average swing of 5.6%, data compiled by Bloomberg show.

“USDA, traders and consumers are all frustrated by the volatility of the numbers,” said Diana Klemme, a director at Grain Service Corp., an industry consultant in Atlanta, Georgia. “Everyone is going to fasten their seat belts and react to the numbers. I don’t think anyone feels confident.”

Inventories were 2.862 billion bushels (72.7 million tons) on June 1, the smallest for the date since 1997, according to the average of 30 analyst estimates compiled by Bloomberg. The USDA’s last estimate for March 1 was 8.1% above expectations and drove a drop in prices that erased $4.9 billion from the value of stockpiles in two days.

Output Rebounds

Futures for delivery in December, after the harvest, fell 4.5% to $5.4175 a bushel this month. The USDA is forecasting a record crop as output rebounds from last year’s drought, the worst since the 1930s. Goldman Sachs Group Inc. expects corn to drop as low as $4.25 this year while Deutsche Bank AG is forecasting $4.30.

The Standard & Poor’s GSCI Agriculture Index of eight commodities fell 7.8% this month, and the MSCI All- Country World Index of equities dropped 3.5%. Treasuries lost 1.6%, a Bank of America Corp. index shows. Declining crop prices are helping to keep a check on global food costs, which the United Nations estimates rose 2% this year.

U.S. farmers earned more than $112 billion in each of the past two years, with a record $128.2 billion expected in 2013. That compares with $67.7 billion on average in the previous decade, government data show. Some of the cash was used to expand storage, with on-farm capacity of 12.98 billion bushels by Dec. 1, the most since at least 1989, the USDA estimates. The 12% expansion since 2006 compares with a 17% advance in commercial storage to 10.25 billion bushels.

Actual Inventory

On-farm storage gives producers more options for when they sell crops. About 61% of corn is marketed in the first six months of the season that starts Sept. 1, with about 19% sold in each of the next three-month periods, nine years of government data show.

“Farmers are holding more supplies than usual this year, making it more difficult to determine the actual inventory,” said Jason Marthaler, the senior corn merchandiser for CHS Inc., the biggest U.S. cooperative, in Inver Grove Heights, Minnesota. “It’s going to stay volatile until we get to the harvest.”

With reduced supply from 2012, higher-than-average income and planting for this year’s crop delayed by rain, farmers have been reluctant sellers, said Chad Henderson, the president of Prime Agricultural Consultants Inc. in Brookfield, Wisconsin.

Growing State

Corn futures for delivery in July, reflecting grain from 2012, rose 9.1% to $6.6525 since reaching a 10-month low of $6.10 on April 24. Cash prices in parts of Iowa, the biggest growing state, averaged the highest ever this year, according to Roger Fray, the executive vice president for the farmer-owned West Central Cooperative based in Ralston, Iowa.

Tightening supplies before the 2013 harvest are boosting the cost of feed, the single biggest use of corn, Joe F. Sanderson Jr., the founder of Laurel, Mississippi-based Sanderson Farms Inc., the third-largest U.S. poultry producer, told analysts on a conference call June 4.

Inventory-forecasting errors occur mostly because of a lack of information on feed, which the USDA doesn’t track directly. Analysts surveyed by Bloomberg said they estimate stockpiles based on USDA production and export data, as well as the Department of Energy’s estimates of ethanol output. They also take into account seasonal demand patterns for starch and other corn-based food products.

Compound Feed

Prices rose to a record in $8.49 in August, forcing buyers to seek alternatives or shut operations. Hog producers have been able to cut corn use in some cases by 18% by substituting wheat, rice and other food byproducts, said Mark Tarter, the general manager of Effingham Equity Cooperative in Effingham, Illinois, which makes more than 200,000 tons of feed a year. It takes 670 pounds of compound feed, a mix of protein, starch and nutrients, to raise a hog to slaughter weight.

“Livestock feeders have most of their corn needs covered into the start of the harvest,” Tarter said. “We’ve been a net seller of corn during the last three months because of the increased substitution of other grains in livestock rations.”

The USDA’s March report had a margin of error for on-farm corn storage of 4.8%, 5% for soybeans and 5.4% for wheat. Three years earlier, it was 3% for corn, 4.6% for soybeans and 4.2% for wheat.

The government also releases its second survey-based forecast for corn planting tomorrow, after the wettest March-to- May period on record threatened to reduce acreage and yields from North Dakota to Missouri.

Fewer Acres

Corn probably was sown on 95.431 million acres, or 1.9% less than the record 97.282 million farmers intended in March, a Bloomberg survey showed. Some are leaving fields fallow, electing instead to make claims on federally subsidized crop insurance policies, said Bill Gary, the president of Commodity Information Systems in Oklahoma City, Oklahoma, a company providing analysis and information to traders.

About 65% of the crop was in good or excellent condition on June 23, from 64% the previous week and 56% a year ago, the USDA said. Yields may average 156 bushels an acre this year, the third-highest on record and boosting production to a record 13.62 billion bushels from 10.78 billion last year, Gary said.

“The transition from extremely tight supplies during the summer to a more adequate supply into September and October should keep futures in a nervous, erratic state,” he said. “Barring extreme weather in late July, December corn futures are expected to work lower toward the $4 area into harvest.”

See the original article >>
Gold prices continue to face headwinds despite being oversold

By Marcus Holland

Gold futures prices remained in a tight range on Thursday after experiencing another round of liquidation on Wednesday. Futures for gold August delivery tumbled $50 per ounce on Wednesday as traders quickly looked to exit positions as interest rates in the U.S. continued to rise and the dollar remained robust. It appears that the great short dollar trade is now coming to an end, which includes trades against precious metals such as gold and silver.

On Thursday another data point was released in the U.S. that shows inflation in the U.S. is nearly extinct. According to the Commerce Department core Personal Consumption Expenditures, which is the Fed’s favorite gauge of inflation, it increased by .1% on a month over month basis and by 1.1% on a year over year basis. Although the Fed believes that inflation expectation will increase during the second half of 2013 and the first half of 2014, levels that are well below the 2% gauge of inflation for the U.S. will not be helpful to gold futures prices.

On the spending front, which is another gauge that gold futures traders can use to determine if the yellow metal will gain traction, May’s consumer spending increased by .3% in line with expectations from a revised April number that saw a .3% decline. The net spending for the combination of the two months is zero, which is also a difficult gauge to overcome for gold bugs.

Gold position is also working against gold futures bulls. In the latest commitment of traders report released by the CFTC, hedge funds reduced their long positions in gold. According to the CFTC managed money reduced long positions by 6.8K contract while increasing short positions in gold futures contracts by 9K contracts.

The strength in the U.S. dollar has also been a headwind for gold futures prices. A climbing dollar erodes the value of products, such as gold, that are priced in U.S. dollars. The dollar has been on a tear of late as increasing long term interest rates makes the dollar more attractive. Yield on the 10-year note have climbed nearly 100 basis points over the past five weeks, moving up to 2.6%, which is the highest level seen since 2011. Higher yields reflect a strengthening economy, which has yet to be seen with the current batch of economic data. On Wednesday U.S. officials released revised first quarter data that GDP increased by 1.8% compared to the prior reading of 2.4%.

Click to enlarge.

The technical picture for gold futures prices is negative, as the commodity has broken through key support levels near $1,322 and $1,265. Resistance is now seen near former support at $1,265 and then the 10-day moving average at $1,310 (chart courtesy of Banc De Binary).

Momentum on gold futures prices is negative with the MACD generating a sell signal last week where the spread crossed below the nine-day moving average of the spread. The index is printing in negative territory while the trajectory of the index continues to move lower. The RSI on the other hand is printing near 24, which is in oversold territory and could indicate that gold might bounce in the near term.

See the original article >>

Real Disposable Income is Falling at 2008 Rates

by Graham Summers

The biggest single most important item in the GDP report yesterday was the collapse in disposable income for Americans.

Most investors will focus on the drop in GDP growth for 1Q13 and view it as opening the door for the Fed to continue with QE 3 and QE 4 without any tapering in sight.

After all, the markets have believed that bad economic news is good news for the markets for four years based on the belief that a weak economy will mean more money printing from the Fed.

However, the real issue in the BEA’s report on GDP growth was the collapse in real per capita disposable income which fell at a annualized rate of 9.21%.

That is a truly staggering collapse in incomes. The last time we say anything even close to this was in the third quarter of 2008. 

That was right after Lehman failed and the entire economy and stock market were melting down. Buckle up, things are getting worse in the US at a truly alarming rate.

I’ve been warning subscribers of Private Wealth Advisory that the economy was going to turn sharply weaker this year. It’s already begun.

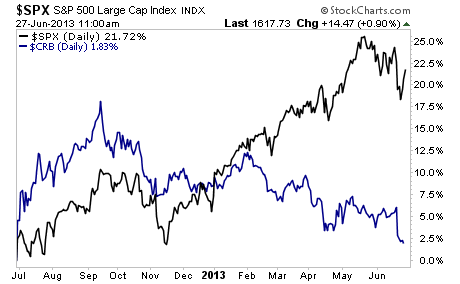
Indeed, while most investors will look at the GDP report as indicating more QE is coming, commodities certainly didn’t get that signal at all. The commodity index continues to plunge diverging wildly from the S&P 500.

One of these asset classes is completely mispricing the economy and the likelihood of more QE. Guess which one it is.

See the original article >>

Four Industry Groups You Should Still Avoid

by Tom Aspray

It was another good day for the stock market as even the downward revision of the first quarter GDP did not stem the buying. The rally has taken the major averages back to the start of stronger resistance.

The futures are higher again in early trading Thursday, and the S&P futures are now back above the 1600 level with further resistance in the 1608-1615 area. The daily technical studies have also rebounded back to resistance but do not yet show signs that the correction is over.

The McClellan oscillator has risen to -48 from its recent low of -276 and does show a pattern of higher lows. A strong move above the zero line would be an encouraging sign. The volume and A/D line analysis both need more work before they could turn positive.

The Spyder Trust (SPY) is now down just over 2% for the month but is still up 12.4% for the year so the double-digit gains for the year are still intact. It has been a much better month for some industry groups while others are acting much weaker that the S&P 500 or the SPY.

These four industry groups are among the weakest in June but are they showing any signs that they are ready to bottom?

chart
Click to Enlarge

Chart Analysis: The Dow Jones Coal Index (DJUSCL) traded as high as 184.83 last October but is currently trading down over 45% from those highs.

  • The break of support, line a, in May signaled that the downtrend had resumed.
  • DJUSCL lost 3.75% on Wednesday and is now down over 25% for the month.
  • President Obama’s comments about carbon emissions hammered an already-weak market this week.
  • The relative performance shows a longer-term downtrend and broke support (line b) in the first week of June.
  • The break of support was also confirmed by the OBV as it dropped the three-month support, line c, in early June.
  • The index is trading at the daily starc - band, and next week, the band will be at 100.20.
  • There is first resistance now in the 110-112 area.

The Dow Jones US Home Construction Index (DJUSHB) has also had a rough month. It is down over 10% this month as the fear of higher mortgage rates has cancelled out the bullish news on the housing sector.

  • The chart shows that the lower trend line support (line d) and starc- band were hit early this week.
  • As noted in a recent Trading Lesson, “if the support in the 440-446 area is broken, then the major 38.2% Fibonacci retracement support is at 405.”
  • The daily relative performance dropped below its WMA on May 20 indicating it was acting weaker than the S&P 500.
  • The DJUSHB is down 16.8% since May 29, but many of the homebuilding stocks have done even worse.
  • The daily OBV dropped below two-month support last week, line f, as the volume was quite heavy.
  • There is initial resistance at 463 with the declining 20-day EMA at 479.

chart
Click to Enlarge

It should not be a surprise that anything to do with mining or the metals has had a rough month. The Dow Jones US Platinum & Precious Metals Index (DJUSPT) is down 21.3% this month.

  • The daily chart shows a series of continuation patterns within the longer-term downtrend, line a.
  • The uptrend from the November lows (dashed line) was broken in February as it declined from 87.50 to 54.50.
  • The rebound from the April lows was broken during the first week of June (see arrow) as the April lows have now been broken.
  • The lower support, line b, is at 45, which is about 14% below Wednesday’s close.
  • The rally in the relative performance in late May and early June failed below the downtrend as the WMA was violated when support was broken.
  • As the rebound was topping in late May, the OBV just barely moved above its WMA.
  • The OBV has plunged in June and is well below its WMA
  • The declining 20-day EMA is now in the 60 area.

Another very weak industry group has been the Dow Jones Mortgage Finance Index (DJUSMF) as it is down over 10%. This was matched by the sharp decline in the REIT market, which was hit hard over fears of early Fed action.

  • The uptrend from the November and March lows, line f, has been broken though DJUSMF rebounded Wednesday.
  • There is initial resistance at 5.23 and the May lows.
  • The relative performance dropped below its WMA on June 14 and has dropped below support at line g.
  • The on-balance volume (OBV) was strong going into the early June highs before it collapsed.
  • The break through the OBV uptrend, line h, was another sign of weakness.
  • The severity of the decline indicates it will take some time before a bottom could be formed.

What it Means: In addition to these four industry groups, the mining, basic resource, and gold mining stocks are also showing double-digit losses.

The relative performance analysis for all, except the home construction index, has been weak for most of the year. Multiple time frame RS analysis can be a valuable tool for determining what sectors to invest in, as well as which ones to avoid.

As I noted yesterday, the RS analysis of the regional banking sector makes it attractive for new buying.

How to Profit. I think the correction in the Dow Jones US Home Construction Index (DJUSHB) will provide a long-term buying opportunity, but there are no signs yet that the index or any of the homebuilding stocks have bottomed. All of the other indexes should still be avoided as well.

See the original article >>

Sugar low may be forming as processors increase refining for ethanol

By Jack Scoville

SUGAR

General Comments: Futures closed slightly lower after trading higher early in the session. Data from Unica in Brazil showed that processors were refining for ethanol more than for sugar, but that there is still plenty of Sugar around. July goes off the Board on Friday. There is still talk that a low is forming or has formed for at least the short term. The Indian monsoon is off to a good start and this should help with Sugarcane production in the country. But, everyone is more interested in Brazil and what the Sugar market is doing there. Traders remain bearish on ideas of big supplies, especially from Brazil. Traders in Brazil expect big production as the weather is good. Demand is said to be strong from North Africa and the Middle East.

Overnight News: Showers are expected in Brazil, mostly in the south and southwest. Temperatures should average near to above normal.

Chart Trends: Trends in New York are mixed to up with objectives of 1770 and 1820 October. Support is at 1715, 1700, and 1665 October, and resistance is at 1760, 1770, and 1790 October. Trends in London are up with objectives of 495.00 October. Support is at 487.00, 484.00, and 478.00 October, and resistance is at 499.00, 503.00, and 508.00 October.

COTTON

General Comments: Futures were lower on currency considerations as the US Dollar moved higher. Traders are also getting ready for the export sales reports this morning and the big USDA reports on planted area tomorrow. Ideas of better production conditions in the US caused some selling interest. USDA showed that conditions in some areas got better while conditions in other areas got worse and this supported markets. Texas is reporting dry weather again. Dry weather is being reported in the Delta and Southeast as well. The weather should help support crop development in the Delta and Southeast, and could help in Texas as some areas of the state saw good rains last week. Weather for Cotton appears good in India, Pakistan, and China.

Overnight News: The Delta and Southeast will see some light showers through this weekend. Temperatures will average near to above normal. Texas will get dry weather. Temperatures will average above to much above normal. The USDA spot price is now 80.96 ct/lb. ICE said that certified Cotton stocks are now 0.596 million bales, from 0.587 million yesterday. ICE said that 221 notices were posted today and that total deliveries are now 1,426 contracts. USDA said that net Upland Cotton export sales were 57,000 bales this year and -7,100 bales next year. Net Pima sales were 10,600 bales this year and 200 bales next year.

Chart Trends: Trends in Cotton are mixed to down with no objectives. Support is at 85.10, 84.00, and 82.80 October, with resistance of 86.40, 86.90, and 88.00 October.

FCOJ

General Comments: Futures closed sharply lower as weather remains mostly good in Florida. The market was also reacting to disappointing retail demand data from Neilsen released on Tuesday afternoon. Better weather in Florida seems to be the big problem for the bulls at this time. Futures have been working generally lower as showers have been seen and conditions are said to have improved in almost the entire state. Ideas are that the better precipitation will help trees fight the greening disease. No tropical storms are in view to cause any potential damage. Greening disease and what it might mean to production prospects continues to be a primary support item and will be for several years. Temperatures are warm in the state, but there are showers reported. The Valencia harvest is continuing but is almost over. Brazil is seeing near to above normal temperatures and mostly dry weather, but showers are possible next week.

Overnight News: Florida weather forecasts call for showers. Temperatures will average near to above normal.

Chart Trends: Trends in FCOJ are down with objectives of 119.00 July. Support is at 125.00, 122.00, and 121.00 July, with resistance at 131.00, 135.00, and 136.00 July.

COFFEE

General Comments: Futures were lower on a weaker Brazilian Real against the US Dollar and also on more talk of big production in Brazil and Vietnam. The production is big, but the cash market remains very quiet. Trends in all three markets are down. Sellers, including Brazil, are quiet and are waiting for futures to move higher. Buyers are interested on cheap differentials, and might start to force the issue if prices hold and start to move higher in the short term on ideas that the market made a bottom. Brazil weather is forecast to show dry conditions, but no cold weather. There are some forecasts for cold weather to develop in Brazil early next week, but so far the market is not concerned. Current crop development is still good this year in Brazil. Central America crops are seeing good rains now. Colombia is reported to have good conditions.

Overnight News: Certified stocks are a little lower today and are about 2.749 million bags. The ICO composite price is now 113.56 ct/lb. Brazil should get dry weather except for some showers in the southwest. All areas could gt showers early next week. Temperatures will average near to above normal. Colombia should get scattered showers, and Central America and Mexico should get showers, with some big rains possible in central and southern Mexico and northern Central America. Temperatures should average near to above normal. ICE said that 0 delivery notices was posted against July today and that total deliveries for the month are now 749 contracts.

Chart Trends: Trends in New York are down with no objectives. Support is at 117.00, 116.00, and 113.00 September, and resistance is at 122.00, 123.50, and 125.00 September. Trends in London are mixed. Support is at 1720, 1705, and 1680 September, and resistance is at 1765, 1775, and 1800 September. Trends in Sao Paulo are down with no objectives. Support is at 140.00, 137.00, and 134.00 September, and resistance is at 148.00, 151.00, and 155.00 September.

COCOA

General Comments: Futures closed fractionally higher. There was not a lot of news for the market, but some are worried about dry weather developing in western Africa right now and there is a lot of smog in Southeast Asia. Ideas of weak demand after the recent big rally kept some selling interest around. The weather is good in West Africa, with more moderate temperatures and some rains. It is hotter and drier again in Ivory Coast this week, but the rest of the region is in good condition. The mid-crop harvest is about over, and less than expected production along with smaller beans is reported. Malaysia and Indonesia crops appear to be in good condition and weather is called favorable.

Overnight News: Scattered showers are expected in West Africa. Temperatures will average near to above normal. Malaysia and Indonesia should see episodes of isolated showers. Temperatures should average near normal. Brazil will get mostly dry conditions and warm temperatures. ICE certified stocks are lower today at 5.008 million bags. ICE said that 57 delivery notices were posted today and that total deliveries for the month are 205 contracts.

Chart Trends: Trends in New York are mixed to down with no objectives. Support is at 2140, 2105, and 2080 September, with resistance at 2200, 2230, and 2250 September. Trends in London are mixed to down with objectives of 1380 and 1270 September. Support is at 1440, 1420, and 1360 September, with resistance at 1470, 1490, and 1520 September.

See the original article >>

Dudley says QE may be prolonged if economy misses forecasts

By Joshua Zumbrun

Federal Reserve Bank of New York President William C. Dudley said the central bank may prolong its asset-purchase program if the economy’s performance fails to meet the Fed’s forecasts.

“If labor market conditions and the economy’s growth momentum were to be less favorable than in the FOMC’s outlook -- and this is what has happened in recent years -- I would expect that the asset purchases would continue at a higher pace for longer,” Dudley said in remarks prepared for delivery today in New York. He serves as vice chairman of the Federal Open Market Committee and has never dissented from a monetary policy decision.

Dudley also said any decision to reduce the pace of asset purchases wouldn’t represent a withdrawal of stimulus, and that an increase in the Fed’s benchmark interest rate is “very likely to be a long way off.” The economy may also diverge from the Fed’s forecasts, he said.

Concerns the Fed may curtail accommodation helped push the yield on the 10-year Treasury note to as high as 2.61% this week from as low as 1.63% in May. Dudley joined other Fed policy makers this week in seeking to damp expectations that an increase in the benchmark interest rate will come sooner than previously forecast.

“Let me emphasize that such an expectation would be quite out of sync with both FOMC statements and the expectations of most FOMC participants,” said Dudley, 60, a former chief U.S. economist for Goldman Sachs Group Inc.

Stocks Rise

Stocks extended gains after Dudley’s comments, with the Standard & Poor’s 500 Index climbing 1% to 1,619.80 at 10:41 a.m. in New York. The yield on the 10-year Treasury note fell to 2.51% from 2.54% late yesterday.

Reports today showed that consumer spending rebounded in May following the largest drop in more than three years, first- time claims for unemployment benefits fell last week and a gauge of consumer confidence climbed to the highest level since January 2008.

Dudley repeated Fed Chairman Ben S. Bernanke’s plan for a reduction in the pace of bond purchases should the economy perform as the Fed expects. He said the Fed may start to pare the current $85 billion monthly pace later this year and end the program around mid-2014.

Dudley spoke a day after a Commerce Department report showed first-quarter growth in the U.S. was less than forecast as a payroll tax increase reduced consumer spending.

Tug-of-War

“I continue to see the economy as being in a tug-of-war between fiscal drag and underlying fundamental improvement, with a great deal of uncertainty over which force will prevail in the near-term,” Dudley said.

A report next week from the Labor Department is forecast to show that the unemployment rate fell to 7.5% this month from 7.6%, according to a Bloomberg survey of economists. Employers probably added 165,000 workers to payrolls, down from 175,000 the prior month. The jobless rate peaked at 10% in October 2009.

Much of the decline in the jobless rate, Dudley said, is a result of workers leaving the labor force. “Job loss rates have fallen, but hiring rates remain depressed at low levels,” he said. “The labor market still cannot be regarded as healthy.”

The FOMC has said it will keep its benchmark rate close to zero as long as unemployment remains higher than 6.5% and the outlook for inflation is no more than 2.5%.

Inflation Goal

“Not only will it likely take considerable time to reach the FOMC’s 6.5% unemployment rate threshold, but also the FOMC could wait considerably longer before raising short-term rates,” he said. “The fact that inflation is coming in well below the FOMC’s 2% objective is relevant here. Most FOMC participants currently do not expect short-term rates to begin to rise until 2015.”

The timeline Bernanke laid out for tapering bond purchases was predicated on the economy growing in line with the FOMC’s forecasts. Central bankers expect growth of 2.3% to 2.6% this year, according to projections released last week. The economy grew at a 1.8% rate from January through March, down from a prior reading of 2.4%.

For the Fed’s outlook to be realized, gross domestic product would have to expand at about a 3.3% average annual rate in the last six months of 2013, according to calculations by economists at BNP Paribas SA in New York.

Stimulus Continuing

Officials speaking after Bernanke’s June 19 press conference have emphasized that the Fed will continue to provide stimulus to the economy even after the bond-buying program ends.

“This asset-purchase tapering is just slowing the rate at which we’re increasing the balance sheet,” Richmond Fed President Jeffrey Lacker, who doesn’t vote on the FOMC this year, said yesterday in a Bloomberg Television interview. “We’re not anywhere near decreasing the balance sheet yet.”

“What we’re talking about here is dialing back,” Richard Fisher, president of the Dallas Fed, said in London on June 24. “The word ‘exit’ is not appropriate here,” said Fisher, who doesn’t vote on policy this year and has been critical of the Fed’s easing policies.

See the original article >>

Stand and Deliver: How Germany Disrupted the World's Gold Market

by Jesse

Someone asked, 'why would there be a desire to do a stealth confiscation of gold from the public holdings in ETFs and private stores through price manipulation?' Who could have been assigned the task of prying bullion out of the hands of the people, and for what conceivable reason? It appears to be happening, but why?
There are any number of possible reasons. Concerns that an innovative new round of QE and money creation might create a run on the gold price is one possibility. There should be little doubt in those who look into the evidence that central bankers are quite sensitive to gold and silver as alternative currencies and reflections of their own policy initiatives.
And that is quite possible. As I have pointed out, there is some precedent for it. In 1933 Franklin Roosevelt pulled back much of the publicly held gold in the US. And after this was done, the government revalued the gold from $20 to $35 overnight, and then used the gains to recapitalize the banking system.
Although this could happen again, it does not seem likely because it flies in the face of everything the central bank has achieved by putting the US on a purely fiat money regime, the last gold ties being severed by Nixon in the 1970s. They prefer to denigrate gold, even though they still hold it, and certainly speak about it quite a bit often through their intermediaries.
There is definitely a movement to revisit the Bretton Woods Agreement that established the dollar as the world's reserve currency. The BRICs, whose economic power is ascendant, are seeking to establish a new currency for global trade that is owned by no single central bank or entangled in the domestic policies of no single country. And they wish to add gold and possibly silver to that mix. And they are in the process of acquiring substantial reserves to accomplish it.
The Anglo-American banking cartel is resisting this movement with all their diplomatic and political might. One of the sensitivities of the recent spying scandal leaks is the concern that they may be trying to obtain intelligence that could be used in these negotiations which are ongoing, very quietly behind the scenes.
But one has to ask, 'what set off the firestorm of price manipulation against gold that started at the beginning of this year?' Unless one is a shill, or naïve about markets, the market operation to knock the price of gold, and also silver, down is fairly obvious and heavy handed. They are not even trying to hide it. Traders do not dump hundreds or even thousands of contracts at market in quiet periods with any other objective than to take the price down. It really is that simple.
My initial take on this was that this was part of the 'price-setting' negotiation for gold and silver in the basket of currencies that the BRICs are developing. But that seemed a bit thin, unless it was seen as a 'last stand' against including gold and silver by making the argument that they were too volatile.
So I looked back on the chart for what I saw was the pivotal moment, and then checked the news and tried to find some event that may have served as the impetus for it. And the truth of it was staring me right in the face.
How remarkable is it that Germany, at the urging of their citizens and despite the objections of their central banks, has requested the return of its sovereign gold from its custodial storage in New York? And that the Feds said, no. You can't have it, but we will be in position to return your own property in seven years time.
What was up with that? Venezuela had recently requested its gold to be returned, and that helped to push the price of gold up to its all time high, because the request had obviously been floated before it became public knowledge.
So why couldn't Germany have the return of its own property for seven years?
Think about this. And perhaps what is happening now will become more clear. It is all a part of the credibility trap, wherein past actions of officials must be hidden in order to protect careers and ensure the orderly functioning of the status quo, even to its own eventual detriment.
Oh this is wrong? This is some weird theory? Well I admit that part of the problem is that we are left to guess what the central banks and the markets are doing with our money and property far in excess of what might be expected in democratic societies. This is the failure of regulation and oversight, and the corrupting power of big money in politics.
But, ok. If this is just some distraction, then give Germany back its gold, in full, this year.
If you wish to prove your word is good and facts are straight, give Germany back its gold.
And if you wish to restore some level of confidence in the markets, make them more transparent and open so people can conduct their business efficiently and safely without fear of being cheated and defrauded at every turn.
If you wish the trust and respect of the world, redeem what you have pledged to hold in trust.   If you have taken some actions in the past that were made in good faith and for good reasons, but are not so clearly so in retrospect, make good on them now.  Do the right thing even if it is not convenient, because it is the right thing to do. 
Prove your full faith and credit to be worthy.  Fulfill your oaths.  Tear down the wall of secrecy that divides the people from their government.
Stand and deliver.

"Oh what a tangled web we weave when first we practice to device."
Sir Walter Scott

See the original article >>

Follow Us