Thursday, June 16, 2011

Major International Market Returns

by Bespoke Investment Group

Although US equities have been under near constant selling pressure since the beginning of May, they have been holding up relatively well compared to the rest of the world. The table to the right shows the change in major international benchmark indices on a YTD basis. In local currency terms, US stocks have outperformed every other G-7 country besides Germany as well as all four BRIC countries. 

These numbers are somewhat misleading, however, as they do not take into account the decline in the US Dollar so far this year. After adjusting for the dollar's slide, US equities lose a bit of their luster. While US stocks are still outperforming all of the BRIC countries, they are underperforming every other G7 country except Canada and the UK.


See the original article >>

Philly Fed: Worst Three Month Decline Ever

by Bespoke Investment Group

Today's Philadelphia Fed Business Outlook came in weaker than expected and showed the largest three month decline in the history of the index (-51.1). To the right, we highlight the three-month change of the overall index as well as each subcomponent of the main index. Strangely enough, even though the headline index for current and future conditions showed its largest ever three-month decline, most of the subcomponents did not. 

In the chart below, we highlight the two other periods where the Philadelphia Fed headline index declined more than 40 points over a three-month period. In 1974, the index dropped 50.5 points in three months, and in November 1981, the index dropped 43.4 points. While the three month decline in the Philly Fed survey should not be dismissed, we would note that it is probably more than a coincidence that the index peaked in March, just when the major earthquake and nuclear meltdown occurred in Japan. Other factors have surely contributed to the slowdown, but we think it's hard to argue that some or much of the slowdown we have seen in the last three months is not related to Japan.


More Thoughts On Feed Wheat Being Substituted For Corn


I know many US analyst and traders will be quick to point out that producers here in the US rarely like substituting "feed wheat" for corn. The problem is feed wheat's widening discount to corn is starting to push up demand for wheat in many Asian countries. They understand that while corn is a source of starch, wheat does provide them with ample protein in their animal feed. Right now there are rumors flying everywhere that many animal feed manufacturers have started covering their import requirements for the October-December quarter, and they are seriously considering a much larger switch to less expensive feed wheat varieties. Currently Australia feed wheat is penciling about $95 cheaper than US corn to the Asia countries. Some are reporting that further down the line this trend will reverse. I am not sure when though, as US new crop corn shipments scheduled from October onwards are still running close to $65 per ton more expensive that Australian feed wheat, and about $40 per tone more than Ukraine's feed wheat. Maybe here in the US, producers aren't making the switch, but with no major corn purchases reported in East Asia for the last two weeks, you have to imagine Asian producers and end users have a different way of thinking. From what I hear, most insiders are looking for a 5-10% shift in feed millers' usage towards wheat and other ingredients and away from corn this year. Some traders are thinking this might already be taking place however, because corn has been selling at a premium to wheat in the cash market over in Asia for sometime now. With the US lowering their corn production estimates and being the world's largest exporter, some Asian nations are starting to worry that wheat may soon be their most viable option. In late April, South Korean buyers purchased 275,000 tons of feed wheat in the span of just two days, mostly from Canada and Europe for shipment in the third quarter. They are now seeking more feed wheat cargoes for September-December shipment. In Japan, similar events are taking place. In Vietnam, the preference is clearly for feed wheat over corn. The Philippines has covered its feed grain import needs through the next few months with purchases of Australian feed wheat earlier this year. All I am trying to say is be careful listening to all of those who want to say no one will really make the switch from corn to wheat...some already have and more will follow should corn prices continue to push higher and availability becomes scarce.

Gold, Commodities, Stocks and Dollar, What's Coming Next!

By: Anthony_J_Stills

Every act you have ever performed since the day you were born was performed because you wanted something. ~ Andrew Carnegie

The media is asking a series of ignorant and self-serving questions that will only confuse the investor and I would like to shed some light on this. Yesterday the stock market rallied and the press immediately anointed the event as the precise moment when things started to get better. They're of course wrong. 


In order for things to actually get better, you have to have an intelligent plan and that plan needs to be implemented by willing and capable people. Washington has no plan and there are no willing and capable people in Washington, only carpetbaggers. Then of course we have this infernal debate about the coming inflation when in fact inflation descended down upon us ten years ago and has probably run its course. Take a look at the chart twelve-year chart of the CRB Index and you'll see what I mean:


We had inflation but the government forgot to send you the memo! Some years saw prices jump as much as 50% and from trough to peak is surged almost fourfold. Now I think it more than likely has run its course and the CRB Index is making a lower high on its way to a serious decline.

The media knows its way behind the curve so it's now beginning to float the idea that we're in for what's called stagflation. Stagflation occurs when you have a combination of rising prices with declining growth. The declining growth in the US is now so obvious that a blind man could see it, but I think they're late to the party as far as rising prices are concerned. I think this is the case for a number of reasons. As I pointed out to you a couple of weeks ago, numerous commodities topped out back in January and February, and with the exception of corn nothing has changed to date. On Monday morning I told you that I had taken an initial short position in corn, wheat, oil and cotton: Take a look at what happened to the July corn futures contract since then:


This morning it broke strong support at 7.34 and looks like it wants to fall off of a cliff. The same is true with wheat, oil and cotton. All of these are subject to worldwide demand and that demand appears to be fading. Now look at the behavior of gold:


Gold has stubbed its toe of late and I have to wonder if it's because it is announcing the beginning of a major deflationary spiral. My best guess is that that's the case!

Now let's turn our attention to the US dollar. The dollar has been the world's whipping boy for a decade and it is now assumed that it must fall almost on a daily bases. I might add that is a dangerous mindset for any speculator to use. If I have learned anything in the markets, it's that nothing is written in stone. Also, when all the lemmings go one way, you had best go the other way. With that in mind let's take a look at this one-year daily chart for the US Dollar Index:


One possible way to look at this chart is to say that the dollar made a significant low in early May and recently made a higher low. Today the dollar is up 1.09 and that is a higher high and a break our above obvious resistance at 75.88. What would cause such a turn around? Simply put, deflation! Everyone is looking for inflation, or stagflation, so they are either short dollars or they borrowed dollars to speculate with Francs, Euros or whatever. Aside from that the world economy is slowing down and it is swimming in US dollar denominated debt. The dollar senses that and begins to rise and that puts a real squeeze on everyone since they all moved to one (wrong) side or the boat. I've also learned that markets are exceedingly ruthless and will always do what you can least afford when you can least afford it. I think there is a real chance that the dollar could move higher for one, three, or even six months, and the effect will be devastating.

All of this of course is taking place in a pre-QE3 world. If the Fed announces QE3 tomorrow then we'll go back to the way it was two months ago. Rising stocks, rising gold and rising commodities prices, but it won't last for long. Right now gold, commodities, stocks and the dollar are all acting as if QE3 will not come to pass, and that's all that matters. Now take a look at the daily chart of the S & P 500:


Yesterday we saw a double-digit rally on light volume and today we see a 21-point decline (so far) on heavier volume and that has been the pattern. Also, today's decline was a 92% down day and that is the third such event in three weeks. Today has produced a lower low (1,261.90) so yesterday was nothing more than a counter trend reaction up to good resistance at 1,286.00, and now the decline will continue until we see a test of the March closing low at 1,251.00. I believe that we'll see a close below the March closing low and a test of strong support at 1,233.00 before we see any kind of decent reaction. That reaction will be the key to the future.


Now you are looking at a twelve-year chart of the S & P and it is telling quite a story assuming anyone is paying attention. You can see how the S & P continued to move sideways out of trading ranges until it finally seemed to exhaust its upward momentum and has turned down. You can see that I've drawn a slightly upward sloping line that connects two significant highs and that will support the market at 1,231.00. This correlates nicely with the 50-dma and the previously mentioned Fibonacci support at 1,233.50 and should provide a bounce. The shorter and weaker the bounce, the more trouble we're in! I would expect a reaction to last no more than twelve days and recover no more than 61% of the initial decline. Time will tell if I am right. Meanwhile the Fed needs to pay very close attention here because once deflation grabs hold no amount of printing will stop it. They fell asleep at the switch back in early 2007 when there were clear signs that real problems existed. Now the Fed is taking a "wait and see" attitude when it should be acting. The money spigot should be wide open and it's not.

We are at a crucial time right now. Everything is signaling deflation although gold and silver did manage gains today. What happens now will define what happens in the stock market over the next year and maybe even the next decade. The Fed can only print and yet QE1 And QE2 have proven that printing is no solution. The next round of quantitative easing, assuming there is one, will have a very short life span. Every one should know that by now and it only serve to kick the can a little further down the road. There are certain factions in Congress that want to force the issue and if they succeed in stopping further increases in the debt ceiling, we'll fall into an immediate a deep depression. None of this would even be an issue if Sir Alan Greenspan had simply left the markets to its own devices fifteen years ago, but he didn't and here we are. I actually hope the US defaults and reality sinks in. Maybe they'll kick all the bastards responsible for this out of Washington and we'll see a real government and a return to real values. We'll know soon enough.

Euro/Dolar spread ...

by Kimble Charting Solutions


See the original article >>

Fibonacci/Repeating patterns calling for a sizable decline in the CRB

by Kimble Charting Solutions


Peak Oil – The Long & The Short


Does it seem like we’ve been here before?

A barrel of Brent Crude (the truest indicator of worldwide oil scarcity) sits at $118, up from $75 per barrel in July 2010 – a 57% increase in eleven months. In the U.S., the average price of gasoline is $3.69 per gallon this week, up 37% in the last year and up 100% in the last 30 months.

The pundits and politicians are responding predictably. They blame the Libyan revolution, the dreaded speculators and that old fallback – Big Oil. When the Middle East turmoil began in earnest in January, gas prices had already risen 15% in three months, spurred by increased worldwide demand and by Ben Bernanke’s printing press. Congressmen have reacted in their usual kneejerk politically motivated fashion by demanding that supplies be released from the Strategic Oil Reserve.

Congress has a little trouble with the concept of “strategic.” They also have difficulty dealing with a reality that has been staring them in the face for decades. Politicians will always disregard prudent, long-term planning for vote-generating talk and gestures.

The Long Term

Peak oil has been a mathematically predictable occurrence since American geophysicist M. King Hubbert figured out the process in 1956. His model predicted that oil production in the United States would peak in 1970. He wasn’t far off. In 1971, when the U.S. was producing 88% of its oil needs, domestic production approached 10 million barrels per day and has been in decline ever since.

(Source: http://www.eia.doe.gov/energy_in_brief/images/charts/
Consumption_production_import_trends-large.gif
)

The Department of Energy was established in 1977 with a mandate to lessen our dependence on foreign oil. At the time, the U.S. was importing 6.5 million barrels per day. In 1985 the country was still able to produce enough to cover 75% of its needs. Today, 34 years later, the U.S. imports 10 million barrels per day, almost half of what it uses.

President Obama’s 2011 Budget proposal included priorities for the DOE:
  • Positions the United States to be the global leader in the new energy economy by developing new ways to produce and use clean and renewable energy.
  • Expands the use of clean, renewable energy sources such as solar, wind and geothermal while supporting the Administration’s goal to develop a smart, strong and secure electricity grid.
  • Promotes innovation in the renewable energy sectors through the use of expanded loan guarantee authority.
That’s what goes on in talk space.

Back on planet Earth, not a single U.S. oil refinery or nuclear power plant has been built since 1977. Decades of inaction and denial have left our energy infrastructure obsolescent and decaying. Pipelines, tanks, drilling rigs, refineries and tankers have passed their original design lives. The oil industry is manned by an aging workforce of geologists, engineers and refinery hands. Many are nearing retirement, and there are few skilled personnel to replace them.

Denial of peak oil becomes more dangerous by the day. The Obama administration prattles about clean energy, solar, wind and ethanol, when petroleum powers 96% of the transportation sector and 44% of the industrial sector. Coal provides 51% of the country’s electricity, and nuclear accounts for another 21%. Renewable energy contributes only 6.7% of the country’s energy needs, mostly from hydroelectric facilities.

Ethanol works nicely as a slogan but poorly as a solution. The ethanol boondoggle diverts 40% of the U.S. corn crop to fuel production. The real cost to produce a gallon of ethanol (tariffs, lost energy, higher food costs) exceeds $7 and has contributed to the price of corn rising 112% in the last year. The 107 million tons of grain that went to U.S. ethanol distilleries in 2009 would have been enough to feed 330 million people for one year.

(Source: http://perotcharts.com/category/challenges/energy/)

The most worrisome aspect of peak oil is that our government leaders have known of it and have chosen to do nothing. The Department of Energy requested a report from widely respected energy expert Robert Hirsch in 2005. The report clearly laid out the dire situation:

The peaking of world oil production presents the U.S. and the world with an unprecedented risk management problem. As peaking is approached, liquid fuel prices and price volatility will increase dramatically, and, without timely mitigation, the economic, social, and political costs will be unprecedented. Viable mitigation options exist on both the supply and demand sides, but to have substantial impact, they must be initiated more than a decade in advance of peaking.
 
Some of his conclusions:
  • World oil peaking is going to happen, and will likely be abrupt. World production of conventional oil will reach a maximum and decline thereafter.
  • Oil peaking will adversely affect global economies, particularly the U.S. Over the past century, the U.S. economy has been shaped by the availability of low-cost oil. The economic loss to the United States could be measured on a trillion-dollar scale.
  • The problem is liquid fuels for transportation. The lifetimes of transportation equipment are measured in decades. Rapid changeover in transportation equipment is inherently impossible. Motor vehicles, aircraft, trains and ships have no ready alternative to liquid fuels.
  • Mitigation efforts will require substantial time. Waiting until production peaks would leave the world with a liquid fuel deficit for 20 years. Initiating a crash program 10 years before peaking leaves a liquid fuels shortfall of a decade. Initiating a crash program 20 years before peaking could avoid a world liquid fuels shortfall.
World liquid oil production has never exceeded the level reached in 2005. It becomes more evident by the day that worldwide production has peaked. 

Robert Hirsch was correct. The world will have a liquid fuel deficit for decades.

The Short Term

The International Energy Agency has been increasing its estimates for world oil consumption to over 90 million barrels per day by the 4th quarter of 2011, led by strong demand from China, India and the rest of the emerging world. World supply was already straining to keep up with this demand before the recent tumult in the Middle East. The mayhem in Tunisia, Egypt, Libya, Bahrain, Yemen and Iran has already taken 1.5 million barrels per day off the market, according to the IEA.

(Source: http://omrpublic.iea.org/)

The Obama administration and mainstream media continue to downplay the economic impact of the conflagration spreading around the world. The risk that oil prices gush toward the 2008 highs is much greater than the likelihood that this turmoil will subside and oil prices fall back to $80 per barrel. As the following chart shows, the daily oil supply coming from countries already experiencing revolution or in danger of uprisings is nearly 8 million barrels per day, or 9% of world supply. No country can ramp up production to make up for that shortfall.
Proven Oil
Oil
Country
Reserves (billion barrels)
Production Per Day
Saudi Arabia
265
9,000,000
Iran
137
3,700,000
Iraq
115
2,700,000
UAE
98
2,300,000
Kuwait
102
2,300,000
Libya
46
1,600,000
Algeria
12
1,300,000
Qatar
25
820,000
Oman
6
810,000
Egypt
4
742,000
Syria
3
376,000
Yemen
3
298,000
The Washington DC spin doctors are now assuring the American people that Saudi Arabia can make up for any oil shortfall. Saudi Arabia has declared it has already turned the spigot on and will produce 10.0 million bpd, up from 8.5 million bpd.

Is this replacement production real? A leading industry expert revealed that the Saudis were already producing 8.9 million bpd in January. Hype and misinformation won’t fill your SUV with cheap gas. Saudi production peaked at 9.8 million bpd in 2005. When prices spiked to $147 per barrel in early 2008, their production grew only to 9.5 million bpd. Saudi oil fields are 40 years old and are in terminal decline. Their “spare capacity” doesn’t exist.

And the media ignore the quality difference between Libyan crude and Saudi crude. Libya’s oil is a perfect feedstock for ultra-low-sulfur diesel. The oil Saudi Arabia will supply to replace it is not. It takes three barrels of Saudi crude to yield the same quantity of diesel fuel as one Libyan barrel of crude, and only specially designed refineries can process high-sulfur Saudi oil.

The problem isn’t just turmoil in the Middle East. The Persian Gulf provides 17% of U.S. imports; 22% comes from Africa, 10% from Venezuela and 15% from Mexico. Many of these countries hate us. Mexico, although a relatively friendly country, will become a net importer of oil in the next five years, as its Cantarell oil field is in rapid decline. They’ll have nothing to sell to us.

The long and the short of it is that sunshine, corn and wind will not keep Americans from paying $5 per gallon or more for gas in the near future. The financial implications are that oil and energy investments will produce solid returns over the coming years.

CREDIT SUISSE: IT’S TIME TO BUY EQUITIES AGAIN

by Cullen Roche

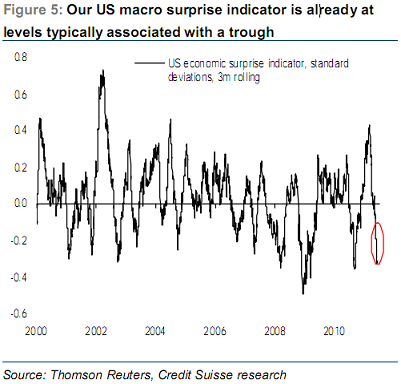
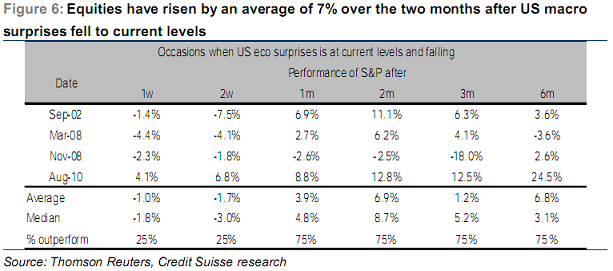
Credit Suisse’s Andrew Garthwaite is sounding the bullish siren after the 8% decline in equities over the last 6 weeks. He says short-term indicators are becoming consistent with market troughs and that the odds of a bounce are increasing. In the note he cited the CS Surprise Indicator (similar to the CitiGroup Economic Surprise Indicator) and notes that equities have tended to rally 7% after readings at these levels:


From a broader perspective, they remain quite bullish on stocks in the long-run and still believe equities have quite a bit of upside into year-end. They see a 1,450 target in the coming 6 months:
“Fundamentally, we remain bullish and stick to our year-end S&P 500 target of 1,450 (our US strategist is more cautious): a) we think this is only a mid-cycle slowdown and look for global growth of 4% this year and for US growth to reaccelerate to 3% in 2H 2011, with global IP momentum bottoming now, according to our fixed income strategy team and our 10-factor indicator of US growth recently stabilising; b) equities offer relative value: the equity risk premium is 6.3% versus our warranted equity risk premium (dependent on ISM and credit spreads) of 4.8% (potentially falling to 4.5% if the ISM improves); c) equities hedge investors against rising inflation, until inflation rises above 4% (currently inflation expectations are 2.4%); d) margins typically peak 7 months after the developed market output gap has closed and the non-financial profit share of GDP is below its 1950-70 average. We forecast 14% US EPS growth this year and 9% next; we estimate releveraging can boost EPS by 10%; e) equities are still underowned by insurance companies, while 85% of mutual fund flows since the start of 2009 have gone into bonds.”

VIX Sell Signal


The VIX broke out today giving its first valid sell signal since February 22. The body of today’s candle was completely outside the 50d x 2sd Bollinger band closing above the previous swing high. This type of action usually indicates that the selling is heading into its climax phase with approximately 1 to 3 more weeks of selling to go. To repeat today’s earlier conclusion – this rules out the triangle pattern completely and leaves 3 possible outcomes: 1) the market is nearing the end of a flat correction that began in February which will be followed by a resumption of the cyclical bull market, 2) the market is nearing the end of a flat correction that is the first part of a combination correction that will last several more months, or 3) the market is in the early stages of a resumption of the bear market. It will probably not be possible to confirm the last option until much more time elapses.
 stocks
At the moment I am beginning to lean more toward option 2, which means traders should be on guard against overtrading and buying into false rallies. Traders will also have to guard against aggressive shorting that will most likely be difficult as most of the selling pressure may be realized in the next two weeks and then again later in the year for a brief period with choppy action in between.

There really is not much to do at the present time for intermediate term traders except sell weak positions, protect profits and stand aside for better days.

FAO Food Price Index vs. Oil Price (Guest Post)


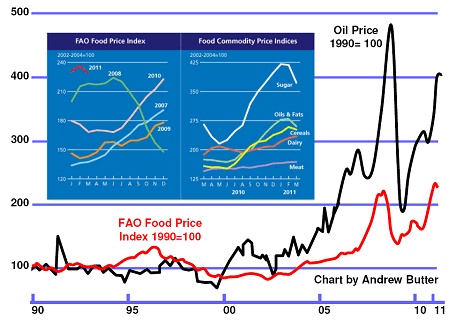
This is a chart of oil prices (Nominal-Brent-30 Day Moving Average) superimposed on the FAO Food Price Index (Nominal) as of April 2011.
crude 30 economy
Three points:
  • Given that energy (mainly oil) accounts for 30% of the cost of food, it’s not surprising that when oil prices went up by a factor of about five since the average in 1990 to 2000, food prices about doubled (5/3 = 1.67…plus whatever).
  • In spite of the dire predictions, the world probably isn’t coming to an end…just yet.
  • The peak in food prices in 2008 slightly preceded the peak in oil prices (by about a month)…so perhaps the food price index (one measure of what the world is ready to pay for oil), is a leading indicator for the oil price?
That’s a thought. The Saudi’s are saying that the current spike is all because of speculators and that the “fair price” is about $90 (they changed their minds on that one, a year ago they were saying $75 was “fair”). 

Perhaps they are getting freaked-out by Donald Trump who’s big idea is to TAKE THE OIL! His argument is that (a) the correct price of oil as far as he is concerned is $40 and that (b) it doesn’t make any sense to have the largest army in the world, and spend trillions in wars, if you don’t make a profit on the enterprise. One wonders how much the price will have to go up before he starts winning votes.

There is a certain logic in that argument, although another option might be to stop spending trillions of dollars, and to either drill more oil in USA and/or persuade Americans to drive Fiat’s or Lambrettas.

Meanwhile, in my humble opinion, the correct price of oil right now is $90 (Brent), that’s as determined by “Parasite Economics” (where America is “Daisy” and the oil producers are the parasites).
I’m sure Donald would love that analogy.

And unless the schizophrenia about replacement cost takes hold, that story-line says oil prices are going to $70, someday soon.

Shiller Sees ‘Substantial’ Probability of Recession

By Bradley Davis

Noted economist Robert Shiller said Wednesday there was a “substantial” probability the U.S. could lurch again into recession.

Noting weak global data — including a stubbornly depressed U.S. housing market — were flashing warning signs, the Yale University economist said the economy right now faced a “tipping point.”

“Forecasting models would say no” on the question of whether the U.S. will face a double-dip, Shiller said. “But I’m seeing signs that encourage me to worry about that.”

Shiller, who is one of the two men behind the S&P Case-Shiller home-price index, said home prices could still decline despite being lower than where they were more than five years ago. The summer season could see a pickup in prices, he said, but “I still worry about the general downtrend.”

“There might be a turnaround if psychology changes,” he said. But “I fear that it may just continue down.

“It just doesn’t look good,” he said in an interview with The Wall Street Journal.

General confidence about the economy is waning, Shiller said, leading to a so-called liquidity trap, in which the Federal Reserve has pumped the economy full of stimulus and consumers are still not opening their pockets.

“When the demand isn’t there, you can lower interest rates all the way to zero and people are still not willing to spend — that’s where we are right now,” Shiller said.

Meanwhile, as Greece teeters on insolvency, Shiller said the continuing stream of negative headlines was likely to have a negative impact on global confidence. “Stories like this, even if it’s from a small country, can have a vivid impact,” he said.

“I don’t think it’s overblown,” Shiller said of concerns Greece could threaten to topple the global financial system much the way the failing of Lehman Brothers brought the global system to its knees in 2008.

Related News:China .Soros Says China Missed Window to Stem Inflation, Now Risks ‘Hard Landing’

By Josiane Kremer

China has missed its opportunity to stem inflation and may now risk a hard landing, billionaire investor George Soros said. 

The world’s second-largest economy is in a “bit of a bubble,” Soros, 80, said today at a conference in Oslo. There are some signs that China is “losing control,” he said. 

China today ordered lenders to set aside more cash as reserves after inflation last month accelerated at the fastest pace in almost three years. Consumer prices rose an annual 5.5 percent in May, even after the central bank raised interest rates four times since September. Inflation has exceeded the government’s 4 percent target every month this year. 

China’s formula for steering its economy is “running out of steam,” Soros said, adding the country is seeing the beginnings of wage-price inflation. 

At the same time, efforts to restore growth in the U.S. and Europe have failed to address underlying imbalances and the global economy is not “out of the woods at all,” Soros said. 

Banks have “not been properly recapitalized” and “underlying imbalances have not been corrected,” he said. 

Recovery prospects are being hampered by the fact that the “authorities are not providing a solution,” he said.

Europe has yet to persuade investors its single currency is a functioning system and the euro continues to have “inherent problems,” Soros said. The region is displaying a “two-speed” recovery, led by Germany, while the region’s bailout recipients Greece, Ireland and Portugal struggle to stay afloat.
Turning to Africa
 
In the U.S., policy makers are trying to balance the target of job creation against the need to reduce debt levels. The World Bank last week cut its estimate for global growth this year to 3.2 percent from a January estimate for 3.3 percent expansion. 

Soros said economic turmoil in the developed world is prompting him to turn to Africa, a region he called a “very attractive area to invest in,” adding he is “very much engaged” there. 

Soros is chairman of Soros Fund Management LLC, which has about $28 billion in assets. He is best known for reportedly making $1 billion in 1992 on a successful bet that the U.K. would fail to keep the pound in a European exchange-rate system that pre-dated the euro.

Investing like it's 1999: Tech bubble 2.0 is here


With alarmists sounding the alarms and naysayers saying, “nay,” it’s certainly looking very similar to the way things were over a decade ago right before the dotcom bubble burst. Did we learn our lesson back then or are we in the process of repeating our mistakes?

Few can argue against the concept that we’re in another tech bubble. The only real debate is whether or not the bubble will burst. With Facebook leading the way with valuations far exceeding prospects of revenue and slowdown in growth, it’s the poster child for both high-value investors as well as those warning of a more catastrophic collapse than we saw the first time.

This infographic by our friends at Udemy breaks down some of the key points hinting towards a bubble bursting. Whether it’s imminent, a few years away, or never to happen at all, we should still take a look at the data and make educated choices of how to spend our time and money. If the bubble bursts this time, the effects will be felt more universally thanks to a much higher reliance on the web in day-to-day life.
Click to enlarge.

Tech Bubble 2.0

Follow Us