Saturday, March 8, 2014

Happy Birthday Bull!

by Bespoke

The bull market for stocks that began off the lows on March 9th, 2009 turns five years old this weekend, and what a bull market it has been!  Following its lows on 3/9/09, the S&P 500 Index has more than doubled, gaining 1,195.72 points or 176.74%.  Assuming all dividends were reinvested, $1,000 invested in the S&P 500 at the lows would be worth $2,087.09 today.  There have been rough patches, but the strength in stocks for the last five years counts as one of the best periods to own equities in the last century.  Below are nine charts telling the tale of the market, including major index performance, valuations, sector performance, large cap versus mid cap versus small cap performance, equity performance versus Treasuries, and US equity performance versus G7 and BRIC countries. 

We've also included two tables comprised of the twenty best and twenty worst performing stocks over the last five years, selected from current members of the S&P 500.  Regeneron (REGN), Wyndham (WYN), and CBS (CBS) have all exploded upwards by over 2000%, but their performance pales in comparison to General Growth Partners (GGP): an astounding gain of 7,775% over the last five years.  On the other end of the spectrum, only 11 of the stocks currently listed in the S&P 500 had negative returns over the course of the bull market, lead by a 47.37% decline in First Solar (FSLR), which remains the most volatile name in the index as measured by average absolute percent change over the past year.

In addition to the charts and tables below, we're celebrating the 5-year anniversary of the bull market with a 10% discount on our Bespoke Newsletter and Bespoke Premium services!  Our paid content is where you'll find our thoughts and analysis on whether or not this bull market can make it to six years old.  Just use the code 'birthdaybull' at checkout between now and Monday morning to receive the discount.  New subscribers will also receive a complimentary game of 'Collapse', the family-friendly game that commemorates the events of the 2008 financial crisis!  Navigate the turbulent waters of the crisis with an exciting game of 'Collapse'!

See the original article >>

Years needed for LNG exports to blunt Russian energy sales

By Brian Wingfield

U.S. efforts to speed natural gas (NYMEX:NG.C) exports as a way to loosen Russia’s grip on European energy supplies may be thwarted by lengthy reviews and developer reluctance to proceed with multibillion-dollar projects.

Russia’s military escalation in Ukraine is spurring calls in Congress for quick U.S. approval of plans to export liquefied natural gas from plants owned by companies including Cheniere Energy Inc., Dominion Resources Inc. and Sempra Energy. Russia provides 30 percent of Europe’s gas needs using pipelines that cross Ukraine.

“I view this as an incredible opportunity for the United States to highlight its position as an energy superpower,” Representative Cory Gardner, a Colorado Republican, said yesterday in a phone interview after introducing legislation to streamline the federal review of pending export projects.

While the shale-gas boom has made the U.S. the world’s largest natural gas producer, efforts to ship the fuel are bogged down by rules, financing needs and construction demands. Winning U.S. approval can take three years or longer, and not all companies planning a project are committed to completing the work.

Only one facility, Cheniere’s $10 billion Sabine Pass terminal in Cameron Parish, Louisiana, has the required approvals from the Energy Department and U.S. Federal Energy Regulatory Commission. Shipments are scheduled to start in late 2015, according to the company.

More Work

Russia’s OAO Gazprom today threatened to disrupt Ukraine’s natural gas supply if it doesn’t pay $1.89 billion owed to the company for recent shipments, according to a statement from Gazprom Chief Executive Officer Alexey Miller. Russia last cut off Ukraine’s gas supplies in 2009 over a similar dispute.

“We only have one approved license actually, and the molecules still aren’t going to flow for a while,” Energy Secretary Ernest Moniz told reporters March 5 at a conference in Houston. After the Cheniere license, the most optimistic view for the next set of LNG shipments to leave the U.S. isn’t until 2017 or 2018, according to Moniz.

“So, there’s still quite a ways to go,” he said.

Canada, Mexico

The U.S. is exporting some natural gas to Canada and Mexico, almost all by pipeline. Sending the product to Europe would require infrastructure that doesn’t exist: plants to super-freeze the gas into a liquid suitable for transport on special tankers. The only U.S. plant for LNG, operated by ConocoPhillips in Alaska, has been shut since 2012.

Lawmakers are exploring ways to help Ukraine and the European Union -- which depend on gas supplies from the east -- after Russia occupied Ukraine’s Crimean peninsula and escalated months of political unrest. The House yesterday passed a bill to provide $1 billion in loan guarantees sought by President Barack Obama’s administration to aid the former Soviet republic. The Senate hasn’t yet acted.

U.S. financial aid to may ultimately end up in Russia anyway if Ukraine needs to pay its eastern neighbor for natural gas, said Amit Khandelwal, a professor at Columbia University’s Graduate School of Business in New York.

“Money’s fungible,” he said in a phone interview. If the U.S. were to stipulate that aid couldn’t be used to pay gas debts to Russia, Ukraine could free up money from another source, Khandelwal said. “It’s just moving money around.”

Ukraine would need to receive natural gas from another source in order to prevent having to pay Russia for its gas supplies, he said.

Production Boom

Advances in drilling techniques, including hydraulic fracturing, or fracking, have boosted U.S. production of the fuel by 35 percent from a decade-low 18 trillion cubic feet in 2005, according to the U.S. Energy Information Administration. Since the Energy Department approved Cheniere’s application in May 2011, natural gas production has increased 8 percent.

The glut has reduced U.S. energy prices, prompted a manufacturing boom and prompted some lawmakers to urge keeping supplies steady at home to support domestic jobs. Exporting to nations willing to pay more might cause U.S. prices to climb.

“We should not give away the domestic economic and national security rewards of our natural gas boom, and then just hope that the market reduces the risk of international conflicts,” Senator Edward Markey, a Massachusetts Democrat, said yesterday in a statement. He offered a bill to require further Energy Department scrutiny of natural gas exports to determine if shipping abroad is in the national interest.

Energy, FERC

The path to approval for gas-export projects is complex. Exporters need an Energy Department permit to ship the fuel to countries that don’t have a free-trade agreement with the U.S. - - such as Japan and those in the 28-nation EU. The FERC conducts a separate environmental and safety review. State regulators also weigh in.

The FERC and Energy Department reviews can take one year and as long a two before a decision is made.

The agencies review projects as expeditiously as possible, on a case-by-case basis, spokesmen for the agencies have said.

The Energy Department has approved six applications for export projects that would process 9.07 billion cubic feet of liquefied natural gas a day. It’s weighing 24 applications for projects to handle more than 31 billion cubic feet. The U.S. produces an average of 69 billion cubic feet of gas a day.

Ukraine Needs

Representative Fred Upton, who heads the Energy and Commerce Committee, endorsed Gardner’s bill, which would approve all pending LNG-export projects that had received a notice in the Federal Register as of yesterday. Projects would still need to clear a federal environmental and safety review.

“Passing this legislation sends the clear signal that America intends to take full advantage of our energy resources,” Upton, a Michigan Republican, said in a statement.

Lawmakers want to expedite the approvals so U.S. allies, such as nations in Europe that get about 30 percent of their natural gas from Russia, will have more options.

Ukraine in 2012 consumed about 1.9 trillion cubic feet of natural gas, or a daily average of about 5.1 billion, according to the U.S. Energy Information Administration. The European Union consumed about 16.8 trillion cubic feet, an average of about 50 billion a day.

“The situation in Ukraine illustrates why we need to keep pushing aggressively for these projects,” Mike Saccone, a spokesman for Senator Mark Udall, a Colorado Democrat, said by phone. Udall, Gardner and Representative Mike Turner, an Ohio Republican, introduced bills to expand the list of nations that would benefit from a streamlined review for export applications.

Asia Shipments

Dominion expects its Cove Point facility in Maryland, about 60 miles (97 kilometers) southeast of Washington, to complete the FERC review early this year. The project has contracts to deliver fuel to Japan and India, according to data from Poten & Partners Inc., a New York-based ship broker.

Sempra is anticipating approval for its Cameron LNG export terminal in Hackberry, Louisiana, by July 1. The facility has contracts for deliveries to Japan and Taiwan.

Cove Point, which may cost as much as $3.8 billion to construct, would start shipping LNG in late 2017. Cameron, a $9 billion to $10 billion project, also would start shipments that year. The plant won’t be in full operation until 2018.

Closely held Freeport LNG Development of Houston in the past year won Energy Department approval to build then expand an export terminal at Quintana Island, Texas. The company, with contracts in Japan and South Korea, expects FERC approval in the second half of this year, according to its website.

Using Crisis

While Energy Transfer Equity LP and London-based BG Group Plc have Energy Department approval for an export facility at Lake Charles, Louisiana, the companies haven’t committed to building the project and haven’t yet filed a formal application with the FERC.

“Using this crisis as an excuse to rapidly and massively expand exports of America’s natural gas won’t help Ukraine now,” Markey said. “What massively exporting America’s natural gas will do is undercut American manufacturers trying to create jobs.”

See the original article >>

Five Years Of "Progress"

by Tyler Durden

Presented with no comment...

See the original article >>

SPY Trends and Influencers March 8, 2014

by Greg Harmon

Last week’s review of the macro market indicators suggested, as the page of the calendar turned into March that the equity markets were again looking strong. Elsewhere it looked for Gold ($GLD) to consolidate or pullback in its uptrend while Crude Oil ($USO) consolidated with an upward bias. The US Dollar Index ($UUP) looked in trouble and moving lower while US Treasuries ($TLT) were biased higher. The Shanghai Composite ($SSEC) was ready to get a short term bounce and Emerging Markets ($EEM) looked to continue sideways with an upward bias. Volatility ($VIX) looked to remain low keeping the bias higher for the equity index ETF’s $SPY, $IWM and $QQQ. Their charts also looked higher with the SPY and IWM stronger than the QQQ.

The week played out with Gold moving back and forth in a range while Crude Oil finally found some resistance and pulled back. The US Dollar managed only a Dead Cat Bounce and fell lower while Treasuries pulled back from a double top. The Shanghai Composite is being manhandled by the 50 day Simple Moving Average above and Emerging Markets tested breakouts both higher and lower only to end near unchanged. Volatility remained after a 1 day scare Monday from the Ukraine events. The Equity Index ETF’s used the pullback to gain energy for new highs before giving some back Friday. What does this mean for the coming week? Lets look at some charts.

As always you can see details of individual charts and more on my StockTwits feed and on chartly.)

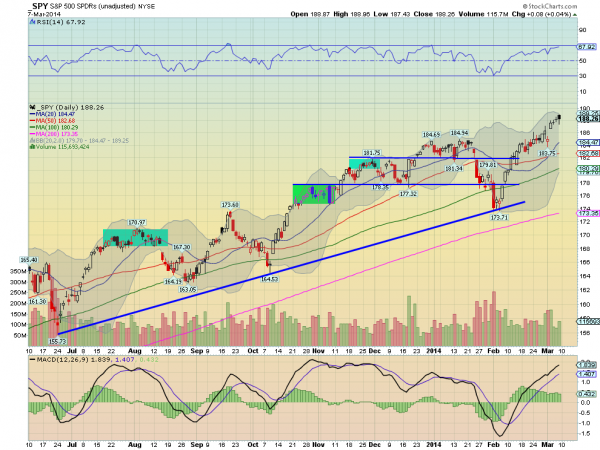
SPY Daily, $SPY
spy d
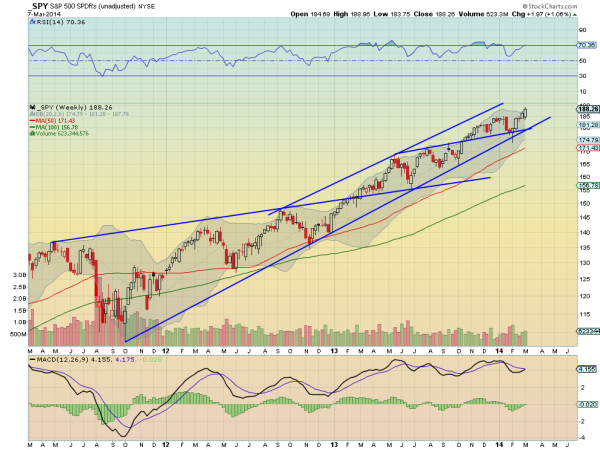
SPY Weekly, $SPY
spy w

The SPY started the week with a gap down, like many expected given the saber rattling over the Ukraine. But the pullback re-energized it and it gapped higher Tuesday to new all-time highs, continuing the rest of the week before a pullback Friday. The Friday candlestick, has several bearish characteristics. It is a Hanging Man, a potential reversal candle, a bearish Engulfing Candle and as it is Solid Black shows bearish intraday price action. All raise the caution flag for a short term trader. But the RSI is bullish and strong with the MACD rising, both supporting more upside. Moving out to the weekly chart the picture is much more bullish. The bullish engulfing candle following the move higher last week, is accompanied by a RSI that is rising and bullish and a MACD that is about to cross up. This suggests any pullback might be very short lived. There is resistance at 188.96, Friday’s high and then Measured Moves to the 195-197 area above. Support lower comes at 186.75 and 185 before 183.75 and 181.80. Continued Upward Price Action.

Heading into the next week the equity markets look positive. Elsewhere look for Gold to consolidate with an upward bias while Crude Oil remains on the short term upward path. The US Dollar Index looks weak and ready to move lower while US Treasuries are also biased lower in their consolidation zone. The Shanghai Composite and Emerging Markets are set up to continue their consolidations from this week with Emerging Markets holding an upward bias. Volatility looks to remain subdued keeping the bias higher for the equity index ETF’s SPY, IWM and QQQ. Their charts favor the upside as well, fairly strongly in the SPY and IWM and less so in the QQQ, with all at risk for a very short term intra-week pullback. Use this information as you prepare for the coming week and trad’em well.

See the original article >>

Currency Positioning and Technical Outlook: Better Dollar Tone Coming

by Marc Chandler

The euro and Swiss franc rose to new highs since Q4 2011, while sterling moved to within half a cent of the best level since 2009 set in mid-February in recent days.  The market was all rife with speculation of a break out.  However, our reading of the technical and fundamental condition, suggests dollar bears tread carefully.

If the past week was about the lack of escalation in both Russia/Ukraine and China, coupled with the ECB holding pat, next week may see the pendulum swing back a bit. This could lend itself to a more consolidative trading, which in the current context, may be somewhat supportive of the greenback. 

With a referendum planned in Crimea next weekend that will likely lead Russia's annexation, the confrontation may escalate again.  Although the yuan strengthened in the past week, we suspect that uncertainty spurred by the first on-shore default and the apparent official desire to inject more volatility may weigh on the yuan..  China unexpectedly reported a large trade deficit in February, and although it was the distorted by the lunar new year, some will see evidence that the yuan is now over-valued.  The ECB did not change policy, but the large pay down of LTRO borrowings, and the strength of the euro, may spur speculation that the door to easing has not closed.  Moreover, official efforts to jawbone the euro lower may also increase. 

Euro: The rally in the second half of last week, left the euro stretched.  This is illustrated by the fact that it spent the pre-weekend session above the top of its Bollinger Band (two standard deviations about the 20-day moving average).     That last time it did anything close to this was in mid-September last year.     In addition, its proximity to the psychological and technically significant $1.40 area may change the risk-reward calculations for many participants.   This is not to say that a deep pullback is necessary, but we can see a move back into the $1.3780-$1.3825 band. 

Sterling: Short-term market positioning, judging from the Commitment of Traders remains extreme for sterling.  This might help explain the market's cautiousness as sterling approached $1.68.  There is a mild bearish divergence that is evident on the daily RSI.    Support is seen $1.6640-60.   Separately, we note that the euro's downtrend against sterling from last August high near GBP0.8770 has been approached.  We draw it coming in on Monday, March 10 near GBP0.8310, which is near the top of the Bollinger Band,  and GBP0.8298 by the end of the week.  While a convincing break has to be respected, we are bit wary. 

Yen:  The dollar is over-stretched against the yen.  At its high, the dollar was nearly 3 standard deviations away from its 20-day moving average (~JPY103.55).  The top of the Bollinger Band comes in near JPY103.10.     By this measure, the dollar is the most stretched against the yen as it has been in years, including the earlier run-up in anticipation of Abenomics beginning in late-2012.     We had suggested dollar potential into the JPY103.10-65 band, and now that it has reached it, we suspect a consoldative phase is near, especially if we are correct about the larger investment climate.  Initial support for the dollar is pegged near JPY102.80-JPY103.10 now, with additional support near JPY102.50. 

Canadian dollar:   The optics of Canada's jobs data were worse than the details, but the Bank of Canada is now the most dovish within the dollar-bloc.  The US dollar tested important technical resistance near CAD1.11 before the weekend.  This corresponds to a retracement objective and a trend line off the Feb 21 high near CAD1.12.   Our reading of the technical indicators warn that the dollar will likely rise through the CAD1.11 area and test CAD1.12 in the days ahead. 

Australian dollar:     With the help of spectacular first tier data, especially robust retail sales and trade surplus, the Australian dollar was the strongest currency last week gaining about 1.75% against the US dollar.  It closed on March 6 above the top of its Bollinger Band, for the first time since mid-January and moved back barely within in before the weekend.  The close was near its lows after new four month highs were recorded.   The close below $0.9080, which corresponds to both the 100-day moving average and the minimum retracement objective of the Aussie's slide since last October, warns of additional near-term losses. There is potential from a technical point of view back into the $0.9015-40 range.    On the upside, the $0.9200 is an important psychological level and coincides with the 50% retracement objective of the slide. 

Mexican peso:   The peso participated in the move against the dollar at the end of last week.  After breaking  below the lower end of the trading range since mid-January around MXN13.20, the greenback found support near MXN13.11.   Technically, we see the risk that the break is not sustained and the greenback moves back into the MXN13.20-MXN13.40 trading range and possibly toward the middle to upper end again.  On March 6, the US dollar closed below the bottom of the Bollinger band for the first time since last September.  It moved back into the band before the weekend.  The 20-day moving average, the middle of the Bollinger Band comes in near MXN13.26 and that seems to be the immediate risk. 

Observations from the speculative positioning in the CME currency futures:

1.  Position adjustments remained minor.  In the previous reporting period there were no gross position changes of more than 10k contracts.  In the most recent reporting period there was one:   the gross long euro position rose 10.9k contracts to 103.9k.  This is the largest gross long position since last November.    There were no other gross position adjustment that exceeded 6k contracts.

2.  Among the small adjustments, the general pattern was to add to gross short currency positions.  They were only reduced in sterling (-4.3k contracts to 41.4k) and peso (-2.6k to 29k contracts). In both of these currencies, exposure was reduced as both the longs and shorts were pared. 

3.   Outside of the euro, which as we have noted saw a large rise in the gross longs, the gross longs of the other six currencies we review were evenly split between buying and selling. 

4.  The gross long euro and sterling positions dominate the speculative currency future long positions (103.9k and  71.0k respectively).  None of the other currencies' gross long position is more than 24k.   The 12.2k gross long Australian dollar futures position and the 6.2k peso futures position seems particularly small.  It may be begging for a contrarian stance, but as we note above the technical outlook suggest this is not the time. 

5.  The gross short positions are less concentrated.  The yen, of course, is the leader with 100.1k gross short futures contracts, but the euro's 80.4k and Canadian dollar's 84.4k contracts are also substantial.  They are followed by the Aussie (53.4k contracts) and sterling's gross short 41.4k contracts).  The lower level of gross short peso (29.0k contracts) and franc (19.7k contracts), in part simply reflects the lack of participation presently.  . 

See the original article >>

The Week Ahead: Is Buffett a Market Timer?

by Tom Aspray

It was another wild and quite volatile week in the global markets, but once again those bullish on the US stock market won out. Though there has yet to be any solution in the Ukraine crisis, the initial fear that it will develop into a global crisis has subsided for now.

The sharp drop last Monday frightened some out of their long positions and encouraged the market skeptics. Meanwhile, investing legend Warren Buffett, hardly a market timer, pegged it as a buying opportunity.

This view was confirmed by the new all-time highs the following day as those who went short, Monday, were punished on Tuesday. The new all-time highs in the NYSE Advance/Decline made this sharp spike in selling characteristic of a pullback instead of the start of a more significant correction.

In terms of back-to-back months, we are entering one of the strongest periods of the year. Over the past 63 years, the average gain for March and April is 2.49%. Stocks have been up these months over 66% of the time.

chart
Click to Enlarge

Only November and December have shown a higher historical return. There are quite a few markets, which are being watched closely by global investors. As I mentioned last week, many stock investors have stayed on the sidelines because of the bond market. The weekly chart shows that the yield of 10-year T-notes is still locked in a broad trading range, lines a and b.

Those who are not buying stocks are wondering why yields are not much higher if the economy is really as strong as stock prices suggest. The downtrend in the MACD, line c, is not yet warning of an imminent upside breakout in yields, but I do expect one in the first half of the year. Yields rose from 2.720% to 2.786% on Friday in reaction to the jobs data.

The gold market is also getting much more attention as the weekly chart shows that the downtrend, line d, from the late 2012 highs, line d, has now been tested. Gold was down, Friday, in reaction to the jobs report. The weekly OBV has moved through resistance at line e. This confirms the weekly bullish divergence, line f, and suggests a correction will be well supported.

Overseas the news from the Eurozone was upbeat as the ECB raised its growth rates and left interest rates unchanged as inflation edged slightly higher. They continue to worry about deflation and it will likely take much higher inflation to make the ECB comfortable enough to raise rates. Continued low inflation could spur a cut in rates. The euro has been gaining strength over the past six weeks as it has risen from below 1.35 to over 1.38.

chart
Click to Enlarge

The manufacturing data in the Eurozone continues to improve as now even Spain and Italy are showing improvement with the best rate of expansion in over three years. The PMI Output Indexes for the developed world are all well above 50 and the UK’s rate has broken through resistance (line a) and made a multi-year high.

All are still clearly rising, line b, but data reflects some weather-related softening in recent months. The data for emerging markets still looks weak, and even though there has been some improvement from India, its Index is still in a steep downtrend, line c. This data could turn around by the second half of the year.

There is still a high degree of bearish sentiment on the emerging markets, but I think the continued improvement in the developed world will lead to increased consumption of emerging market goods.

The emerging markets were my contrary opinion play from last August. I recommended a dollar cost averaging strategy. As said then “for Vanguard FTSE Emerging Markets ETF (VWO), I would divide the amount you want to invest, say 5% of your portfolio, and then divide it into six equal parts. The first should be invested on September 3 and then invest another equal portion every three weeks. This will make you fully invested before the end of the year.”

chart
Click to Enlarge

The final investment would have been made on November 26. Based on six equal investment of $2000, this position is currently down about 2% as the average price, including reinvesting the dividends is $39.98. This is based on a portfolio of approximately $250,000.

The weekly chart shows that VWO is currently trading at $39 with a long-term flag formation evident on the chart, lines a and b. A weekly close back above the $40 level would be a positive sign and the quarterly pivot is at $41.20. The weekly OBV is trying to bottom out, but is still well below its declining WMA and the major downtrend, line c.

Once we get strong signs of a bottom, I will look to add to this position and I would not want to see a weekly close below the $36 level. Earlier, VWO was also recommended in the Charts in Play portfolio and this position was stopped out for a 4.5% loss.

There were some interesting developments out of China in the past week or so as their currency the renminbi or yuan had its biggest decline in years. Some have concluded that the government-encouraged decline is designed to make China less attractive to speculators. There are some early signs that it may be working.

The other news out of China concerned Shanghai Chaori Solar, a small solar energy company that defaulted on its bonds as it was unable to pay the interest. Those who are bearish on China see this as a warning of much bigger problems ahead, but I think it was more likely part of the government’s overall strategy.

The much-better-than-expected data on manufacturing last Monday was ignored by the plunging stock market. The chart of the Markit US manufacturing Index shows the sharp upturn last week as it has clearly broken through its resistance (line a), which favors further strength in the months ahead. The weaker-than-expected ISM-Non-Manufacturing Index on Wednesday did make the stock market a bit more nervous.

chart
Click to Enlarge

The better-than-expected jobs report on Friday was followed by weak numbers on factory orders, which fell 0.78%. The calendar is much lighter this week with the jobless claims, Retail Sales, Import and Export Prices, along with Business Inventories out on Thursday. On Friday, we get the Producer Price Index.

What to Watch
The new highs in the S&P 500 were given a huge test on Monday as the conflict in the Ukraine put stocks under heavy pressure from the opening. The selling was quite heavy as noted by the high readings in the Arms Index. As I noted in last week’s trading lesson, this was more characteristic of a pullback than the start of a deeper decline.

Friday’s action was pretty choppy as most of the major averages could not hold the initial strong gains in reaction to the surprisingly good jobs report. Still the major averages closed with nice gains for the week but mixed on Friday.

Despite the lofty levels of the key market averages, and with many wondering how much higher the market can go, there are no signs yet of a significant top. Further sharp selloffs, and even a several-day correction, are clearly a possibility and could be triggered by economic news or more saber rattling by Russia.

The market continues to rotate between sectors as the previously strong utilities have given up some of their gains while the recently recommended regional banking sector is doing quite well. The SPDR S&P Regional Banking ETF (KRE) is up 10% in just the past 12 trading days.

The transportation stocks are also doing quite well as the Dow Transportation Average moved above the January highs on Friday, making a new all-time high. Last week, I took a look at some transportation stocks that looked quite strong.

The monthly review of the Dow Industrial stocks also revealed some large-cap, high-yielding stocks that were back to important support. Though the Industrials are still the weakest market sector, with yields like T-notes and growth potential, these stocks may soon look more attractive.

The sentiment was little changed from last week according to AAII, 40.51% are bullish and the bearish percentage has risen to 26.6% from 21.1% the past week.

Looking at how many stocks are above their 50-day MAs, shows that they are just above the mean in the S&P 500 as the five-day average is at 71.1%. It has not yet moved above the previous peak but is still below the highs seen in late 2013.

chart
Click to Enlarge

This week, I thought I would look at the super-hot Nasdaq 100 as the PowerShares QQQ Trust (QQQ) has been a leader this year. As I noted last week in my review of healthcare stocks, biotech has lead this index higher but did look a bit more toppy late in the week.

The five-day MA of Nasdaq 100 stocks was at 68% as of last Thursday’s close, which is still below the November peak of 75%. The downtrend is now in the 80% area, line a. If this % starts to roll over, it may be warning of further correction is likely.

The weekly chart of the NYSE Composite shows the new highs last week after a brief break of the prior week’s lows on Monday. The weekly starc band will be at 10,660 this week, which corresponds to the upper boundary of the trading channel, line a. The quarterly projected pivot resistance is at 11,048.

The rising 20-day EMA was tested last Monday and has risen now to 10,341. Monday’s low was 10,276, just above the level of 10,268 I pointed out last week. The monthly pivot for March is at 10,221 with further support in the 10,000 area.

chart
Click to Enlarge

The weekly NYSE Advance/Decline is well above its resistance at line c, as it broke out at the end of the year. It is well above its rising WMA. The daily A/D line (not shown) also made new highs last week.

The new highs have been confirmed by a new high in the NYSE OBV as its WMA is just starting to move higher.

chart
Click to Enlarge

S&P 500
The weekly chart of the Spyder Trust (SPY) still looks strong with last week’s action. The weekly starc+ band is now at $190.75 and the SPY has made new closing highs for the past two weeks. It would take a weekly close under $182.60 to weaken the chart.

The 127.2% Fibonacci retracement target at $188.01 was exceeded on Friday as the high was $188.96.

There is minor support at $186.75 with the 20-day EMA now at $184.76. The monthly pivot is at $182.38 with the 20-week EMA and longer-term uptrend, line b, in the $179-$180 area.

The weekly on-balance volume (OBV) has confirmed the new highs by moving through the resistance at line c. The daily OBV also made a new high last week as it had been lagging the price action.

The daily S&P 500 A/D line (not shown) is still confirming the price action as it broke out to the upside in the middle of February.

Dow Industrials
The weekly chart of the SPDR Dow Industrials (DIA) shows that it is still below the early-2014 high of $164.93. The weekly starc+ band is at $167.29 with the monthly projected pivot resistance at $166.96. The weekly trend line resistance, line e, is now at $168.40.

The weekly relative performance has been below its WMA for all of 2014 and is well below its WMA and the major downtrend, line g. This is consistent with the Dow Industrials being a market-lagging, not leading, sector. There has been some slight improvement in the daily RS analysis.

The weekly OBV has just recently moved above its WMA and has major support now at line h. The heavy selling early in February caused a sharp drop in the OBV. The daily OBV (not shown) is still well below its late 2013 highs.

The Dow Industrials A/D line made another new high last week and its WMA is clearly rising.

chart
Click to Enlarge

Nasdaq-100
The PowerShares QQQ Trust (QQQ) failed to make new highs on Friday and looks ready to close below the lows of the prior three days. A weekly close below $88.94 was needed to trigger a low close doji sell signal.

Last Monday’s low at $88.87 is the next key level of support with the monthly pivot for March at $88.25. The daily starc- band is at $88.71 with the monthly S1 support at $86.92. The quarterly pivot and major support is at $83.66.

The daily OBV has turned lower from its flat WMA and is clearly diverging from prices as indicated by line c. The weekly OBV has confirmed the recent highs and is well above its strongly rising WMA. This suggests that a pullback should be well supported.

The daily relative performance not shown has dropped below its WMA and appears to have now completed a short-term top.

The Nasdaq 100 A/D line did make a new high last week but turned lower on Thursday. The impressive breakout through resistance in February (line d) is positive for the intermediate term.

Russell 2000
The iShares Russell 2000 Index (IWM) was also unable to hold its gains late in the week as it reached its daily starc+ band last Tuesday with the high of $120.58. It still had a good week as it closed with nice gains.

There is first support now at $117.37, line e, which corresponds to January’s high. The rising 20-day EMA is at $116.59 with the daily starc- band a bit lower. There is monthly pivot support at $114.50, which is well below Monday’s low of $115.58.

The daily OBV staged an impressive breakout last month as it moved well above the prior highs, line f. The weekly OBV (not shown) has also made new highs, and therefore, the multiple time frame OBV analysis is positive.

The Russell 2000 A/D line is acting weaker than the NYSE, S&P 500, or Nasdaq 100 A/D lines as it has just made slight new highs. It is lagging the price action.

See the original article >>

Weekend update

by tony caldaro

REVIEW

The week started with Russia flexing its military muscle in the Ukraine, and the market sold off to SPX 1834 by Monday noon. After the event was temporarily neutralized the market recovered, and made all time new highs every day thereafter. For the week the SPX/DOW were +0.90%, the NDX/NAZ were +0.45, and the DJ World index rose 0.40%. Economic reports for the week finally turned positive, with positive reports outpacing negatives ones 10 to 7. On the uptick: personal income/spending, PCE prices, ISM manufacturing, construction spending, monthly payrolls, the MIS, monetary base, the WLEI, plus weekly jobless claims improved. On the downtick: monthly auto sales, the ADP, ISM services, factory orders, consumer credit, plus the unemployment rate and trade deficit nudged higher. Next week we have Retail sales, Business/Wholesale inventories and the PPI.

LONG TERM: bull market

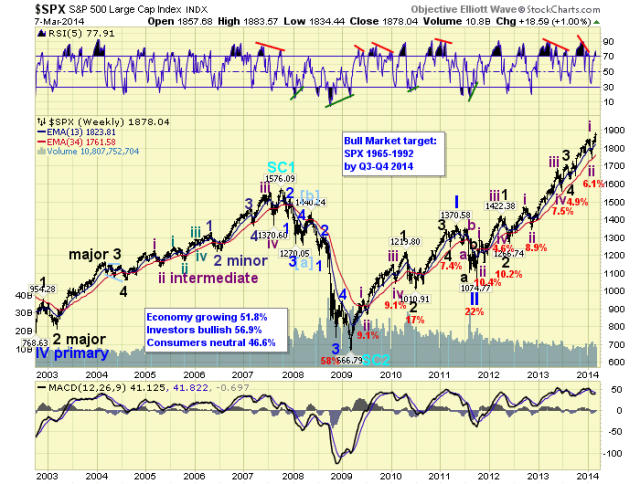
This liquidity driven Cycle wave [1] bull market continues to exceed expectations. Just as, I would imagine, the liquidity driven 1932-1937 Cycle wave [1] bull market did decades ago. Then, Primary waves I and III were rather simple one year affairs, with an extending Primary V taking three years to unfold. Quite similar to the 2002-2007 bull market. Although the waves in the 2002-2007 bull market were of a lesser Major degree.

SPXweekly

This bull market has had a two year Primary I and, currently, a three year Primary III. Primary II, for those that keep count, only lasted five months. Primary I naturally divided into five Major waves, with a subdividing Major wave 1. Primary III is also dividing into five Major waves, but Major waves 1, 3 and 5 are all subdividing. Major waves 1 and 2 completed by mid-2012. Major waves 3 and 4 completed by mid-2013. It would make sense then, to expect Major wave 5 to complete around mid-2014. Especially since the subdividing waves of Major waves 1 and 2, Primary I, also completed in mid-year.

MEDIUM TERM: uptrend

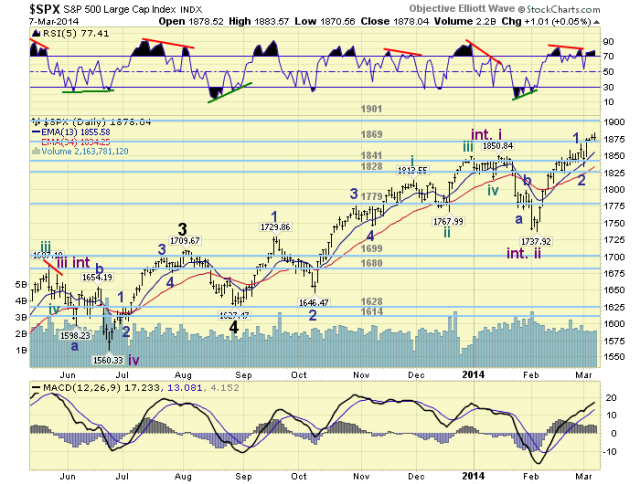
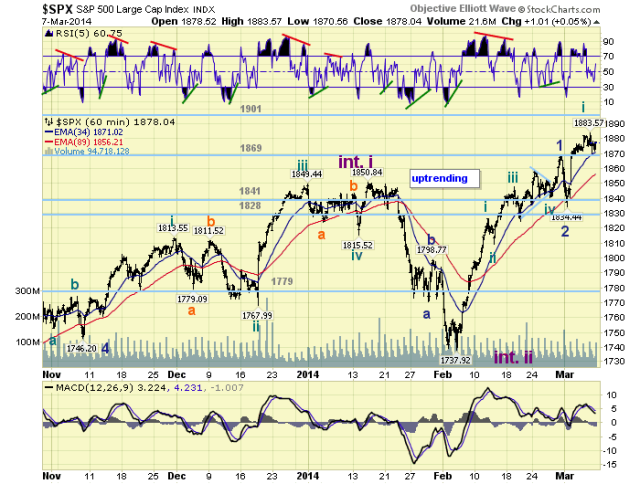
During this Major wave 5, Intermediate wave one completed in mid-January and Intermediate two in early-February. Intermediate wave three is only a month old and has already exceeded the old all time high by nearly 2%. The initial advance off the Int. two SPX 1738 low was quite strong and very implusive. The market rose to SPX 1848 (110 points) in just two weeks. After that it became quite choppy until this week. As it has risen just 36 points in over two weeks. This choppiness has left a short term pattern that has many potential counts.

SPXdaily

During this bull market third wave trends, which this is one, and there have been four, have lasted between 4 and 7 months in duration. This would suggest an Int. wave three high some time by around June, maybe longer. If this one is anything like Int. wave three of Major wave 1 (Nov11 to Mar12), when the SPX rose 263 points. Then we are looking at potentially an Int. iii high near June around SPX 2000. Actually our target for this uptrend is the OEW 1974 pivot, and the pivot after that is 2019. Medium term support is at the 1869 and 1841 pivots, with resistance at the 1901 and 1962 pivots.

SHORT TERM

Short term support is at the 1869 pivot an SPX 1859, with resistance at SPX 1884 and the 1901 pivot. Short term momentum ended the week just above neutral. The short term OEW charts are positive with the reversal level now SPX 1871.

SPXhourly

The uptrend can best be counted as five Minute waves up to complete Minor 1 at SPX 1868. The five Minutes waves are: 1827-1809-1848-1841 (triangle)-1868. Minor wave 2 then completed at SPX 1834 on Monday. From that low the market rallied to SPX 1884 early Friday, completing Minute one. Then pulled back to SPX 1871, also on Friday, possibly completing Minute wave two. As soon as the market rallies above SPX 1880 we will label that low, or the next low, as Minute wave two. Best to your trading!

FOREIGN MARKETS

Asian markets were mostly higher for a net gain of 1.2%.

European markets were mostly lower for a net loss of 0.6%.

The Commodity equity group was also mostly lower for a net loss of 3.3% - mostly Russia.

The DJ World index is uptrending and gained 0.4% on the week.

COMMODITIES

Bonds entered a downtrend and lost 0.8% on the week.

Crude was quite choppy losing just 0.1% on the week.

Gold continues to have negative divergences, but gained 0.8% on the week.

The USD remains in a downtrend and lost 0.1% on the week.

NEXT WEEK

Tuesday: Wholesale inventories. Wednesday: the Budget deficit. Thursday: weekly Jobless claims, Retail sales, Export/Import prices, and Business inventories. Friday: the PPI and Consumer sentiment. On Thursday FED governor Powell will give Senate testimony. Best to your weekend and week!

See the original article >>

Chinese Exports Collapse Leading To 2nd Largest Trade Deficit On Record

by Tyler Durden

Plenty of excuses out there for this evening's collosal miss in Chinese exports (-18.1% YoY vs an expectation of a 7.5% rise) mainly based on timing issues over the Lunar New Year (but didn't the 45 economists who forecast this data know the dates before they forecast?) This is a 6-sigma miss and plunges China's trade balance to its biggest miss on record and 2nd largest deficit on record. Combining Jan and Feb data (i.e. smoothing over the holiday), exports are still down 1.6% YoY - not good for the much-heralded global recovery. Exports to the rest of the BRICs were all down over 20% but no there is no contagion from an emerging market crisis.

Even when the trade deficit was last this large, economists were more accurate - this is the biggest miss on record...

Seasonally-adjusted the data is stunningly bad...

  • *CHINA FEB. SEASONALLY ADJUSTED EXPORTS FALL 34% MOM
  • *CHINA FEB. SEASONALLY ADJUSTED IMPORTS FALL 0.4% MOM

and non-seaonally-adjusted

  • *CHINA'S FEB. EXPORTS FALL 18.1% FROM YEAR EARLIER (vs +7.5% expectations)

The excuse...

"The Spring Festival factor caused sharp fluctuations in the monthly growth rate as well as the monthly deficit," Customs said in a statement accompanying the data.

Chinese traders followed their "business habit" of bringing forward exports ahead of the holiday, and focusing on imports immediately afterwards, it added.

But, our simple question is - didn't they already know this when applying their forecasts? If so - then why a 6-standard-deviation miss?

At least they didn't blame the weather?!!

It seems the massive imports of copper - to act as collateral for all the shadow banking loans - also did not help as imports surged...

*CHINA JAN.-FEB. COPPER, PRODUCT IMPORTS 915,000 TONS

All that apparent demand and yet the price is collapsing - not good for the credit unwind

And what does it say about the US that our trade balance with China collapsed MoM...

See the original article >>

S&P 500 66% above 114 year valuation levels, trend is up!

by Chris Kimble

CLICK ON CHART TO ENLARGE

The broad market ( Dow, S&P 500 and Small Caps) remains near all time highs and the advance/decline line is too...the trend is up.

New valuations from Doug Short are out, reflecting that the S&P 500 is 66% above its 114-year median valuation line and not real close to the valuations levels where key lows took place, actually closer to the valuation levels of the 1929, 1966 & 2000 highs.

See the original article >>

Follow Us