Saturday, August 30, 2014

Markets signaling return of economic weakness in China

by Sober Look

In addition to property market challenges and the unexpected slowdown in manufacturing expansion, we continue to see markets signaling a significant loss of momentum in China's economic growth. Earlier in the year the country's economic trajectory was quite uncertain. This was followed by a strong pickup in manufacturing activity early this summer and economists suggested that the worst is over. But it seems that China is once again facing significant headwinds.
The nation's industrial commodities are hitting new lows, particularly iron ore and the Shanghai-traded steel rebar.

Iron Ore 62% Fe, CFR China; Jan-2015 contract (barchart)

SHFE Steel Rebar January 2015; Jan-2015 contract (barchart)

Other commodities linked to construction, such as fiberboard, have been declining as well. Moreover, the recent stock market rally has stalled. Perhaps the most telling sign of weakening fundamentals in China has been the nation's rates market. Rates implied by SHIBOR-based interest rate swaps have declined materially over the past month. More importantly the yield curve has become inverted.

Swap rates by maturity (yrs)

As discussed before, economic weakness in China is reverberating globally - from Australia to the Eurozone - and is in part responsible for the bond yield compression across developed economies. We are likely to see the central government step in with more stimulus in order to stabilize the situation. However, as Beijing is beginning to realize, limited new stimulus directed at boosting growth is becoming less effective. A much larger effort may be required.

See the original article >>

SPY Trends and Influencers August 30, 2014

by Greg Harmon

Last week’s review of the macro market indicators suggested, heading into the last week of Summer that the equity markets were looking strong and ready for more. Elsewhere looked for Gold ($GLD) to continue lower in its intermediate term consolidation phase while Crude Oil ($USO) continued lower. The US Dollar Index ($UUP) and US Treasuries ($TLT) looked to continue to the upside. The Shanghai Composite ($SSEC) also looked strong and was biased higher while Emerging Markets ($EEM) tried to burn through past history near resistance and might consolidate for another week in their uptrend. Volatility ($VIX) looked to remain subdued keeping the bias higher for the equity index ETF’s $SPY, $IWM and $QQQ. The QQQ’s continued to look very strong and biased higher while the SPY was not quite as strong on the shorter timeframe and might need to consolidate. Both were at big round numbers that could stall any further move. The IWM looked to continue to improve in its consolidation range. Use this information as you prepare for the coming week and trad’em well.

The week played out with Gold holding under 1300 but finding a bottom while Crude Oil held lower but rebounded late in the week. The US Dollar continued the move higher but found resistance and pulled back while Treasuries just kept going up. The Shanghai Composite pulled back from resistance but bounced Friday while Emerging Markets made a new higher high before a small pullback. Volatility moved slightly higher but rejected at its SMA’s. The Equity Index ETF’s all started the week higher, but then consolidated that move the rest of the week, with the SPY and the QQQ both at significant round numbers. What does this mean for the coming week? Lets look at some charts.

As always you can see details of individual charts and more on my StockTwits feed and on chartly.)

SPY Daily, $SPY
spy d
SPY Weekly, $SPY
spy w

The SPY started the week with a Hanging Man doji candle higher, a possible reversal candle. It followed that with a Gravestone doji bringing out the calls for a move lower. And it did for the next two days but only marginally. In fact the Hollow Red candle Thursday, showing bullish intraday activity, marked the bottom as Friday confirmed it higher and closed at a new all-time high. The RSI remains very bullish and not overbought with the MACD rising and bullish in the daily chart. Note that the price is a bit extended from the 20 and 50 day SMA’s though. On the weekly chart the third small candle higher with some gap raises the thought of a possible Advance Block, signaling exhaustion. Watch the action though don’t get in front of it. The RSI is strong and rising on the weekly chart and the MACD is about to cross up. They support more upside. There is a 150% extension of the down move at 202.72 and a Measured Move at 208 with a 161.8% extension above that at 213.39. Support lower may come at 200 and 199 followed by 198.30 and 196.50. Uptrend Continues with Possible Consolidation.

As the market heads into September equities are strong but have had strong moves already. Elsewhere look for Gold to continue to hold around 1300 with a downward bias while Crude Oil has a short term bias higher in its consolidation. The US Dollar Index and US Treasuries are biased higher. The Shanghai Composite looks to continue to pullback in its recent rally while Emerging Markets are biased to the upside with the risk of consolidation at resistance continuing. Volatility looks to remain subdued keeping the bias higher for the equity index ETF’s SPY, IWM and QQQ. The IWM looks strongest and this may be a sign of rotation into it from the SPY and QQQ. The QQQ looks a bit better than the SPY having rested all week, where the SPY has some signs of short term exhaustion. But the trend of SPY and QQQ both remain higher. Use this information as you prepare for the coming week and trad’em well.

See the original article >>

Stock Market Inflection Point Approaching

By: Tony_Caldaro

The market started the week with a gap up opening on monday, hit SPX 2005 on tuesday before noon, then traded in a 14 point range for the rest of the week. For the week the SPX/DOW were +0.7%, the NDX/NAZ were +0.8%, and the DJ World index gained 0.6%. On the economic front positive reports outpaced negatives ones, led by a Q2 GDP +4.2%. On the uptick: new/pending homes sales, durable goods orders, the FHFA, consumer confidence/sentiment, Q2 GDP, personal income, the PCE, and the Chicago PMI. On the downtick: the WLEI, Case-Shiller, and personal spending. Next week will be highlighted by the FED’s beige book, ISM, and the Payrolls report.

LONG TERM: bull market

As we start our 10th year of publishing this blog it appears the market is entering another inflection point. The bulls have won them all since 2010, with the exception of 2011. Is another exception in the offering, or is Primary III set to extend once again? The next several days to weeks will give us the answer.

Last weekend we offered a potential alternate count should Primary III extend. Yet, we continue to follow our main count which has worked well for us this year. As you can see from the weekly chart: the SPX should be in Intermediate wave v, of Major 5, of Primary III. When this uptrend concludes, Primary III ends, and the largest correction since 2011 should follow for Primary IV. Supporting this scenario are the negative divergences in the weeklly MACD/RSI, plus we are in Q3 and within our long standing target range: 1970-2070. These negative divergences also appear in the DOW/NDX/NAZ. On the monthly charts we have the most overbought MACD in the history of the stock market, plus a double negative divergence in the RSI.

There are additional headwinds which can be considered more fundamental than technical. The FED’s QE 3 ends in October. The end of QE 1 and QE 2 coincided with market declines of 17% and 22% respectively. Europe has renewed deflationary pressures, as their inflation rate is currently 0.3%. The ECB and FED both target 2% inflation. The recent uptrend to new highs has occurred with some of the lowest volume this year. Traders are likely to start returning next week, as Labor Day marks the end of summer in most areas. Geopolitical events continue to flare up: ISIS in Iraq and Syria, Russia in the Ukraine. Both have the potential to create volatile markets, which usually occurs during steep corrections.

MEDIUM TERM: uptrend

The current Intermediate wave v uptrend started in early August at SPX 1905. Thus far the market has risen to all time new highs, as it hit 2005 this week. At the low there was a positive RSI divergence and an oversold MACD. Recently this uptrend looks more like Int. wave i, than Int. wave iii. That uptrend took only about four weeks: early February to early March. This uptrend will be about four weeks old next week.

While the SPX/NDX/NAZ have all hit all time new highs, the DOW/NYA have been struggling to keep pace. The DOW did make a new high by just 2 points, while the NYA (new york composite index) has yet to do so. This suggests the advance is being driven by market leaders and growth stocks. The typical fifth wave narrowing of market participation. The DOW has also remained within its expanding triangle, limited by that upper trend line. Until we see a substantial rally breaking that upper trend line an extension of Primary wave III seems doubtful. Medium term support is at the 1973 and 1956 pivots, with resistance at the 2019 and 2070 pivots.

SHORT TERM

Short term support is at SPX 1985 and the 1973 pivot, with resistance at SPX 2005 and the 2019 pivot. Short term momentum ended the week overbought. The short term OEW charts turned positive with the reversal level now SPX 1998.

We have been counting this uptrend with five Minor waves. Minor waves 1 and 2 ended at SPX 1945 and 1928. Minor wave 3 divided into five Minute waves: 1964-1942-1995-1985-2005. Minor wave 4 appears to have ended on thursday at SPX 1991 with a positive short term divergence. During this bull market fifth waves have been somewhat limited: from less than the length of wave 1 to 1.618 times wave 1.

With wave 1 travelling 40 points (1905-1945) the upside limit for wave 5 would be about the OEW 2070 pivot. The minimum upside would be marginal new highs above SPX 2005. Assuming the short term count is correct, no Primary III extension, the uptrend target range is between these two numbers. Our next pivot is 2019, with a range of 7 points. Within this pivot are two fibonacci relationships: @ SPX 2014 Int. v = 0.618 Int. iii, and @ SPX 2016 Minor 5 = 0.618 Minor 1. With all the indices setting up for potential negative daily RSI divergences at higher highs, let’s see how these numbers work out next week.

See the original article >>

Are Stocks Set For A Major Decline In The Fall?

by Eric Parnell

Summary

  • The market news coverage is becoming increasingly polarized.
  • On one side of the debate are those that believe the sky is the limit for stocks in the months ahead.
  • On the other side of the discussion are those that expect a significant stock market pullback is not only imminent but also long overdue.
  • Market history provides important clues as to whether the stock market is indeed setting up for a major decline in the fall of 2014.

The market news coverage is becoming increasingly polarized. On one side of the debate are those that believe the sky is the limit for stocks in the months ahead. With stocks reaching a fresh all-time high on Friday, this view has yet to be invalidated. On the other side of the discussion are those that expect a significant stock market pullback is not only imminent but also long overdue. Given the fact that we are soon entering what has historically been a tumultuous time of year for stocks, such expectations may soon be validated. Who is right? Only time will tell, but in working to identify the answer it is worthwhile to explore market history to see if we can identify clues as to whether the stock market is setting up for a major decline as we head into the fall of 2014.

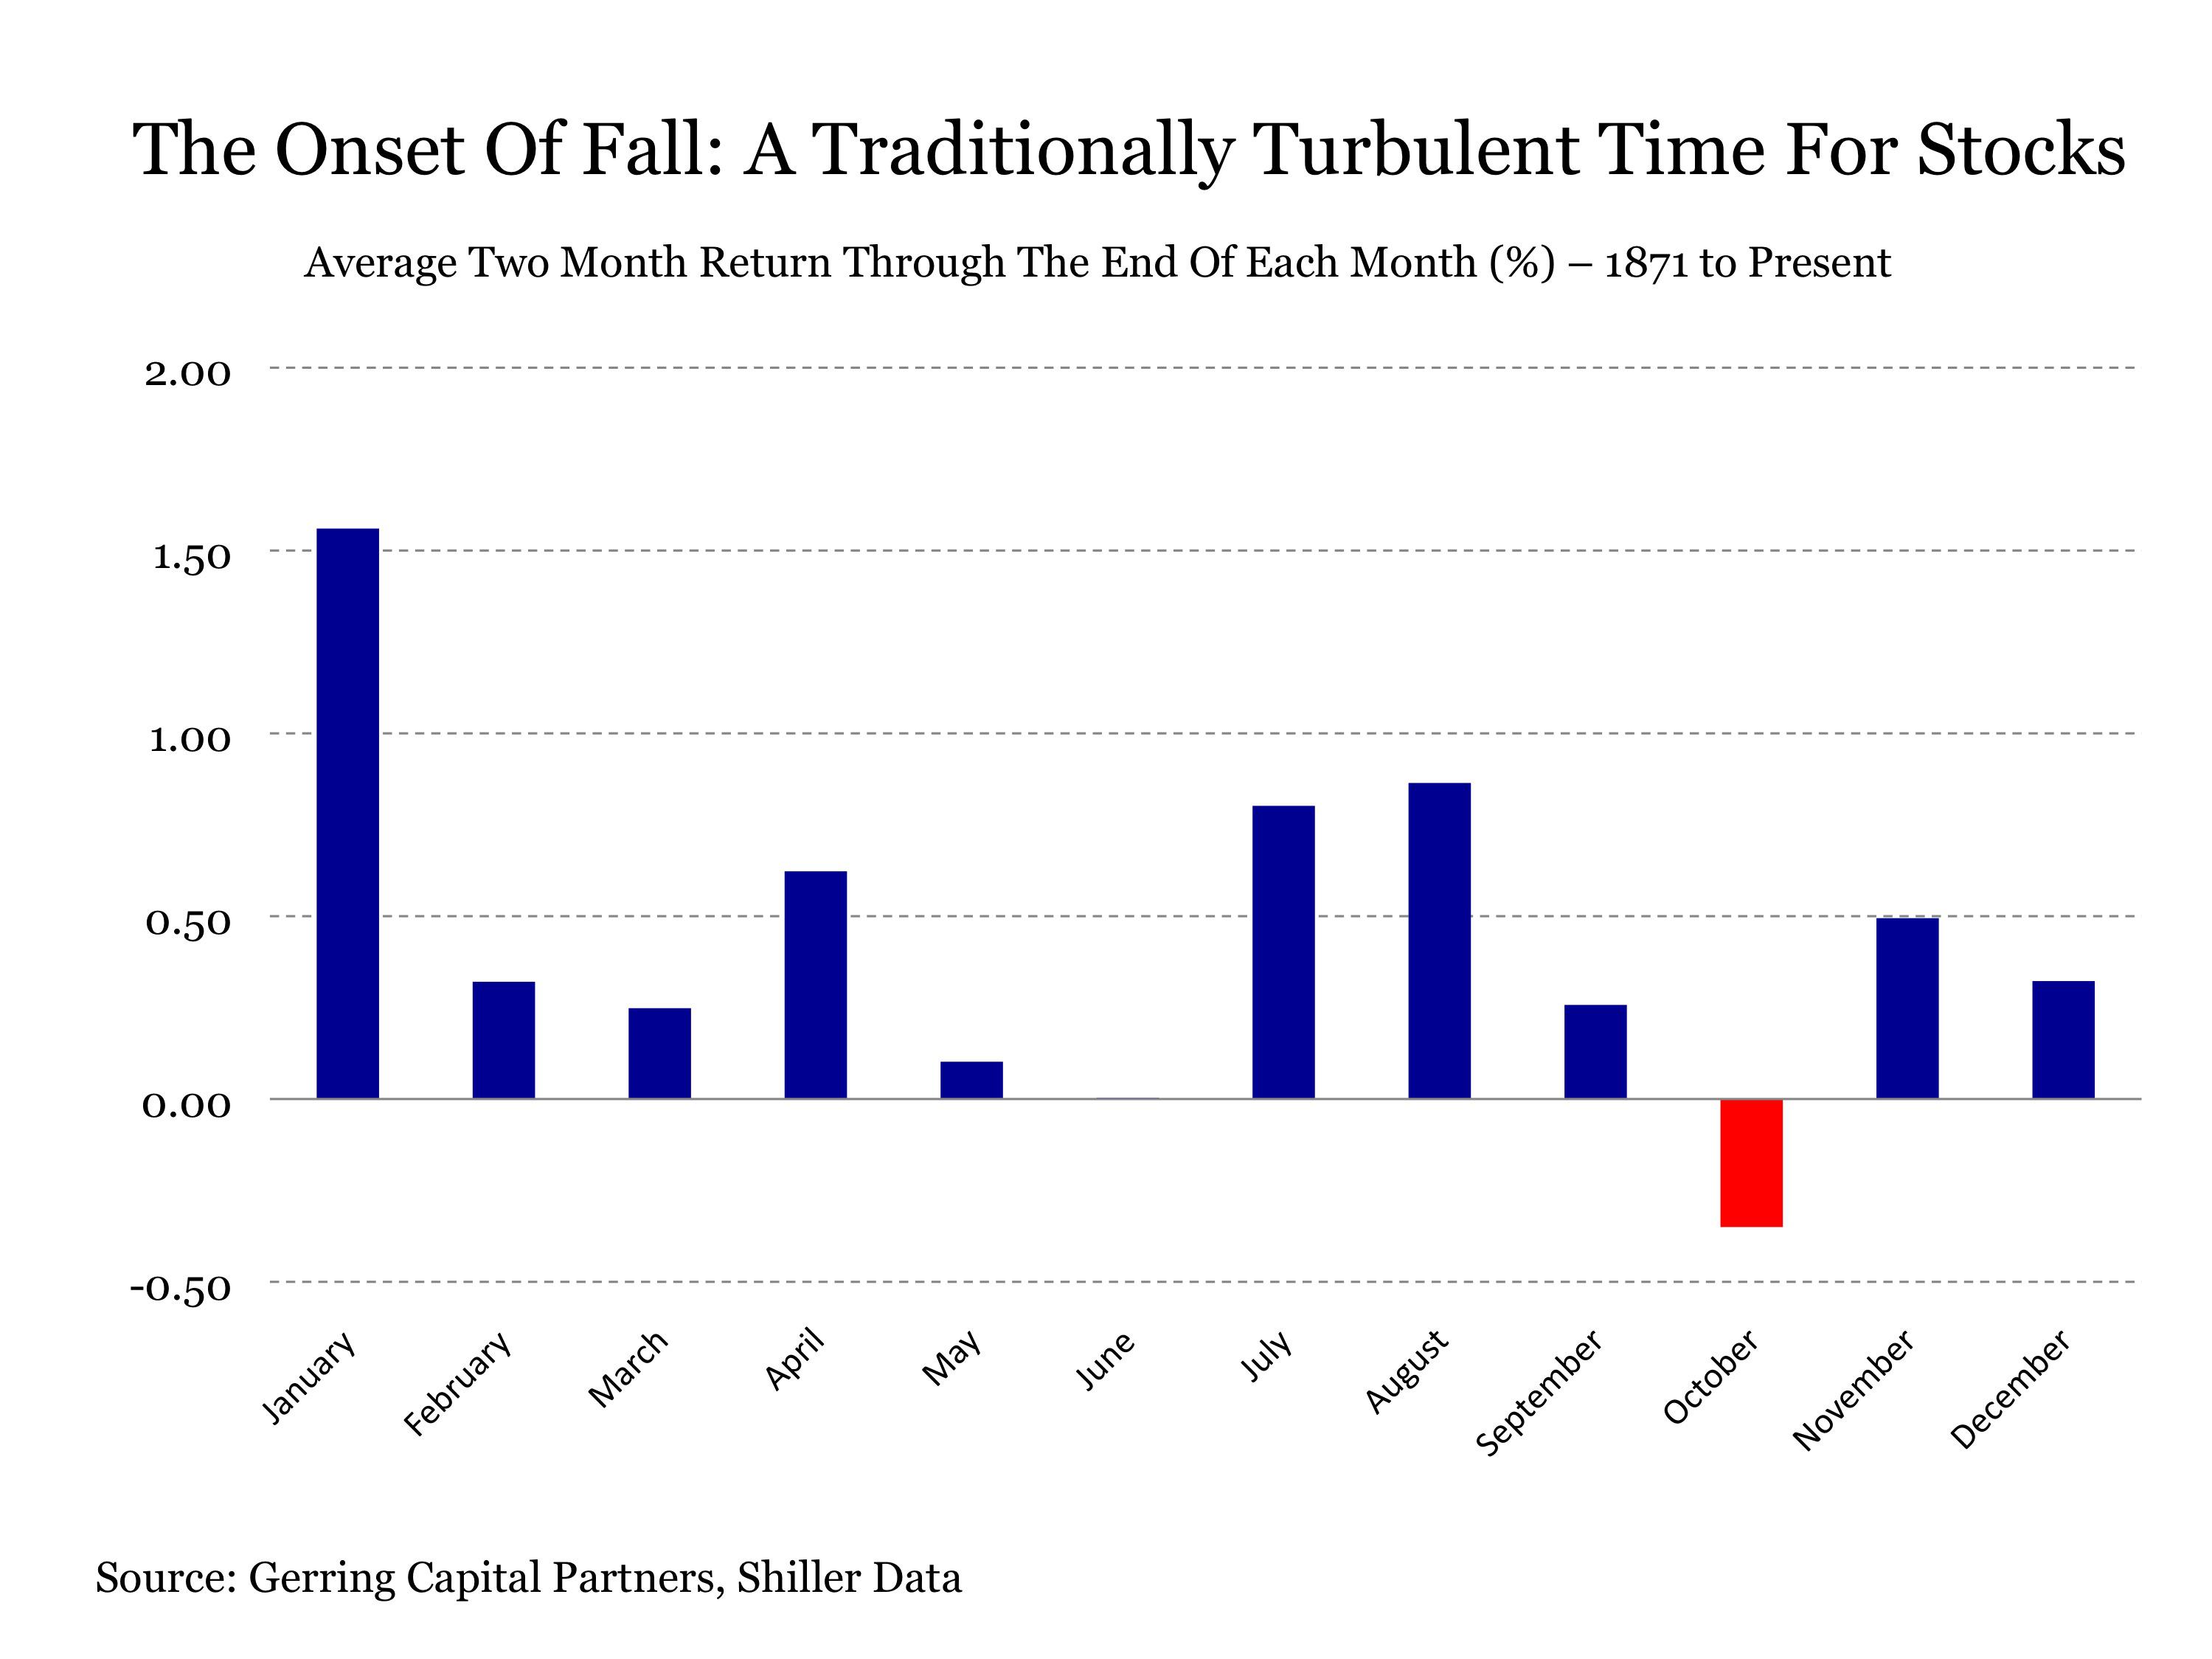
The onset of fall has traditionally come with increased challenges for stock investors. In more than 140 years of stock market history, the only two-month period where stocks have averaged a negative total return has been during September and October. During these two months, stocks have lost an average -0.35%. Perhaps more importantly, twenty of the forty, or 50%, of worst two-month periods in market history have included either September or October if not both.

(click to enlarge)

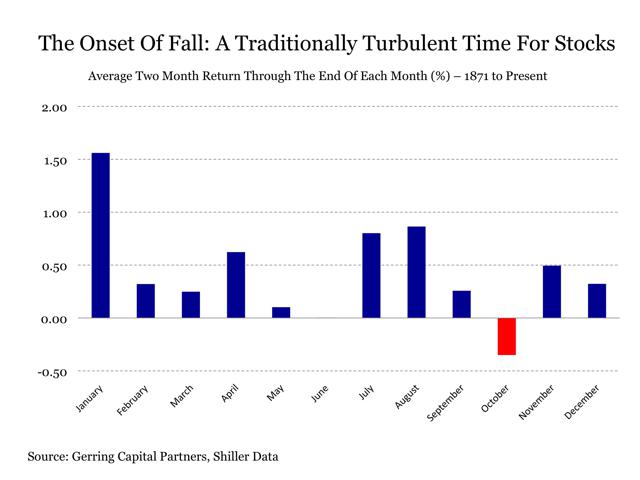
Thus, it is reasonable to consider the possibility that the onset of fall might once again bring with it a period of sustained market turbulence that has been absent for some time. In order to determine whether we are poised for a meaningful correction in the fall, potentially in the magnitude of -10% or more, it is worthwhile to look back on those past incidents to see if they share any similarities with the market set up today.

Exploring back through market history, 22 years stand out in particular for providing investors with a sustained correction in excess of -10% over a two-month period in the fall. These years include the following:

1873, 1876, 1907, 1929, 1930, 1931, 1932, 1933, 1937, 1946, 1957, 1973, 1974, 1987, 1990, 1998, 2000, 2001, 2002, 2007, 2008, 2011

One way to potentially determine whether the stock market in 2014 is setting up for a major autumn correction like the past years listed above is to examine how the stock market held up during the summer months prior to the turbulence that followed in the fall.

An important point becomes immediately apparent when conducting this analysis. In nearly all past instances of a major stock market correction in the fall, stocks were exhibiting signs of breaking down during the summer that preceded these corrections. For in the past when the stock market pulled back dramatically in the fall, in 16 of these 22 instances stocks were also down outright over the summer months from June to August. And in another 3 of these 22 past instances, stocks experienced at least one monthly decline over the June to August period.

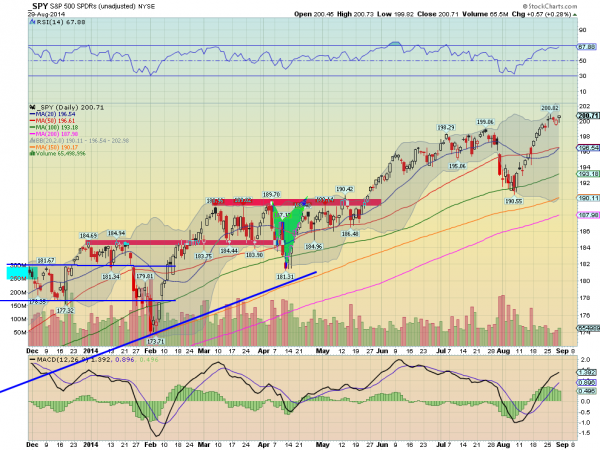
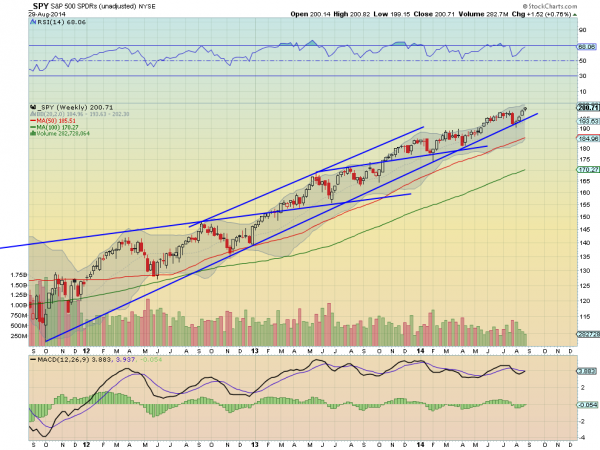
The good news is that neither of these conditions has taken place in 2014. Not only have stocks as measured by the S&P 500 Index (NYSEARCA:SPY) advanced solidly this summer, but they have also moved higher in each of the last three months of June, July and August. In other words, it does not appear that stocks are setting up for a major correction as we head into the autumn of 2014 at least based on this criteria.

But the assessment here is not finished just yet. What about the remaining 3 instances where stocks experienced a major autumn decline after posting strong summer returns including consecutive gains each in June, July and August? These three exceptions took place in 1929, 1987 and 2000. These, of course, are among the most notorious years in stock market history, and in each past instance investors drifted steadily through the summer with the impression that all was well with the world. That is, of course, until the market reversed suddenly and relentlessly.

Bottom Line

The sanguine summer for stock investors in 2014 is not the typical historical set up for a major market correction in the fall. But investors should take caution at becoming overconfident at this juncture, as market history has also shown that in the rare instances when a major autumn correction arrives following a bright and sunny summer for stocks, the subsequent downside can quickly become painful and severe.

See the original article >>

Follow Us