Thursday, May 30, 2013

Dario per Franca

di Dario Fo

dario_fo_franca_rame.jpg

di Dario Fo

"Franca ed io abbiamo scritto quasi sempre i testi del nostro teatro insieme. Io mi prendevo l’onere di mettere giù la trama quindi gliela illustravo e lei proponeva le varianti, spesso li recitavamo a soggetto, all’improvvisa, come si dice... Questo era il metodo preferito ma non sempre funzionava. Si discuteva anche ferocemente, si buttava tutto all’aria e si ricominciava da capo. In verità mi trovavo a dover riscrivere di nuovo il testo da solo. Poi lo si discuteva con più calma e si giungeva ad una versione che funzionasse e che andasse bene a tutt’e due.
Anche Franca è stata l’autrice unica di alcuni testi. Ci sono opere, come per esempio “Parliamo di donne”, che furono stese da lei completamente a mia insaputa. Quando mi ha dato da leggere questa commedia già ultimata sono rimasto un po’ perplesso... e seccato! Ma come ti permetti?!? No, scherzavo...
Io ho proposto qualche variante ma di fatto si trattava di un’opera del tutto personale.
Pochi lo sanno ma la gran parte degli spettacoli che trattavano di questioni prettamente femminili è stata Franca ad averli scritti, elaborati e poi li ha recitati al completo spesso anche da sola. E io mi sono trovato a collaborare solo per la messa in scena.
Vi dirò di più: testi quali Mistero Buffo e Morte Accidentale di un Anarchico - che io avevo realizzato come autore unico - hanno avuto grande successo anche all’estero con centinaia di allestimenti dall’America all’Oriente, per non parlare dell’Europa.
Ma dei nostri lavori quello che ha battuto tutti i record di messa in scena è Coppia Aperta, Quasi Spalancata che è stato replicato con diverse regie per più di 700 edizioni nel mondo. Ebbene l’autrice unica di questo testo è Franca. L’ho sempre tenuto nascosto!
C’è in particolare un lavoro o meglio, un monologo, che Franca ha recitato solo qualche volta quest’anno, e di cui bisogna che io vi parli perché è fortemente pertinente alla situazione a dir poco drammatica che io sto in questi giorni vivendo.
Da tempo Franca aveva scoperto l’esistenza di alcuni testi apocrifi dell’Antico Testamento nei quali la Genesi è raccontata in termini e linguaggio molto diversi da quelli cosiddetti canonici.
Attenti, non sto parlando dei Vangeli apocrifi, ma dell’Antico Testamento... Apocrifo!
Ebbene da uno di questi testi Franca ha tratto un racconto che vi voglio far conoscere, quasi in anteprima. Eccovelo!
Siamo nel Paradiso terrestre. Dio ha creato alberi, fiumi, foreste animali e anche l’uomo. O meglio il primo essere umano ad essere forgiato non è Adamo ma Eva, la femmina! Che viene al mondo non tratta dalla costola d’Adamo ma modellata dal Creatore in un’argilla fine e delicata. Un pezzo unico, poi le dà la vita e la parola. Il tutto “prima” di creare Adamo; tant’è che girando qua e là nel paradiso Eva si lamenta che... della sua razza si ritrovi ad essere l’unica, mentre tutti gli altri animali si trovano già accoppiati e addirittura in branco. Ma poi eccola incontrare finalmente il suo “maschio”, Adamo, che la guarda preoccupato e sospettoso. Eva vuol provocarlo e inizia intorno a lui una strana danza fatta di salti, capriole e grida da selvatica... quasi un gioco che Adamo non apprezza, anzi prova timore per come agisce quella creatura... al punto che fugge nella foresta a nascondersi e sparisce; ma viene il momento in cui il Creatore vuole parlare ad entrambe le sue creature, umane. Manda un Arcangelo a cercarli. Quello li trova e poi li accompagna dinnanzi a Dio in persona.
L’Eterno li osserva e poi si compiace: “Mica male! mi siete riusciti... E dire che non ero neanche in giornata... ! Voi non lo sapete perché ancora non ve l’ho detto ma entrambi siete i proprietari assoluti di questo Eden! E sta a voi decidere cosa farne e come viverci. Ecco la chiave. E gliela getta. Vedete, qui ci sono due alberi magnifici (e li indica), uno – quello di sinistra – dà frutti copiosi e dal sapore cangiante. Questi frutti, se li mangiate, faranno di voi due esseri eterni. Sì, mi rendo conto che ho pronunciato una parola che per voi non ha significato: eternità... Significa che avrete la stessa proprietà che hanno gli angeli e gli arcangeli, vivrete per sempre, appunto in eterno! A differenza degli altri animali non avrete prole, perché, essendo eterni, che interesse avreste di riprodurvi e generare uomini e donne come voi, della vostra razza? L’altro albero invece produce semplici mele, nutrienti e di buon sapore. Ma attenti a voi, non vi consiglio di cibarvene! E sapete perché? Perché non creano l’eternità... ma in compenso, devo essere sincero, grazie a loro scoprirete la conoscenza, la sapienza e anche il dubbio.
Ancora vi indurranno a creare a vostra volta strumenti di lavoro e perfino macchine come la ruota e il mulino a vento e ad acqua. No, non ho tempo di spiegarvi come si faccia, arrangiatevi da voi. ... tutto quello che scoprirete; e ancora queste mele, mangiandole, vi produrranno il desiderio di abbracciarvi l’un l’altro e di amarvi... non solo, ma grazie a quell’amplesso, vi riuscirà di far nascere nuove creature come voi e popolare questo mondo. Però attenti, alla fine ognuno di voi morirà e tornerà ad essere polvere e fango. Gli stessi da cui siete nati.
Pensateci con calma, mi darete la risposta fra qualche giorno. Addio.

No. Non c’è bisogno di attendere, Padre Nostro! – grida subito Eva – Per quanto mi riguarda io ho già deciso, personalmente scelgo il secondo albero, quello delle mele. S devo essere sincera, Dio non offenderti, a me dell’eternità non interessa più di tanto, invece l’idea di conoscere, sapere, aver dubbi, mi gusta assai! Non parliamo poi del fatto di potermi abbracciare a questo maschio che mi hai regalato. Mi piace!!! Da subito ho sentito il suo richiamo e mi è venuto un gran desiderio di cingermi, oh che bella parola ho scoperto cingermi!, cingermi con lui e farci... come si dice?! Ah, farci l’amore! So già che questo amplesso sarà la fine del mondo! E ti dirò che, appresso, il fatto che mi toccherà morire davanti a tutto quello che ci offri in cambio: la possibilità di scoprire e conoscere vivendo... mi va bene anche quello. Pur di avere conoscenza, coscienza, dubbi e provare amore... ben venga anche la morte!
Il Padreterno è deluso e irato quindi si rivolge ad Adamo e gli chiede con durezza: “E tu? ...che decisione avresti preso? Parlo con te, Adamo sveglia! Preferisci l’eterno o l’amore col principio e la fine?” E Adamo quasi sottovoce risponde: “ Ho qualche dubbio ma sono molto curioso di scoprire questo mistero dell’amore anche se poi c’è la fine"." Dario Fo

See the original article >>

Butterflies at the Altar - Arson at the Fed

by Market Anthropology

We continue to find ourselves walking in a strange parallel universe exploring the flip side of the long dollar / short euro thesis and wondering if a material pivot lower in the dollar is upon us. Could it just be nerves before a major breakout in the dollar materializes? Perhaps. We have watched these forces come together for some time - butterflies at the altar would be nothing new with these prospective nuptials. And while it has been quite good for us to have a strong read on the dollar and the euro's next move and see the kinetic potential throughout the commodity and currency markets - we recognize cracks forming in the relative strength of the dollar and conversely pressure building within the euro. We also have watched (actually foresaw) as corners of the commodity market - such as the gold miners relative to gold itself - have made an important turn higher this week.  

Click to enlarge image

Further buttressing the case against the dollar - and as we have noted over the past few weeks - silver appeared coiled with underlying upside momentum. In perhaps a first since its large pivot lower in May 2011, the euro's relative strength to silver may be result of a correlation divergence. The conviction of the jury is still out, but if we played devil's advocate to the asset relationship - that's how we would see it. 
The US dollar index comparative that we have utilized quite closely has provided an excellent road map of the dollar's potential and pivots - and a contrasting backdrop to the last time the index broke aggressively higher in 1997. What we have recently seen and pointed out is a notable divergence in the relative strength of the index as it consolidated and broke higher over the past several weeks. In terms of expectations of performance of trend - it's come up short.

Click to enlarge image

You will often find with useful comparative wave or cycle analysis the assets acutely correlate coming through a major pivot structure and volatility event - then closely trend coming out, before eventually diverging as either the analog or current market walks outside of what would be characterized as normal distribution. I have compared it in the past to lobbing a rock into a pond, whereas, the geometry of the disturbed surface will replicate with great congruency at the point of entry and dissipate as you move further away from the epicenter of disturbance. Granted, when the comparison is of the same asset you may also encounter and provide similar kinetic intermarket turbulences at the respective pivots. What we may be witnessing with the dollar - and as I pointed to last week is the trend stalling out and another trip lower through the range.

"With only a few sessions remaining in May - the US dollar index is marginally holding above it monthly breakout ~ 83.50. As we see it, the risk here for dollar bulls and precious metals bears (both of which we have helped chair the Departments since April of 2011) - is the dollar becomes exhausted and similar to 1994 takes another trip lower through the range. All things considered - we still like the dollar, but remain vigilant and open to an audible lower for a spell." Between Mosquitos & Cicadas

Click to enlarge image

Click to enlarge image

Just as the dollar showed significant positive "pressures" in early February (as expressed in the relative strength of the move), the euro is now potentially sitting on similar forces.

Click to enlarge image


Click to enlarge image

What's also interesting here and potentially worthy of extrapolating a bit of past drama - is similar to the failed breakout drive by the dollar in 1994 - the Treasury market soon followed lower with prejudice when the Fed began raising interest rates. Today, the catalyst for the Treasury market blaze appears to be arson as well; motivated by a Fed perhaps uneasy at the pace and character of risk appetites and boxed in by greater transparency and somewhat conflicting data. I suppose the strange silver lining is a little inflation caused by a slouching dollar here wouldn't exactly be the worst thing in the Fed's eyes as inflation data continues to surprise to the downside.

Strange bedfellows indeed - although par for this marriage.

See the original article >>

Death of the Dollar

By tothetick

We’ve all done it, haven’t we? Chucked something in the wash and turned it on too high, only to see it pop out at the end of the cycle and it ends up the size of your hamster. Well, Obama has been doing the same. Except this time it’s not your winter woollies that he’s shrinking, it’s the greenback.

The US currency is shrinking as a percentage of world currency today according to the International Monetary Fund. It’s still in pole position for the moment, but business transactions are showing that companies around the world are today ready and willing to make the move to do business in other currencies.

The US Dollar has long been the world’s number one denomination in world currency supply. It represents 62% of total holdings in foreign exchange in central banks around the world. But, it is in for a tough race from up-and-coming strong currencies. The Japanese Yen and the Chinese Yuan are both giving the Americans a good run for their money. The Swiss franc is too (surprisingly).  There is $6 trillion in foreign exchange holdings around the world at any given time, on average and the US Dollar represents almost two-thirds of that.

The fact that Brazil and China have also just signed a currency-swap deal worth something to the tune of $30 billion stands as living proof that the dollar may be further on the wane. China will exceed all expectations in the future as the world’s largest economy. The US will be overtaken. The Chinese currency will one day overtake the Dollar too. Has to be!

Although, it’s not quite there for the moment. China is not near being the world’s reserve currency yet. In order to be the world’s reserve currency there would be the need to produce enormous quantities of what the world wants. China has got that one off pat already. Then, countries holding the reserve currency would need to be able to spend that currency elsewhere in other countries or find a place to put it while waiting to do so. World capital markets are currently in dollars (40%), which means that there would be no possibility of using the Chinese currency. But, that’s only a matter of time. Some are predicting this will happen pretty soon.

The Federal Reserve has come in for some strong criticism over the unconventional Quantitative Easing methods that have resulted in 3 trillion spanking new dollars rolling of the printing presses. This has certainly brought about some degree of worry around the world that the dollar is not quite as safe as it might have been thought to be in the past. Is the world worrying that the dollar is not as safe a bet as it used to be in world domination. Are central banks worried that it will shrink in the wash and the colors will run?

Some are predicting that the dollar will shrink rapidly over the next two years and it will lose its top place as the world’s reserve currency by 2015. In the 1950s the dollar was 90% of total foreign currency holdings around the world. The dollar has definitely lost out to other currencies that are stronger. If there is a continued move and the dollar shrinks, then the resulting catastrophe that will ensue will have a spiral effect on the already enormous US budget deficit (over $1 trillion a year on average).

The only reason the Federal Reserve has been in a position to print more money recently is simply because they are in the strong position to be able to do so as the world’s leading reserve currency. If that changes, then the Americans won’t have the possibility of just hitting the button and setting the printing presses rolling. That means the US will be in no other position than to end up having to pay their debt back.

The US economy and the market are starting to show signs of recovery. Signs. It’s not sustained, hope as they might. If the dollar loses its attraction, then it won’t be used as the international reserve currency. Businesses will start using another currency and the dollar will lose out further still.

Some experts are saying that the problems of the dollar are like a time-bomb ready to explode. Ultimately, it will bring about the death of the dollar. As we stand on and watch, huddled around the coffin as it is lowered into the ground, we know it’s all too late. The flowers have been sent and the Stars and Stripes has been played in recognition of loyal service for the nation.

The QE methods are nothing more than aiding and abetting the already problematic situation of the greenback. We might look back in years to come and reminisce over whether it was the right (long-term) solution to use QE, whether printing bucks sent the greenback to an early grave, or whether it just reached the end of its life and croaked peacefully without making too much noise.

But, criticism of and worry over the dollar and its longevity have been hot topics for years now. The US dollar is a fiat currency that can easily lose status, deriving its value from government regulation and law. But, then again, so is the Euro. So, people living in Europe shouldn’t start throwing stones…they live in glass houses too…and that’s before they start.

See the original article >>

Oil fields under olive groves offer Italy economic boost: energy

By Alessandra Migliaccio

Underneath the groves that make southern Italy the world’s second-largest olive oil producer, geologists have found a more lucrative liquid: Europe’s biggest onshore crude oil fields.

Basilicata, a mountainous, sparsely populated province that sits in the arch of Italy’s boot, holds more than 1 billion barrels, offering the country a weapon to fight a two-year recession. Rome-based Eni SpA and France’s Total SA plan to double production raising Italy’s output to almost 200,000 barrels a day, making the country Europe’s third-largest oil producer behind the U.K. and Norway.

Since the fields started production in the 1990s, their development has been held back by environmental campaigns and bureaucratic delays. Those impediments are falling away, analyst Carlo Stagnaro said, because the priority for Italy’s government is kick starting an economy that’s shrunk for six straight quarters and where more than 35% of young people are unemployed.

“This is a giant field, so there’s huge potential here,” Claudio Descalzi, Eni’s head of exploration and production and president of Italy’s Oil and Mining Industry Association said in an interview. Italy spends as much as 60 billion euros ($78 billion) on oil and boosting production can save about 5 billion euros and create around 20,000 jobs, he said.

The Italian government’s 2012 national energy strategy sets increased oil and gas production as one of its goals. Former Prime Minister Mario Monti gave Total the green light for its new Tempa Rossa field in Basilicata last year, and Eni and local authorities are in talks to increase production in the region’s Val d’Agri.

Longest Recession

Italy, which is combating its longest recession in more than two decades, hasn’t been an oil rich country. It produces about 101,000 barrels a day, about 7% of total consumption, mostly from Basilicata with the addition of some onshore and offshore wells in Sicily and parts of central and northern Italy, according to 2012 statistics from the U.S. Energy Information Administration.

“Talk of freedom from energy dependence is an overstatement, but increasing production can certainly be an opportunity for Italy,” said Stagnaro, head of research at Instituto Bruno Leoni, which studies the Italian economy. “The real point for Eni is whether, after respecting all the laws and health and environmental requirements, the gain is worth the costs, if so then they need to forge ahead.”

Drilling Moratoriums

Environmentalists and citizens’ associations have periodically pushed local authorities to declare moratoriums on further drilling and lobbying contributed to the creation of a national park in the Val d’Agri in 2007 which further hampered drilling. There are 13 wells within the park’s territory, all sunk before 2007, according to Eni.

“We don’t want charity, we want investments in new energy sources and sustainable development,” said Marco De Biasi, head of the local branch of environmental protection agency Legambiente, referring to the 10% in royalties that Eni pays to the national and local governments. He said his group will oppose any increase in output past what has already been agreed.

Eni and partner Royal Dutch Shell Plc produce 85,000 barrels of oil per day in Basilicata and have permission to raise that to 104,000 barrels a day in the Val d’Agri, Eni’s head of southern Italy Ruggero Gheller said in an interview. Shell also owns the nearby Tempa Rossa field along with France’s Total SA and Japan’s Mitsui & Co. which the companies say will pump 50,000 barrels a day by 2016.

Eni shares dropped 1.4% to close at 17.84 euros in Rome today.

Total Production

Once all that oil starts flowing, Italy’s total production will be boosted to about 170,000 barrels a day, a 68% increase compared with 2012.

Eni is in talks with local authorities to increase output by another 25,000 barrels a day, and Descalzi says production could be boosted by a further 20,000 in the future. That would more than double current output making Italy Europe’s third- biggest producer, surpassing Denmark which pumped 202,000 barrels a day in 2012, according to the EIA. While Denmark’s production had been declining since 2004, Italy’s has been on the rise since 2009, according to the EIA.

In some respects, Basilicata has been oil country since the Middle Ages.

Small amounts of shiny oil emerge from a natural spring near Viggiano along with bubbles of natural gas emitting a stench more akin to a gas station than the miles of green woods that surround it. Legends also point to oil.

Medieval Statue

The town that houses Eni’s oil processing plant, whose bright red flame can be seen for miles at night, is also home to the Madonna of Viggiano. It’s a medieval statue that according to legend was found by a group of shepherds after seeing mysterious fires in the night.

“Let’s say that in God’s mind, it was all already written,” says Viggiano’s priest Don Paolo who considers the oil underneath the valley “an opportunity for development” of the historically poor area.

While exploration started in the 1940s, the valley’s full potential only became clear in the early 1990s when Eni started to drill and develop the wells. Opposition from locals and complex bureaucracy slowed down extraction until a deal was reached with the region in 1998 setting the 104,000 barrel a day limit that Eni plans to reach in the next few years, and setting up a system of royalties for local populations.

Royalty Payments

Eni pays 10% royalties, most of which go to local administrations. The company said in its latest report on Basilicata that it has given 585 million euros to the region and towns involved in production between 1998 and 2012. Viggiano alone, which has 3,300 inhabitants, received about 15 million euros in 2012, according to mayor Giuseppe Alberti.

The town is willing to consider an increase in production as long as jobs are created and improvements in technology guarantee no increase in emissions from the plant, Alberti said in an interview from his office perched atop the medieval town overlooking the valley and oil facility.

While many favor further development, some residents grumble as they uneasily look at the oil plant’s flame, which has become for them a symbol of the valley’s exploitation.

“We’re simple people and the cohabitation isn’t always easy, health is a concern, the environment is a concern and we intend to protect both,” mayor Alberti said.

Both Eni and an independent regional authority regularly monitor the air, water and soil. The company has tried to mitigate the visual impact of its work, putting a cover around the less attractive parts of its rig and painting equipment in soft green colors that blend with the landscape. An operation that Eni manager Gheller says is “unique in its kind.”

“We don’t need green skirts on wells, we need to stop,” said environmentalist De Biasi. “They’ll push for more but we’ll give battle too.”

See the original article >>

A New Banking Crisis? What FDIC Does Not Want You to Know

By Louis Basenese

“What gets us into trouble is not what we don’t know. It’s what we know for sure that just ain’t so.” - Mark Twain
I’d have to disagree with Mr. Twain.

While holding fast to misconceptions can certainly ruin us, ignorance can get us into big trouble, too.

I mean, how many people would have scooped up real estate in 2007 if they’d known that Goldman Sachs had a $13.9 billion bet (dubbed “the big short”) against subprime mortgage-related securities at the time?

Not one!

With that in mind, it’s time to unmask the next potential crisis to hit the financial markets… before it’s too late!

All is Not Well With Banks

Longtime readers know that I’ve been chronicling the steady improvement in the financial sector. Thankfully, the latest data indicates that the positive progress is continuing…

The FDIC’s official tally of “problem banks” keeps declining. In fact, the number has retreated for seven consecutive quarters.

Even the unofficial number of problem banks is on the mend. (This is a broader measure, which includes institutions that have received enforcement actions by the Office of the Comptroller of the Currency.) The list now includes 770 banks with assets of about $285 billion, compared to 929 banks a year ago.

Don’t let that fool you into thinking that all is well in the banking world, though.

What you might not know is that the FDIC’s list only includes federally insured, traditional banks. It doesn’t include any of the 6,819 federally insured credit unions.

Most Americans don’t realize this, and therein lies the problem…

The Rise of Stealth Banks

Here’s what the bureaucrats at the FDIC don’t want us to know…

While traditional bank failures have been falling since 2010, credit union failures have remained steady at about 15 per year. And the fact that we’ve hit six so far in 2013 suggests that we’re on track for another average year.

However, I’m convinced the number could start climbing. Here’s why…

Over the last 20 years or so, the reach of these supposed “small, risk-averse and family-run” credit unions, asBusinessWeek puts it, keeps expanding. No longer are credit unions confined to serving small, local markets. Consider:

  • A total of $1.02 trillion in assets is now held in credit unions, based on the latest data from the National Credit Union Administration (NCUA).
  • About 20 years ago, there were only 13 credit unions with over $1 billion in assets. By comparison, there are almost 200 today. So we’re talking about a 1,400% increase in the number of large credit unions.

The Rise of Stealth Banks

To really put that growth in perspective, consider that over the same period (1994-2012), the number of traditional banks with over $1 billion in assets only increased by roughly 40%.

Much More Than a Community Lender

Bad things happen when financial institutions extend far beyond their original intent. And right now, credit unions have definitely done so.

Or as Keith Leggett, Senior Economist for the American Bankers Association, notes, “credit unions have evolved” to the point where a meaningful number are now competing directly with banks.

The real danger comes in when we realize that the insurance fund that backstops the credit unions’ aggressive growth practices stands at only $11 billion.

So all it would take to wipe out the fund entirely is for one of the four credit unions with assets of over $10 billion to fail.

I’m not saying such a failure is imminent. But I am saying that credit unions have grown too fast for their own good, and there probably isn’t enough insurance to cover the consequences of a disaster.

The good news?

Credit unions are non-profit entities and are owned by their members. So none are publicly traded. That means we don’t have to worry about owning a “problem credit union” in our portfolios.

The bad news? The key benefits that we associate with credit unions – like better interest rates and lower fees – might become a thing of the past.

Either because the companies can’t keep them and still grow enough to compete with traditional banks. Or worse, because they start going belly-up at an increasing rate.

See the original article >>

Gold Long Wait is Almost Over

By: Peter_Degraaf

“The American Republic will endure until the day Congress discovers that it can bribe the public with the public's money.” …Alexis de Tocqueville.

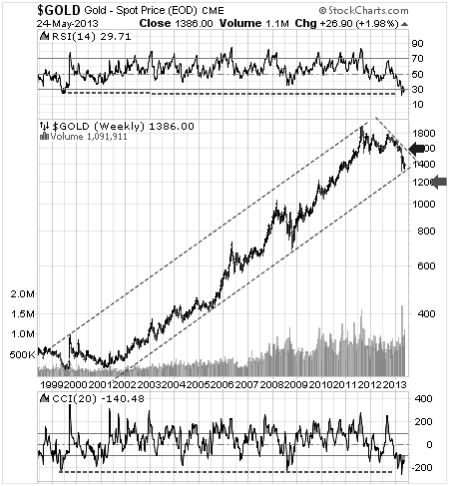
The price of gold reached an all-time high of $1925 on September 6th 2011. Since then the price dropped to a low point of $1321 on April 16th 2013. A correction of 45% during a bull market is not unusual; as painful as it is for gold bulls. In the process gold has reached a support line that has held up since the current bull market began. Time is almost up! In the words of W. D. Gann: “When time is up, price will reverse.”

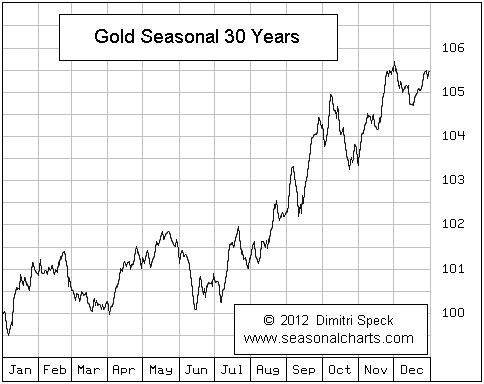
Featured is the weekly gold chart. Price has travelled inside this channel since turning bullish in 2002. The current correction has caused the RSI (top of chart), and CCI (bottom of chart), to return to support levels that have offered support in the past. Since June is often a low point in the yearly gold cycle, there is still a possibility that price could dip to lateral support at the green arrow. The closer we come to the end of June the less likely that this will occur. In the event that it happens, it would simply require a slight widening of the channel. A breakout at the blue arrow turns the trend bullish again.

This chart courtesy Seasonalcharts.com shows the tendency for gold to exhibit weakness into June before entering the ‘Christmas rally’. In view of the fact that gold suffered weakness in May (instead of strength) this year, it could well be that the June lows came early in 2013.

It is in the interest of central banks along with the bullion banks that are co-operating, to keep the price of gold as low as possible, to hide the effects of monetary inflation from the public.


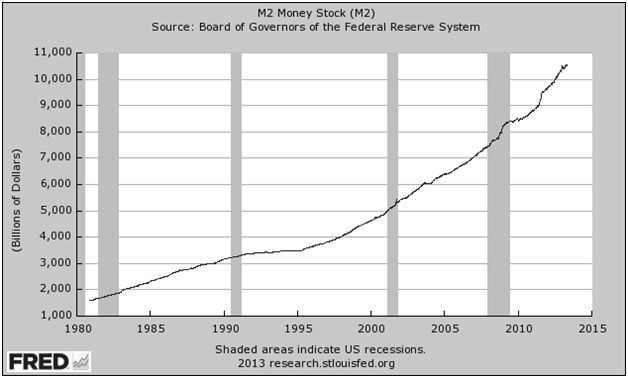
This chart courtesy Federal Reserve Bank of St. Louis shows the M2 money supply is rising without interruption. M2 is now seven times what it was in 1980, when gold was trading at $850.00. This has the potential to drive gold to almost $6,000.00 an ounce without even counting the money that is being printed by other countries. In the history of civilization, there is not one country that escaped the destruction of its fiat currency, once monetary inflation became part of the process.


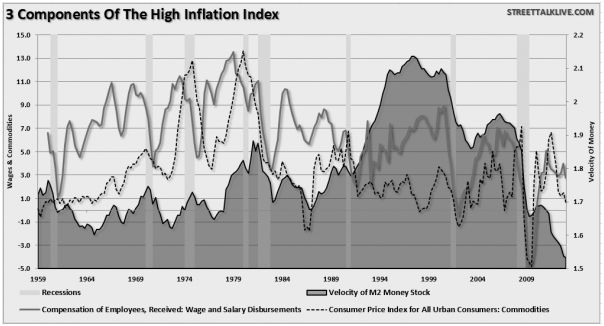
This chart courtesy Zerohedge.com shows the three components of price inflation: Velocity of M2 (blue), Wages (red), and CPI (dotted). Until these three trends turn up we can expect the US FED to continue to add liquidity to the system.

“There can be no other criterion, no other standard than gold.
Yes, gold which never changes, which can be turned into ingots
bars, coins, which has no nationality and which is eternally and
universally accepted as the unalterable fiduciary value par excellence” …..Charles Degaulle

Following are some charts that show the gold price is coiled, ready to spring.


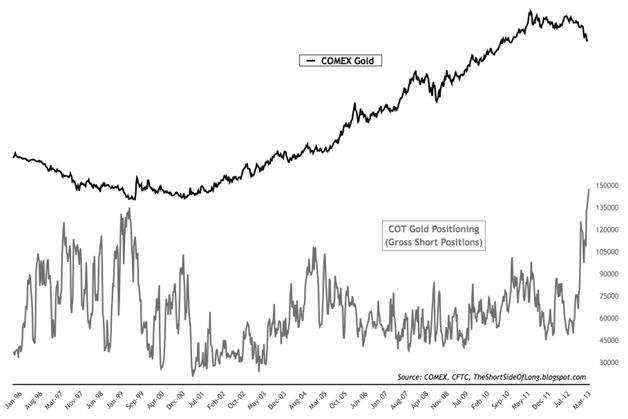
This chart courtesy Shortsideoflong.blogspot.com shows the Price of Gold at the top and the Gross Short Positions of Hedge Funds at the bottom. The number of short positions taken on by hedge funds is at an all-time high. Hedge funds use trend-following trading systems - they follow each other. They’ve all rushed into the same set-up, including add-ons during the past 3 weeks. They’ve taken these positions while the commercial traders (representing the so-called ‘smart money), have reduced their short positions to the lowest levels in several years (next chart).

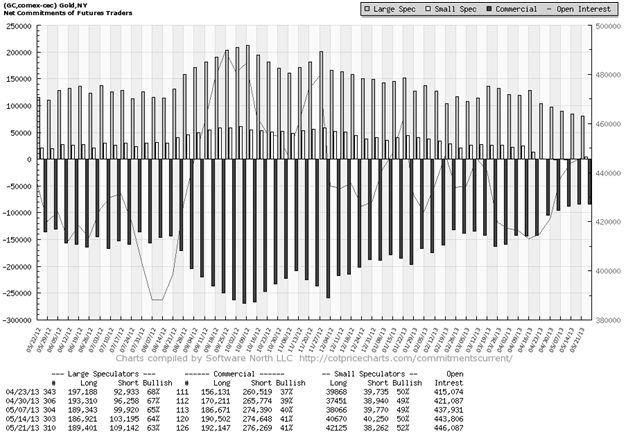
This chart courtesy Cotpricecharts.com shows the ‘net short’ position of commercial gold traders (currently at 84,000), to be at the lowest level since November 2008. Gold was trading at $802.00 back then, just before the rise to $1925.00 The commercials are telling us here that they expect the price to rise soon. As a percentage of the total open interest these net short positions make up just 19%. This is the lowest percentage in many years.


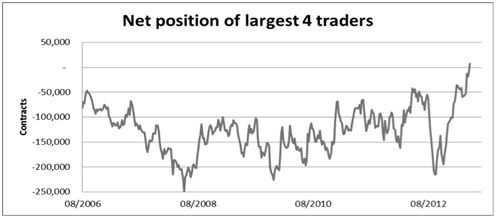
This chart courtesy Alisdair Mcleod shows the 4 largest commercial traders have gone 'net long' in COMEX gold contracts, for the first time since records were kept. This is extremely bullish, as these traders are considered to be the 'smart money'.

Still another sign that gold is ready to turn back up is seen by the number of analysts who are calling for lower prices, or denigrating gold such as Ric Edelman, who prefers to diversify into ‘paper wealth’ instead. The current ‘gold analysts survey’ by Mark Hulbert shows a reading of -35%. This is the lowest reading in years, and from a contrarian point of view this is a very bullish sign.

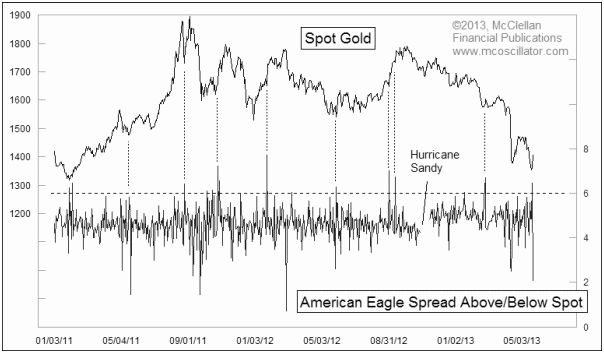
This chart courtesy Mc Clellan Financial Publications shows a correlation between the premium charged for American Gold Eagles at more than 6%, (scale at right side), and the subsequent rise in the price of gold (scale at left).

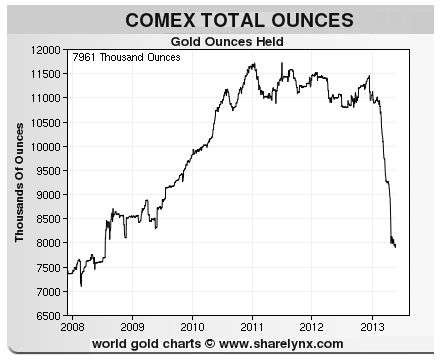
This chart courtesy Sharelynx.com shows the rapid decline in gold for delivery at the COMEX. The bullion is there to back the contracts that are bought and sold, in case the buyer wants to take delivery. If and when the COMEX runs out of gold (or nears that point) the officials in charge will declare 'force majeure' and the price of gold will rise dramatically, just as the Palladium price rose following a 'force majeure' a few years ago.


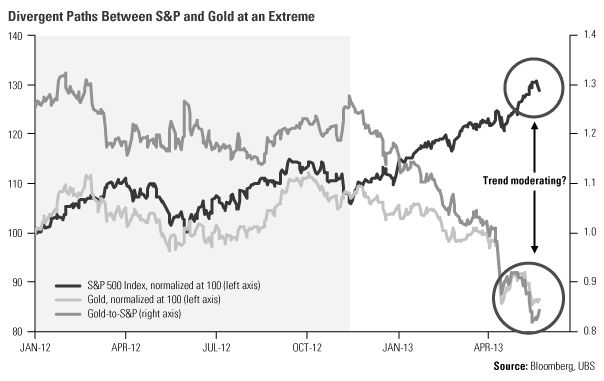
This chart courtesy Bloomberg, UBS, and Frank Holmes, shows the spread between gold and the S&P 500 index has widened considerably and is due to narrow.

The price of silver is also due to turn higher soon.


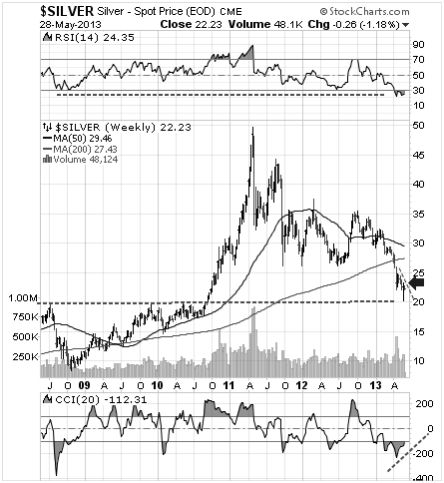
Featured is the weekly silver chart. Price produced an upside reversal after finding support at the lateral support level at 20.00. A close above the blue arrow will confirm the bottom. The two supporting indicators are already rising off support levels.


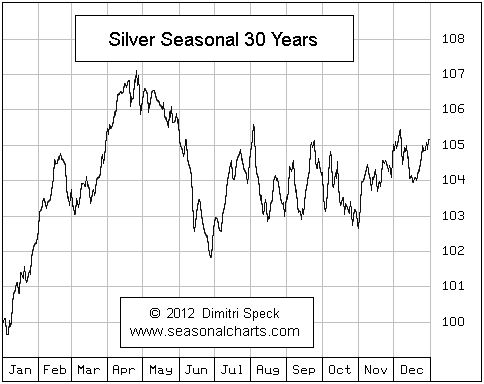
This chart courtesy Seasonalcharts.com shows the seasonal tendency for silver to bottom in June and rise for the remainder of the year and on into spring. In view of the fact that price dropped quite dramatically in April this year, could it be that the June bottom came early this year?

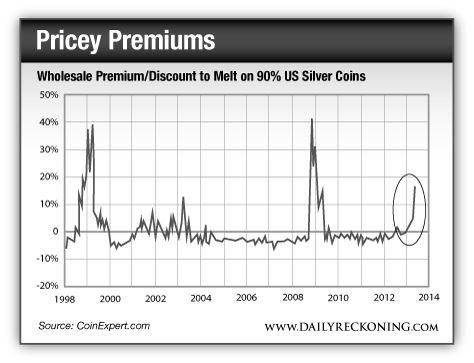
This chart courtesy CoinExpert.com and the Dailyreckoning.com shows the premium on US 'junk silver' coins continues to rise due to strong demand. Historically, whenever the premium on 90% US silver coins rises above 10%, it coincides with a strong rally in the price of silver.

Conclusion: We’ve either seen the bottom in this long correction, or we’re extremely close. Worldwide money printing is ongoing. Unless and until monetary inflation (monetary destruction) turns into price inflation (and it will), the expectation is that the printing presses will continue to produce paper. The longer the stand-off between central banks adding to the money supply, and the gold price being suppressed by bullion banks selling contracts that represent nothing but ‘I-owe-U’s, the higher the price of physical gold and silver will ultimately rise.

See the original article >>

Euro/Swissie: central bank action to come?

By Jaime Macrae

The Swiss franc has returned to the center stage of the forex world in recent days. Interest in the Swiss currency has revived after almost two years in relative obscurity following the Swiss National Bank’s decision to impose a cap against further appreciation versus the euro in September 2011, which effectively pegged the currency at 1.20 for most of 2012.

The Swiss franc, much like the Japanese yen, had been perceived to be a safe haven for investors during the past five years of intermittent financial crises, causing the currency to appreciate markedly since 2007, which in turn put pressure on consumer prices in Switzerland and hampered exports to its European neighbors.

The SNB successfully defended its decision to impose a ceiling on further appreciation against the euro, which is not surprising, because it has the ability to print unlimited quantities of its currency with which to buy euros. In the process, the bank has amassed huge amounts of the common European currency, more than doubling its holdings since the ceiling was imposed, and giving it the fifth largest foreign exchange reserves in the world.

While the move to stem the rise in the franc has been successful, it has not been enough to stop the persistent deflation that has plagued Switzerland, which has seen consumer prices decline for 19 consecutive months. In response, Thomas Jordan, chairman of the SNB, told reporters on May 22 that the central bank could take rates negative, effectively taxing savings to weaken the currency. He also indicated that the central bank could shift the cap on the franc lower, meaning further appreciation of the euro vs. the franc. Following his comments, the Swiss franc sank to a two-year low against the euro.

If the SNB were to pursue a policy of negative rates, whereby excess reserves deposited with the central bank would be charged interest that would then be passed along by the banks to their depositors, the appeal of holding Swiss francs would be tarnished. Alternatively, the SNB could also raise the 1.20 cap, which would be easier now that the franc has traded away from that level. In either event, the central bank has demonstrated both the ability and the will to see the franc move lower relative to the euro. Given the well-defended 1.20 cap on franc appreciation, the risk in being short the Swiss franc seems well defined.

The CME has a listed futures contract on the euro/swiss cross, which is the easiest way to express a view on the currency. The risk in this trade is a return to a highly risk-adverse environment where investors are willing to pay a high premium for the relative safety of the Alpine currency. Stops should be placed below 1.1950, at a level that would indicate the SNB had broken with its policy of containing the rise of the franc.

See the original article >>

This could bring a smile to Gold Miners faces!

by Chris Kimble

CLICK ON CHART TO ENLARGE

Smiles on the faces of Gold Miners have been hard to find in 2013, as GDX was down over 40% YTD recently.  The decline has driven GDX down to a lower lower channel support line that has seen counter trend bounces over the past couple of years.

The Power of the Pattern shared with Metals Research members over a week ago that another counter trend rally was due in the Miners due to the pattern at (1) above.

Not only did this pattern suggest a rally was due, a sentiment reading was hit recently in the metals complex that has NEVER happened before!

The above chart reflects potential where upside resistance could come into play.

See the original article >>

Nikkei Plunges Another 5% But "Unsourced" Stick Save Arrives Just In Time

by Tyler Durden

One look at the 5%+ plunge in the Nikkei overnight and one would be allowed to wonder if this was it for Abenomics: with a 15% drop from recent highs, and the TOPIX Real Estate index down by more than 20%+ since mid-April, entering a bear market, what's worse is that even the "wealth effect" Mrs Watanabe fanatics would be excused from having much hope going forward. The problem, however, is that in a world in which only the USDJPY matters as a risk signal, and only the stock market remains as a last bastion of "hope", the overnight weakness pushing the dollar yen to just 50 pips above 100 threatened to crush the manipulated rally and force everyone to doubt the sustainability of central planning. So, sure enough, literally seconds we got the much needed stick save without which everything could have come tumbling down, namely based on an unsourced article out of Reuters that Japan's Public Pension Fund is considering a change to its portfolio strategy that could allow domestic equity share of investments to rise in rallying market.

The immediate result was an instantaneous surge in the USDJPY which in turn dragged global risk higher across the board, simply due to what algos deemed as yet another procyclical last minute rescue. More importantly this was nothing but a squeeze catalyst coming at just the right time before market open to prevent a rout in global equities. Ironically, that we are back to the Reuters "sticksave" unsourced article, indicates just how weak the reality behind the scenes must be.

Among the other considerations, if any, behind this move from Reuters:

Japan's public pension fund - a pool of over $1 trillion (659 billion pounds) is considering a change to its portfolio strategy that could allow its investment in domestic stocks to grow with a rallying market, according to people familiar with the deliberations.

The changes, yet to be finalised, would mark the most significant revision in investment strategy for the world's largest pension fund since 2006 and highlight the game-changing economic policies of Prime Minister Shinzo Abe.

Without the shift, the Government Pension Investment Fund (GPIF) could be forced to buy Japanese government bonds, already the biggest part of its portfolio by far, in a weakening and more volatile market. It could also have to sell Japanese stocks in an equity market that has rallied more than 60 percent since November even after the recent sell-off.

The fund's exposure to domestic bonds has dropped to near the bottom of the allowable limit under its established portfolio. At the same time, the allocations for overseas and domestic equities have neared their maximum limits.

So without changes, the fund would be forced to buy weakening bonds and sell rising stocks. GPIF has not detailed its current risk and return profile, but fund management have used such projections as a benchmark to ensure that the public fund is not overexposed to riskier and more volatile assets.

In other words, just like every other insolvent country, the pension fund is the last bastion of preserving the rally, when even the central bank fails. How pensioners will feel about losing their retirement money much faster than usual remains to be seen. What was notable is that Reuters, so well known for spreading disinformation during the European "headline" war, appears to be back to its old tricks:

The sources, who declined to be identified because they were not authorised to discuss the pending changes, said the fund is expected to announce the changes as soon as next month.

An official at GPIF declined to comment on the matter.

We have seen this exact same song and dance in Europe all through 2011 and 2012: Reuters floats a confused, unsourced article, which is actually negative for risk (in Japan the key threat is not stocks, it is bonds, and who will buy them - and there goes another willing buyer), but which trigger covering stops by headline and keyword scanning algos who have the reading comprehension of a Nike shoe. Just as was intended. Of course, the impact of such moves gets less and less with every incremental abuse of vacuum tube stupidity.

There was little else of note in overnight news. From Bloomberg:

  • Treasuries gain for a second day as Nikkei falls 5.2%, extending its loss from last week’s high to 13%. JPY strengthened as data showed Japanese investors were net sellers of foreign debt for a second week.
  • The BoJ will purchase JGBs about 8 to 10 times a month starting June, compared with the current pace of around 8 times, according to a BOJ statement today in Tokyo
  • BoJ Deputy Governor Nakaso, speaking in Tokyo, said it’s critical to maintain trust in Japan’s fiscal situation and he doesn’t expect surge in yields
  • Merkel plans to meet France’s Hollande in Paris today as the leaders look for common ground on how to boost the region’s competitiveness, reduce joblessness and jolt Europe out of crisis mode
    Euro area economic confidence rose to 89.4 from 88.6 in April, in line with the median estimate in a Bloomberg News survey
  • Italy sold EU3b of 10Y bonds at 4.14% vs 3.94% at an April 29 auction; bid-to-cover was 1.38 vs 1.42
  • Three-quarters of U.S. voters want a special prosecutor to investigate the IRS’s targeting of Tea Party groups, according to a poll that showed a drop in  Obama’s approval and trust ratings
  • Sovereign yields lower across the board, led by Germany and the U.S. Asian stocks follow Nikkei lower; European stocks gain while U.S. stock index futures decline. WTI crude falls, metals rise

SocGen recaps the main macro catalysts:

European confidence and flash CPI inflation data will again prove secondary today to the main undercurrents in cross asset markets where the bias towards higher core long-term rates has started to take a toll on broader asset classes including stocks and EU periphery debt. The retracement in USD/JPY below 101.20 was key yesterday and selling persisted overnight as the Nikkei dropped another 5.15%. Option structures are offering protection in the 100.50 area but a test of 100.00 cannot be ruled out if stocks continue to fret over higher rates and China data disappoint next week. The reaction of EU periphery yields to the lifting of the Excessive Deficit Procedure imposed on Italy yesterday does not augur well either, and suggests most, if not all, of the good news has been priced in. BTPs did not quite celebrate the EC recommendation and projection that the deficit will fall below 3% of GDP this year - a jump in 10y yields has boosted the spread over bunds to 269bp. This puts the onus for Italian supply on the 2018 and 2023 bonds this morning.

The vulnerability of the US mortgage market has been driving the rates complex higher and in itself this has been one of the main drivers of the wild moves over the last 24 hours as markets discuss the plausible Fed exit scenarios. The sharp drop in prices of MBS securities and the corresponding rise in yield (see chart) has magnified the selling pressure on USTs which are used to hedge against declining MBS prices and falling mortgage prepayments (lower prices means a higher interest rate to attract buyers, but higher rates also mean a higher likelihood of refinancing). The Fed has a total of $1.17trn of agency mortgage-backed securities on its balance sheet, so depending on the format of future tapering (USTs, agencies, or a mix of both?), it must tread carefully to ensure an orderly transition in UST yields and mortgages. Rising US house prices and the pick-up in construction and residential investment have been key components of the economic recovery and the rebound in net household wealth.

Today is likely to be another US-centric day with the release of weekly initial claims and the second estimate of Q1 GDP. The initial claims are not forecast to have changed from last week's 340k, so any deviation from that makes the market susceptible to a meaningful knee-jerk reaction. Continuing claims are forecast to have edged up to 2.956m vs 2.912m. The sale of 7y notes wraps up this week's supply.

* * *

And the full overnight recap from Deutsche Bank:

Since hitting a cyclical high mid-last week, the Nikkei and Topix indices have lost around 10% in local currency terms. The recent JGB selloff has meant that some  of the more yield-sensitive parts of the equity market have fared more poorly than others. Case in point is the TOPIX Banks index which is more than 16% lower  than its mid-May peak. Similarly, the REIT-heavy TOPIX Real Estate index is down by more than 20%+ since mid-April, crossing into bear-market territory. Both indices are still around 30% higher on a year-to-date basis though.

Dividend stocks are also taking a hit elsewhere in Asia given the recent volatility in UST yields. For instance, the Bloomberg Asia REIT index is down 7th out of the
last 8 trading days and is poised to wrap up its worst monthly performance in more than four years (-12%). The MSCI Asia Telecom index is also down for the second day to a 5-week low. In Hong Kong, the Utility sector is also lower led by Cheung Kong Infrastructure, which is down to its lowest in over 2 months. In Australia, dividend yield sectors such as the REITs and Banks are down 7.5% and 9% since their respective peaks n the last month.

Staying in Asia, 10 year JGBs are trading 3bp firmer overnight (0.89%) and is helping stem some of the recent selloff in Asian EM local rates markets which saw the Philippines 10yr sell off by 71bp yesterday in its 12th biggest one-day spike since 1998. In other EM rates, South Korean and Indonesian 10yrs are both marginally softer this morning.

Briefly recapping yesterday’s session, the underperformance of yield stocks was certainly seen in the US market with higher yielding S&P500 sectors such as  telcos (-1.5%), utilities (-1.5%) and consumer goods (-1.7%) bearing the brunt of the selloff. With markets increasingly focussed on the tone of Fed-speak, the   usually-dovish Boston Fed President Eric Rosengren maintained yesterday that significant monetary accommodation was still needed. But he also commented that he expected the job market and the economy to be strong enough in a few months' time for the Fed to consider reducing asset purchases by a modest amount. Data-wise it was a relatively mixed day. US mortgage applications fell 8.8% on the previous week with some blaming the result on a rise in the 30yr mortgage rate to a one-yr high of 3.9% which has dampened refinancing demand. In Europe, there was some focus on the stronger than expected Eurozone M3 in April, which rose 3.2% yoy versus estimates of 2.9%. DB’s Mark Wall notes that the headline outcome was predominantly due to base effects while details of the report were softer. Credit to euro area residents contracted in April (-37bn) after showing some strength during the month of March (+59bn). There was continued  shortening of bank liabilities with overnight deposits seeing inflows for the twelfth consecutive month (+390bn since last May) while short term deposits and marketable instruments continued to see outflows. Our economists think that the pressure for the ECB-EIB taskforce on SME lending to deliver something non-trivial is building, but they do not expect action for at least a couple of months. In Germany, unemployment increased rose by 21k in May, above market expectations of 5k, and the unemployment rate remained unchanged at 6.9%.

Looking at the day ahead we suspect government bond markets will continue to be the main focus for investors. Given the recent moves in Treasuries, upcoming US data points will clearly be closely followed as in the near term it may affect the speed and quantum of any Fed tapering. On that note, the second reading of  the Q1 US GDP, initial jobless claims and pending home sales are the notable releases today. DB’s Joe LaVorgna is expecting today’s first set of revisions to Q1  GDP to show only a modest change to the composition of growth seen last quarter. As a result they are projecting only a slight downward revision in growth to  2.4% from its initial, above-trend print of 2.5%. Initial jobless claims are largely expected to hold steady at 340k while pending home sales are expected to show a strong  year-over-year improvement. In Europe, we have the latest economic sentiment survey from the European Commission and French jobseeker data but  the US economic/macro picture is the key at the moment.

See the original article >>

"Risk On" Rally - Don't Forget The Risk Part

Written by Lance Roberts

I have been bombarded as of late by media requests for the "meaning" behind the markets hitting "all-time" nominal highs.  The reality is that it means very little.  I was discussing this same issue at the beginning of April 2013 just as the markets hit "all time" nominal highs then.   I wrote, at that time, "The Great Disconnect: Markets Vs. Economy" in which I stated:

"Since Jan 1st of 2009, through the end of March, the stock market has risen by an astounding 67.8%. However, if we measure from the March 9, 2009 lows, the percentage gain doubles to 132% in just 48 months. With such a large gain in the financial markets we should see a commensurate indication of economic growth - right?

The reality is that after 4-Q.E. programs, a maturity extension program, bailouts of TARP, TGLP, TGLF, etc., HAMP, HARP, direct bailouts of Bear Stearns, AIG, GM, bank supports, etc., all of which total to more than $30 Trillion and counting, the economy has grown by a whopping $954.5 billion since the beginning of 2009. This equates to a whopping 7.5% growth during the same time period as the market surges by more than 100%."

001-SP500-GDP-Fed-040113

"However, as shown in the chart above the Fed's monetary programs have inflated the excess reserves of the major banks by roughly 170% during the same period of time. The increases in excess reserves, which the banks can borrow for effectively zero, have been funneled directly into risky assets in order to create returns. This is why there is such a high correlation, roughly 85%, between the increase in the Fed's balance sheet and the return of the stock market."

As you can see in the chart below the correlation between the increases in the Federal Reserve's balance sheet is highly correlated to the rise in asset prices.

Fed-Balance-Sheet-VS-SP500-050913

With the economic backdrop deteriorating, along with earnings, the divergence between asset inflation and economic fundamentals continues to widen.

Risk On

However, at the current time, there is no doubt that the "risk on" trade is in play.  Consequently, with no real threats on the short term horizon there is nothing to stop the elevation of asset prices as long as the Fed continues to inflate their balance sheet, and by extension, flood Wall Street with excess liquidity.

As I have discussed many times in the past, "risk" equates to how much you will lose when, not if, you are "wrong."   There is more than sufficient evidence that investors are pushing the limits of their "risk taking" ability from near record levels of margin debt, very high levels of complacency and historically low "junk bond" yields.  Despite much of the media commentary that says individuals are sitting out of the market - the data suggests otherwise.   The chart below shows that U.S. investors hold the highest level of equity exposure relative to other developed countries.

bond-bubble

The point here is that eventually, and it is only a function of time, the "risk on" trade will be turned off.  Of course, for individuals, this leads to two primary questions:

1) When will a correction occur?

2) What will the magnitude of the correction be?

The question of "when" is always the most difficult to answer.  The old axiom that "...the markets can remain irrational longer than you can remain solvent" holds true in this regard.  Answering the question of when is, in reality, better left to fortune tellers and psychics.  Forecasting the future is always a dangerous endeavor.

However, the question of "when" is valid because it is only a function of time until a correction of magnitude occurs.  The timing of the "when" is typcially when you least expect it.  This is the problem with complacency as the inflation of asset prices, and the belief that the "Fed" will continue to bail out every problem, lulls individuals into a state of lethargy.  This leads to panic selling when the reversion of fantasy to reality occurs and results in far more losses than most could ever imagine.

While I can't tell you precisely "when" a correction will occur - I can tell you is that the likelihood of a significant correction has risen tremendously in recent months.  The chart below shows the S&P 500 with the percentage deviation above and below the 50-WEEK moving average.  I use a weekly moving average to smooth out the noise of a daily average to better analyze the current trend of the market.

SP500-WilliamsR-050913

While the market is currently in a very bullish trend - the deviation of the market is now 12.69% above its 50-WMA.  Historically, such levels have existed only prior to corrections.  In bull markets, as we are currently in, corrections tend to consist of a reversion back to the 50-WMA which is currently at 1448.  This would imply an 11.2% correction from the recent peak.  As long as the Federal Reserve continues to inject round after round of liquidity into the financial markets - corrections should be fairly well contained to the 50-WMA.

However, there is no guarante of that.

Mapping The Correction

The chart below is a MONTHLY chart of the S&P 500 Index and overlaid with our primary and secondary overbought/sold indicators.

S&P-500-Williams-R-050913

Currently, the S&P 500 is trading 2-standard deviations above the 21-month moving average which has only occurred previously near both short and intermediate term market peaks.

However, more importantly, is the top chart which is a very slow overbought/sold indicator.  As you can see this indicator is currently at extremes witnessed previously at the peak of the market in 2000 and 2008.  Historically, this peaking process can take some time to complete and, historically, it has been between 12-18 months.  The current extreme condition began roughly 12 months ago so the timing of a correction is coming closer.

To answer the second question of "what the magnitude of the correction will be?" will require a range of assumptions.   We know from the analysis above the correction from current levels back to the 50-WMA, a normal correction within a sustained bull market trend, would be roughly 11%.  However, with margin debt and leverage at very high levels, a correction could gain momentum leading to a more severe decline.

The chart below is a Fibonacci retracement of the market advance from the 2009 lows using a monthly price chart.  This analysis can help us determine levels of key support in the event of a more substantial decline.

S&P500-Fibbonacci-Retracement-050913

As you can see there are three different retracement levels.  In most cases corrections tend to stay contained within the first two zones encompassing a retracement of either 38.2% or 50% of the previous advance.   In the event of a more substantial market correction, such as we saw in 2011, a decline to the first level would entail a loss of 22.5% with a decline to the second level pushing nearly a 30% loss.   Historically speaking, a correction of such magnitude would likely be tied to the onset of a recession in the economy.  This is a real, and rising, risk currently from the standpoint that we have already passed the median point of normal economic expansions.

The third level, which would entail a 36.6% loss, is a possibility given the onset of a recession coupled with some sort of financial or geopolitical risk.  This is a more remote possibility in the current environment.

While investor's, and the media, are certainly enjoying the markets ride - it is always important to remember that the "ride" eventually ends.  A loss of 22% to 30% will wipe out 2-3 years of gains and 5, or more, years of your retirement planning and preparation cycle.

You are a "saver" and not an "investor."  An investor, such as Warren Buffett, has no definitive time line on the investments he makes.  You, however, only have until you need your money to live on.  Therefore, after two previous bear markets, it is more important than ever to understand the level of risk you are undertaking in your portfolio and manage such risk accordingly.

I concluded previously that:

"...while the markets have surged to 'all-time highs' - for the majority of Americans who have little, or no, vested interest in the financial markets their view is markedly different. While the mainstream analysts and economists keep hoping with each passing year that this will be the year the economy comes roaring back - the reality is that all the stimulus and financial support available from the Fed, and the government, can't put a broken financial transmission system back together again. Eventually, the current disconnect between the economy and the markets will merge. My bet is that such a convergence is not likely to be a pleasant one."

That position has not changed and as my partner and co-portfolio manager recently said to me:

"This market is like a line for the electric chair...you just know where in the line you stand."

See the original article >>

Brazil disease cuts hopes for world cocoa supplies

by Agrimoney.com

Disease and drought damage in Brazil prompted the International Cocoa Organization to raise its estimate for the world production deficit of the bean, although the impact was offset by concerns over demand in the important Asian market.

The ICCO, in a quarterly bulletin, raised by 15,000 tonnes to 60,000 tonnes its forecast for the shortfall in world cocoa production in 2012-13.

Separately, soft commodities traded Armajaro estimated the world cocoa deficit in 2012-13 at 50,000 tonnes.

The ICCO revision reflected in part a downgrade of 36,000 tonnes, to 3.97m tonnes, in the forecast for global output, as producers in the north east of Brazil grapple not just with presistent drought which has also affected other crops such as coffee but an outbreak of witches' broom disease too.

'Disease is back'

"The first forecasts of the temporão crop for Bahia and other states [is] not looking promising," the ICCO said.

"The witches' broom fungus - which was the cause of Brazil's fall from number two among world producers in the 1990s to number six - is back, raising concern over the potential for further increase in the Bahia region," the organisation said.

"Spells of drought earlier in the season are adding to the losses, which can be anything between 30% and 50% of the temporão crop."

The ICCO cut by 35,000 tonnes to 195,000 tonnes its estimate for Brazilian output – taking it well behind the more than 820,000 tonnes it would need to beat Ghana into second rank among producers in 2012-13.

Asian worries

However, the impact of Brazil's woes on the world coca balance sheet was offset in part by a reduced estimate for world demand, cut by 21,000 tonnes to 3.99m tonnes, down to "uncertainty of the global economic situation and poor processing margins".

In particular, "there are now some concerns that the economic situation may affect near-term demand in Asia, which in the past few years has been a flourishing market".

The Asian grind, which had been seen increasing by 23,000 tonnes over the season, was now seen increasing by 3,000 tonnes.

"Lower demand for powder than previously anticipated has led [Asian] grinders to cut output", the ICCO said.

Mature vs developing markets

This revision, which came as the IMF cut to 7.75% from 8.0% its estimate for China's economic growth this year, demoted Asia behind the Americas and Europe in terms of growth this season.

"It should be noted that consumption amongst the middle classes in the BRIC countries was seen as offsetting the negative growth of the mature markets," the ICCO added.

See the original article >>

Cattle, pork driven by seasonals, fundamentals over China buy

By Rich Nelson

Hogs: We were surprised by the interest from clients Wednesday asking what type of price reaction would be seen from China’s largest pork processor, Shuanghui Intl., buying America’s largest hog producer and pork processor, Smithfield Foods.

This news raises all kinds of issues from plant operations, exports, and even some nationalistic/moral issues. From a short-term standpoint (the next six months), we do not see any measurable price impact.

Keep in mind that pork processors are simply middlemen between the base supply and the end user. They do not determine long-term pricing at all. However, they do have shorter picture pricing power as they can decide to increase or decrease hog buying.

Cattle: Futures, as well as wholesale beef, posted moderate gains Wednesday. It is likely this was in reaction to the Smithfield hog news. Theoretically, if you want to say U.S. pork exports will now increase to China that would mean less pork left in the United States to compete against beef.

If we actually quantified the amount of “extra” pork that could be sold, took that out of the U.S. meat market, then divided its actually price impact among chicken and beef, you would be hard pressed to find a perfect model suggesting U.S. cattle prices would increase by X cents per cwt. We do have our proprietary models of beef pricing, which do include the shifty competing meat relationship. Saying it clearly: China is moderately important to the U.S. pork market. They are NOT the U.S. pork market, though.

Realistically, a 5% or even 10% increase in pork exports to China will have such a small impact to beef prices that we don’t want to justify a full model run. It's a good story, but we will wait to see exactly how much of an increase will be seen before we start throwing out some crazy-sounding expectations.

For the overall beef picture, show lists continue to increase and we are approaching the seasonal glut of U.S. beef production. The peak week of production can hit anywhere from two to 12 weeks from now. This is not the time to start bullish talk for cattle…Rich Nelson

See the original article >>

A New Chance for European Politics

by Javier Solana

MADRID – Most political leaders in Europe want the European Union to emerge from its current crisis stronger and more united. But the economic policies that have been implemented in most EU countries since the crisis began have given rise to an unprecedented threat to deeper integration – and, indeed, to what already has been achieved.

This illustration is by Paul Lachine and comes from <a href="http://www.newsart.com">NewsArt.com</a>, and is the property of the NewsArt organization and of its artist. Reproducing this image is a violation of copyright law.

Illustration by Paul Lachine

After five years of financial and economic crisis, anti-European politics has come resoundingly to the fore in many EU countries – France, the United Kingdom, Italy, Austria, Holland, Finland, Greece, Portugal, and even Germany. Growing institutional disaffection has become a corrosive reality almost everywhere in Europe. The only way to overcome Europe’s existential crisis, and to respond to citizens’ demands for change, is to confront Europe’s domestic opponents head-on: politics without palliatives.

Europe needs, first and foremost, to break the vicious circle of recession, unemployment, and austerity that now has it in its grip. That means, first of all, refocusing economic policy on growth, employment, and institutional innovation. It is impossible to advance toward political union while seeming to abandon Europe’s citizens along the way, which is the impression that unremitting austerity has created. Sacrifice, too many Europeans believe, is not laying the groundwork for a better, more prosperous Europe, but is dragging them into a fatal tailspin.

European leaders cannot remain passive in the face of the dangerous populist tsunami now crossing the continent, and they know it. There is still time to react – by demonstrating strong leadership and prioritizing growth over short-sighted policies – but that time is limited and the clock is ticking.

Next year will be crucial, for it will mark the end of the current political cycle and the beginning of a new one. There will be a new German government, European Parliament elections, and, at the end of the year, a new European Commission. It is here that political leaders should devote their efforts.

No one wants the EU to fail because of its citizens’ disaffection. To take advantage of the political opportunity offered in 2014 requires launching an open, pedagogical effort now. European citizens have already shown a sense of responsibility and capacity for sacrifice, but they should know why hope – in the form of higher employment and living standards – is not futile.

If that does not happen, next year’s European elections may give rise to an unfortunate paradox. Just when, as a result of the Lisbon Treaty, the European Parliament gains more power than it has ever had, the risk of it being condemned to irrelevance is greatest. If, reflecting the mood in the member states, the elections result in a fragmented Parliament – possibly rendered less representative by low voter turnout – paralysis, disaffection, and ineffectiveness are guaranteed.

That is why Europe’s leaders should take advantage of the coming political cycle to correct Europe’s institutional design and strengthen its democratic legitimacy, thereby enabling them to respond to Euro-skepticism and ad hoc bilateral deals with more integration. If Europeans are to overcome their fear of giving up sovereignty in order to achieve political union, a civic sense of attachment to Europe and its institutions must be regained and nurtured.

Achieving this requires, among other things, the recovery of the Franco-German axis as Europe’s driving force. It also presupposes a European budget that is sufficient to meet expectations and equal to the challenges that await. Resolving these issues is as important as resolving individual countries’ economic problems. Indeed, they are in large part the same problem.

Institutions are legitimized in part by their effectiveness, and the EU must recover its authority to defend common interests and harmonize them with national concerns. The European Parliament can exercise its power only if citizens feel represented there. As Kemal Derviş, a vice president of the Brookings Institution, recently put it: “If independent technocrats are allowed to determine long-term policy and set objectives that cannot be influenced by democratic majorities, democracy itself is in serious jeopardy.”

Next year will also mark the centenary of the outbreak of World War I. From that moment until the present, Europe has both endured the worst and enjoyed the best of its history. We should bear in mind the enormous symbolism of this date in order to understand how much Europe has changed – and, at the same time, to recognize the need to defend those changes.

The EU is one of the great political milestones of mankind. For this reason, and in order to emerge stronger from the difficult situation in which Europeans now find themselves, Europe’s leaders must work with the conviction that the future is inexorably linked to a more integrated and more capable Union.

See the original article >>

Nikkei leads Asian share tumble, dollar slips on QE jitters

By Chikako Mogi

A visitor looks at his mobile phone in front of monitors displaying market indices at the Tokyo Stock Exchange in Tokyo July 13, 2012. REUTERS-Toru Hanai

TOKYO | Thu May 30, 2013 2:28am EDT

TOKYO (Reuters) - Japanese equities led a tumble in Asian shares as the dollar slipped to fresh lows against the yen on Thursday, as investors worry what might happen if the U.S. Federal Reserve's winds back its massive stimulus program.

"The rising yen is just a minor reason that triggered further selling. The fundamental concern that's been in investors' heads is the possibility that the Fed is exiting from quantitative easing," said a fund manager at a U.S. hedge fund.

Despite the slide in Asian shares, European stock markets are expected to edge higher, with financial spreadbetters predicting London's FTSE 100 .FTSE, Paris's CAC-40 .FCHI and Frankfurt's DAX .GDAXI to open as much as 0.4 percent higher. A 0.1 percent drop in U.S. stock futures pointed to a more sober tone at Wall Street open. .L.EU.N

The Nikkei stock average .N225 tumbled more than 5 percent to a five-week low, dragged lower by the dollar's decline to its lowest since May 10 against the yen, which weighed on exporters.

The Nikkei's rally had been driven by bets for a weakening yen as a result of the Bank of Japan's bold reflationary measures to help Japan regain strength.

"It may seem illogical (for the forex market to follow the Nikkei), but a weaker yen led to optimism for stocks before, so right now the Nikkei's retreat has initiated a fall in the dollar-yen too," said Masashi Murata, senior currency strategist at Brown Brothers Harriman in Tokyo.

The magnitude of position reshuffling may be greater for the Nikkei which outpaced the rest of Asian bourses by far with its 38 percent gain since the start of 2013. Bourses in Indonesia .JKSE and the Philippines .SETI, both of which hit record highs this year, have shown 19 percent and 21 percent growth year-to-date.

MSCI's broadest index of Asia-Pacific shares outside Japan .MIAPJ0000PUS shed 0.8 percent to a six-week low of 463.31.

Sentiment was also weighed as the CBOE Volatility index .VIX, which measures expected volatility in the Standard & Poor's 500 index .SPX over the next 30 days, hit a five-week high on Wednesday before closing up 2.4 percent.

The dollar also weakened broadly, as Wall Street retreated on fears that strength in the U.S. economy could lead the Fed to scale down its aggressive support measures, and as U.S. Treasury yields eased from multi-month highs on Wednesday.

"Speculation about the Fed may be affecting markets in Asia which have been rallying on funds flowing in as a result of the Fed's stimulus," particularly in Hong Kong, said Hirokazu Yuihama, a senior strategist at Daiwa Securities in Tokyo.

"But such speculation about the Fed scaling down its stimulus has been surfacing since the start of the year, and investors may eventually shift their focus to the region's moderate growth which will likely improve corporate earnings prospects, after the current adjustment phase is over," he said.

Australian shares .AXJO shed 1.2 percent to their lowest in nearly two months as financials lost ground while weak metals prices hit miners. Hong Kong shares .HSI fell 1 percent while Shanghai shares .SSEC eased 0.3 percent.

The dollar fell to a session low of 100.555 yen while the dollar index .DXY measured against a basket of six key currencies slipped 0.37 percent to 83.347, moving further away from its highest since July 2010 of 84.498 reached on May 23.

Hiroshi Maeba, head of FX trading Japan for UBS in Tokyo, pointed to a sense of uneasiness when both U.S. equities and Treasury yields jumped earlier this week, which suggested stocks were due for a correction, but views of a potential shift in Fed policy as the U.S. economy recovers justified a rise in yields more than in equities.

"The dollar is undergoing adjustments as other markets sort out this strange situation. But the U.S. economy is resilient, and if U.S. yields are rising as a result of a positive growth outlook, then equities will eventually stabilize. In a broader scope, there is no change in a trend for dollar buying and selling of the yen and the Swiss francs," Maeba said.

Benchmark U.S. 10-year Treasury yields eased to 2.12 percent on Wednesday, having reached a 13-month high of 2.24 percent earlier this week.

"In the investment grade space, U.S. Treasuries remain the single largest risk at the moment. We prefer short-dated corporate papers and continue to underweight perpetual bonds given the high convexity risk (from low coupons) in a rising rate environment," said Arthur Lau, Pinebridge Investments head of fixed income Asia ex-Japan.

Investors will keep a close eye on upcoming U.S. data including the week's jobless claims number and first-quarter gross domestic product data due later in the session.

Japan's capital flows data on Thursday showed foreign investors remained net buyers of Japanese stocks for the week ending on May 25 while Japanese investors sold a net 1.117 trillion yen of foreign bonds in the same period. <JP/CAP>

Demand worries continued to weigh on commodities.

U.S. crude futures recovered earlier losses to inch up 0.1 percent to $93.22 a barrel while Brent rose 0.3 percent to $102.74. <O/R>

Tumbling stocks underpinned spot gold, which rose as much as 1 percent and last traded up 0.8 percent to $1,403.16 an ounce. <GOL/>

"This is a very tricky issue. I don't think Fed chairman Ben Bernanke really wants to start tapering stimulus, but more and more policymakers are for it," said Joyce Liu, an investment analyst at Phillip Futures.

See the original article >>

Clues To Watch For The End Of QE "Infinity"

by Lance Roberts

So, apparently, according to Jon Hilsenrath, "QE to Infinity" is actually "finite" after all.  With Ben Bernanke set to "exit stage left" in 2014 the question of who replaces him at the helm of the massive USS "Federal Reserve" will be important as to the future of the current course of monetary policy.   One of the top contenders for that job is Janet Yellen.  However, according to the variety of erudite speakers at the recent Strategic Investment Conference, there are many hurdles ahead for her and she may be just too "dovish" to actually land the job.

However, according to Hilsenrath, the Federal Reserve has already mapped out a strategy for winding down the unprecedented $85 billion monthly bond buying program meant to spur the economy.

"Officials say they plan to reduce the amount of bonds they buy in careful and potentially halting steps, varying their purchases as their confidence about the job market and inflation evolves. The timing on when to start is still being debated.

The Fed's strategy for how and when to wind down the program is of intense interest in financial markets. While the strategy being debated leaves the Fed plenty of flexibility, it might not be the clear and steady path markets expect based on past experience.

Officials are focusing on clarifying the strategy so markets don't overreact about their next moves. For example, officials want to avoid creating expectations that their retreat will be a steady, uniform process like their approach from 2003 to 2006, when they raised short-term interest rates in a series of quarter-percentage-point increments over 17 straight policy meetings."

The stock market has rallied sharply in direct correlation to the expansion of the Fed's balance sheet yet economic growth has floundered much to the dismay of the Federal Reserve.  As I discussed recently:

"The increases in excess reserves, which the banks can borrow for effectively zero, have been funneled directly into risky assets in order to create returns.  This is why there is such a high correlation, roughly 85%, between the increase in the Fed's balance sheet and the return of the stock market."

Fed-Balance-Sheet-VS-SP500-050913

The question for investors becomes "What will be the sign posts that QE has come to an end?"

Fortunately, while the magnitude of the current monetary experiment is unprecedented, what happens when to the financial markets, and economy, when one of the program cycles ends - is not.   When the first round of Large Scale Asset Purchase programs (LSAP), or more commonly referred to as "Quantitative Easing (QE)", was launched it was scheduled to end in June of 2010.   Similarly, when the second program was launched in fall of 2010 it was similarly scheduled to end in the summer of 2011.  In both cases there were finite start and end dates to the programs around which the financial markets could plan.

This is the key difference between the two earlier programs and the current QE program which has no definitive scope in size or end date but was, for the first time, targeted to specific economic variables of inflation and unemployment rates.  This key difference leaves much room for speculation by Wall Street as to where the limits of the program actually lay as well as how far the Federal Reserve will push those limits. 

However, there are some key areas that we can watch, as investors, that should tell us that the Fed has indeed embarked upon a process to wind down the current QE program.

Sign Post 1:  The US Dollar

One of the areas directly influenced by QE programs is the U.S. dollar.  Other countries store their excess reserves in the U.S. dollar when they feel that the U.S. economy strong, or at least stronger, than other countries.  The inflows into the dollar for "safety" causes the U.S. dollar to rise relative to other currencies.  This is why you have often heard the term that the "U.S. dollar is the cleanest - dirty shirt."   While the U.S. economy is not strong on any measure - it is stronger than most other economies in general.

The chart below shows the impact of past QE programs on the dollar.

QE-Vs-Assets-Dollar-051313

As you can see when QE programs have been in full swing that dollar has declined against other currencies as the "short US Dollar - long dollar denominated assets" carry trade was engaged.  However, when these programs came to an end the dollar rose as "risk" was unwound.  However, during QE 3 the dollar has risen as the Japanese Yen has been the target of the "carry trade" with Japan's QE program dwarfing, on a relative basis, the size of that in the U.S.

We will want to watch for a decline in the dollar as QE3 begins to slow down and the support against a very weak economic state is removed.  Increases in economic weakness will act as a headwind against the rise of the dollar.

However, one scenario that could drive the dollar substantially higher in the near term is a failure of Abe-nomics in Japan.   If Kyle Bass turns out to be correct, and their current monetary experiment fails, the flight of capital out of Japan into the U.S. for safety could lead to a sharp rise in the dollar.  However, such an event will be bad economically for the U.S. as exports will become to expensive too quickly and will likely push the U.S. into a recession.

Sign Post 2:  Gold & Commodities

Gold is not behaving under the current QE program as it has during the previous two.  Gold spiked sharply during the two previous programs as the fears of hyperinflation and economic ruin fueled speculative gold buying.  However, gold has plunged sharply during QE 3 as concerns of "deflation" have continued to show prevalence in recent economic reports.

QE-Vs-Assets-Gold-051313

However, it is likely that we could see gold rise in the months ahead if economic weakness continues to perforate the data.   The chart below shows commodities during the same QE programs.  Like gold, commodities rose as economies recovered.  However, commodities are clearly signaling that deflation, and economic weakness, is ripping through the world economies and, without the monetary support from the Federal Reserve, the U.S. economy would likely be exhibiting far more weakness than it is currently.

QE-Vs-Assets-Commodities-051313

Investors should be watching for a continued decline in commodities as economic erosion gains traction.  However, as the underlying economic weakness surfaces the reversion of money flows out of the "risk-on equity trade" into "safety" will push gold higher.

Sign Post 3:  Same For Bonds

The same goes for bonds.   During QE programs interest rates have risen as the "risk" trade pushed money flows into stocks.  However, the opposite occurred at the end of programs as money fled from stocks and into the perceived "safety" of bonds. 

QE-Vs-Assets-InterestRates-051313

Despite calls for the end of the "bond bubble" the reality is that with the demographic shift in the country leading to a need for "yield" coupled with the Fed suppressing interest rates to historically low levels - the money flows will continue to push into bonds for the foreseeable future.   This will particularly be the case when QE 3 ends and the inevitable reversion in stock prices occurs.

Interest rates have already been declining as economic data has weakened.  However, the reversion of the "risk trade" into the "safety trade" will likely drive interest rates to our long term target of 1% or potentially lower.

Sign Post 4: The Stock Market Reversion

When something is perceived that it cannot end, it will, and likely sooner than you think.

That is the way that it is with the stock market currently.  The belief is that the current trajectory of stocks will continue indefinitely, however, that is subject to how much further that the Federal Reserve is willing to inflation their balance sheet.   The reality is, as shown in the chart below, is that when the Federal Reserve begins to stabilize, and or reduce, their balance sheet it will be reflected in the stock market.

QE-Vs-Assets-SP500-051313

During each program there was a belief that the current trend would not be broken.  Yet in each case the result was the same as the corrections in the markets, following the end of QE programs, have progressively become more severe.

The reason that each correction has gained more severity is due to the extension of prices relative to the underlying fundamentals.  During the first two programs economic and market fundamentals were improving.  That is no longer the case and the unwinding of QE 3 is likely to leave a rather large vacuum below current asset prices.   Investors need to watch corrections in market prices for signals that the current bullish trend is being violated.

Sign Post 5: The VIX Will Lead The Way

The volatility index (VIX) has been muted ever since the Fed started hinting at QE 3 last summer.  With the Fed "in play" market participants have "no fear" of taking on additional risk.   It becomes an even bigger issue when the "lack of fear" is coupled with "leverage" as witnessed by the levels of margin debt now reaching levels seen at the peak of the markets in 2008. 

QE-Vs-Assets-VIX-051313

What the chart above shows is that "WHEN" the eventual reversion in the stock market occurs the volatility index will begin to spike sharply higher.  investors should watch the VIX closely as it will begin to push higher as the correction begins.  When price supports are broken, and ultimately the bullish upward trend, the VIX will begin to spike sharply higher as stock prices fall.  This will be your signal that it is time to leave the casino.

The Race For The Door

There is no doubt that the Federal Reserve will do everything in its power to try and "talk" the markets down and "signal" policy changes well in advance of actual action.  However, that is unlikely to matter. 

The problem with the financial markets today is the speed at which things occur.   High frequency trading, algorithmic programs, program trading combined with market participant's "herd mentality" is not influenced by actions but rather by perception.

As stated above, with margin debt at historically high levels when the "herd" begins to turn it will not be a slow and methodical process but rather a stampede with little regard to valuation or fundamental measures.  As prices decline it will trigger margin calls which will induce more indiscriminate selling.  The vicious cycle will repeat until margin levels are cleared and selling is exhausted.

The reality is that the stock market is extremely vulnerable to a sharp correction.   Currently, complacency is near record levels and no one sees a severe market retracement as a possibility.  The common belief is that there is "no bubble" in assets and the Federal Reserve has everything under control.

Of course, that is what we heard at the peak of the markets in 2000 and 2008 just before the "race for the door" led to fingers being pointed, blame laid and calls for more regulation occurred.  The outrage that follows market reversions is symbolic only of the willful blindness by investors caused by greed.  Someday we will learn the simple truth that, despite our best efforts, market and economic cycles can only be momentarily manipulated and not repealed and the end result will always be the same.  This time will be no different.

See the original article >>

Follow Us