Saturday, May 25, 2013

What If Stocks, Bonds and Housing All Go Down Together?

by Charles Hugh-Smith

About the claim that central banks will never let asset bubbles pop ever again--their track record of permanently inflating asset bubbles leaves much to be desired.


The problem with trying to solve all our structural problems by injecting "free money" liquidity into financial Elites is that all the money sloshing around seeks a high-yield home, and in doing so it inflates bubbles that inevitably pop with devastating consequences.


As noted yesterday, the Grand Narrative of the U.S. economy is a global empire that has substituted financialization for sustainable economic expansion. In shorthand, those people with access to near-zero-cost central bank-issued credit can take advantage of the many asset bubbles financialization inflates.

Those people who do not have capital or access to credit become poorer. That is the harsh reality of neofeudal, neocolonial financialization. Neofeudalism and the Neocolonial-Financialization Model (May 24, 2012).

Injecting liquidity by creating credit and central bank cash out of thin air is not a helicopter drop of money into the economy--it is a flood of money delivered to the banks and financial elites. The elites at the top of the neofeudal financialization machine already have immense wealth, and so they have no purpose for all the credit gifted to them by the central banks except to speculate with it, chasing yields, carry trades and nascent bubbles (get in early and dump near the top).

Life is good for the kleptocratic financial Aristocracy: for debt-serfs, not so good.

No wonder the art market and super-luxury auto sales have both exploded higher. Thanks to the central banks' liquidity largesse, the supremely wealthy literally have so much money and credit they don't know what to do with it all.

If you want to borrow money to attend college, the government-controlled interest rate is 9%. If you want to speculate in the yen carry trade or buy 10,000 houses, the rate is near-zero or at worst, the rate of inflation (around 2% to 3%). If you want to borrow money for anything other than a socialized mortgage to buy a single-family home, tough luck, you don't qualify. But if you want to speculate with $10 billion--here's the cash, please please please take it off our soft central-banker hands.

If your speculations end badly, then no problem, we transfer the toxic trash heap of debt and phantom assets onto the balance sheet of the central bank or onto the public (government) ledger.

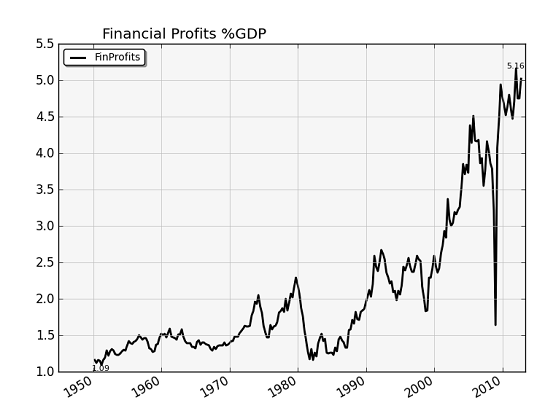
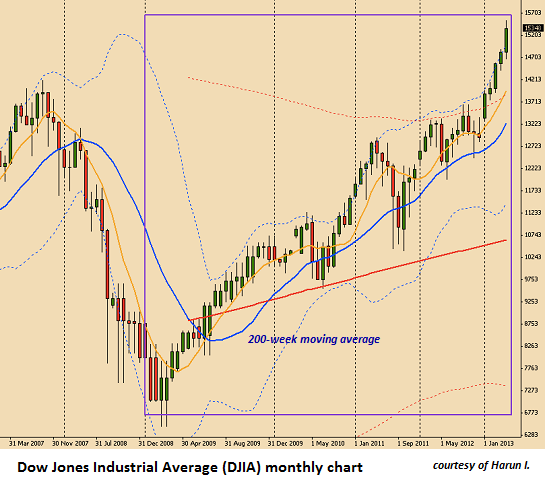
Given this reality, it was inevitable that the stock, bond and housing markets would all be inflated into bubbles by this monumental flood of free money. Please consider these three charts:


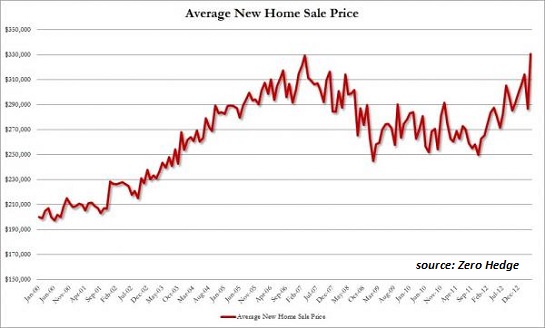
Spot The Bubble: Average New Home Price Soars By Most Ever In One Month To All Time High (Zero Hedge)

Verdict: bubble.


Verdict: bubble.


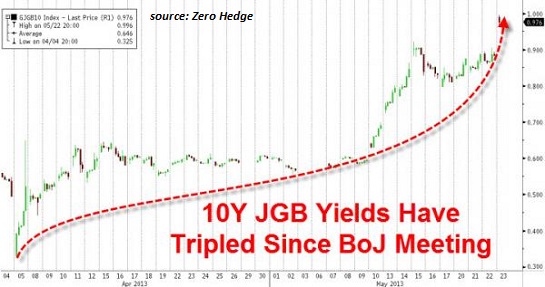
Japanese Bond Market Halted At Open As Bond Selling Purge Goes Global (Zero Hedge)


Verdict: bubble popping.


It is widely accepted as self-evident that all these bubbles will not pop because the central banks won't let them pop. That's nice, but if this were the case, then why did stocks crater in 2000-2001 and 2008-2009, and why did the housing bubble implode in 2008-2011? Did they change their minds for some reason?

No; they assured us right up to the moment of implosion that everything was fine, there was no bubble, etc. The only logical conclusion is that bubbles pop even though central banks resist the popping with all their might.

In the past, central banks were pleased to inflate one bubble at a time, enabling money both smart and dumb to flee one smoking ruin and get busy inflating the next bubble-ready asset class.

But now, thanks to essentially unlimited liquidity and credit, the central banks have inflated three bubbles at the same time: stocks, bonds and housing. That raises an interesting question: what if all these bubbles pop in unison? Will the central banks be able to place a bid under all three markets simultaneously? If so, where will all that freed-up cash go next?

One possibility is gold, another is commodities such as grain and oil. The latter is especially interesting, because central banks and governments hate energy speculators with special intensity because the "Brent vigilantes" have the power to boost inflation where it matters, i.e. energy.

Once energy takes off in a speculative bubble, the rising cost of energy sucker-punches the already-anemic global recovery, and the responsibility eventually lands on the laps of the central banks who created all the bubbles. Their quantitative easing policies discredited, the central banks will have to restrain their liquidity hand-outs, and that will undermine what's left of the various speculative bubbles they've blown.

Those who argue bubbles won't be allowed to pop ever again should look at history from 1999 to the present again.

See the original article >>

The Week Ahead: Should You Listen to the Fed Whisperers?

by Tom Aspray

The world markets had the widest ranges last week that we have seen in quite a while. An increase in volatility is often seen prior to a more extended correction. It was a plus that the major averages, especially the stock index futures, closed last week above the prior week’s lows.

Many of the averages did form daily key reversals on Wednesday, but they have short-term significance when not accompanied by other technical negatives. As I discussed a few weeks ago, a sharply lower weekly close is often the first sign that a top is being formed.

The German Dax closed the week down just over 1%, even though the country’s latest reading on business confidence was the best in several months. And though many of the US averages closed the week over 1% lower, the recent highs were confirmed by both the weekly and daily technical studies. This suggests that at worst, we are in the early phases of the top-building process.

The market’s problems started Wednesday, as the comparison of Ben Bernanke’s comments with the FOMC minutes that had just been released spooked investors. The concern that Fed’s bond-buying program might end earlier was the reason to sell.

The competition to outdo one another on the various financial networks is fierce, but I would recommend that investors not pay attention to these Fed whisperers. Keeping an eye on what the weekly and monthly market data will be much more illuminating, as major trend changes show up on the technical side well ahead of the fundamentals. For instance, the homebuilders completed their major head-and-shoulders top formation in 2006, well before the housing market collapsed.

chart
Click to Enlarge

Global rates moved higher last week, but interestingly, the increases were the most pronounced in the bonds of the strongest countries, the US and Germany. The uptrends in the yields of the German ten-year Bunds and the US ten-year T-Notes (line a) shows a sharp increase since the start of May.

In contrast, the yields on the Italian ten-year bond have just risen slightly (line b). Rates on Greece’s ten-year are still basically in a downtrend (line c), but have fallen from the extremely high yields of a year ago.

Also, a gradual increase in rates is not always a negative for the stock market. It could encourage some bondholders to shift from bonds to stocks.

On Monday, I will be releasing a special report discussing my outlook for US rates. The recent increase in both long- and short-term yields has brought them to levels where they are close to completing weekly bottom formations. One should keep in mind that it would take much higher yields to reverse the major downtrend.

Over the past few weeks, in columns like Put the Odds in Your Favor Now, I have been advocating raising cash and taking profits. The percentage of cash in the Charts in Play Portfolio has increased significantly in the past two months.

The next few weeks are likely to be equally difficult as a fewer number of stocks will be able to go up significantly if the overall market does correct more sharply.

The Performance chart below shows that stocks have been the only game in town in 2013, as the SPY is up 15.6%, while bonds as represented by the iShares Barclays 20+ Year Treasury Bond (TLT) are down about 3.4%. Emerging markets, represented by Vanguard FTSE Emerging Markets ETF (VWO), have lost just over 4% so far this year.

chart
Click to Enlarge

Of course, the Spyder Gold Trust (GLD) has been the real casualty, having lost over 17% so far this year. It is now retesting the lows from the middle of April. And silver has been getting even more press as prices have realty crashed.

Over the past two weeks, economic data has generally been quite good. The consumer sentiment data released on March 17 was much stronger than expected, as it jumped to 83.7, up from 76.4 the prior month.

chart
Click to Enlarge

Last week, existing home sales and new home sales were both better than expected. Durable goods were also well above expectations. The data on manufacturing was also encouraging, as the flash PMI Manufacturing Index and the Kansas City Fed Manufacturing Index both reflected steady growth.

This week, we get a host of new data, which should help investors get a better reading on the economy. After the long weekend, we get the S&P Case-Shiller Housing Price Index and consumer confidence numbers on Tuesday. Also, we get more data on manufacturing from both the Richmond and Dallas Fed surveys.

The declining jobless claims have been a strong positive factor for the market, and we get the next reading on Thursday, along with the first revision of first-quarter GDP. Friday brings the personal income and outlays data, Chicago PMI, and the final monthly reading for May on consumer sentiment from the University of Michigan.

What to Watch
From May 14, prices accelerated to the upside until Wednesday’s reversal, which must have really punished some of the perennial bears who never thought the S&P 500 would get to even 1,600 or 1,625.

Friday’s close was mixed. The Dow finished up, while the S&P 500 and Nasdaq were down slightly. All were sharply lower in early trading, just like Thursday. The market’s resilience is impressive, and is a positive sign for next week’s trading.

They market’s outlook is still bullish, despite last week’s losses, and we still do not have firm sell signals from either the daily or weekly technical studies. On May 15, a total of 517 stocks made new highs on the NYSE, which is consistent with a positive major trend.

Though this was not mentioned in Thursday’s column, 3 Reasons to Avoid Panic Selling, it was another good reason to stick with your plan and the stops that you worked out before the reversal.

At Thursday’s low of 1,636, the S&P 500 was already 3% below Wednesday’s highs. I would not be surprised to see prices get back toward these highs in the next week or two, but given the nature of Wednesday’s reversal, they may not be exceeded.

Bullish sentiment of individual investors jumped again last week, according to AAII, as 49% are now bullish, up from 38.5% the previous week. Only 21% are bearish now, which is the lowest reading so far in 2013. This number will likely jump this week.

See the original article >>

Follow Us