Monday, September 22, 2014
Low Oil Prices: Sign of a Debt Bubble Collapse, Leading to the End of Oil Supply?
by Gail Tverberg
Oil and other commodity prices have recently been dropping. Is this good news, or bad?
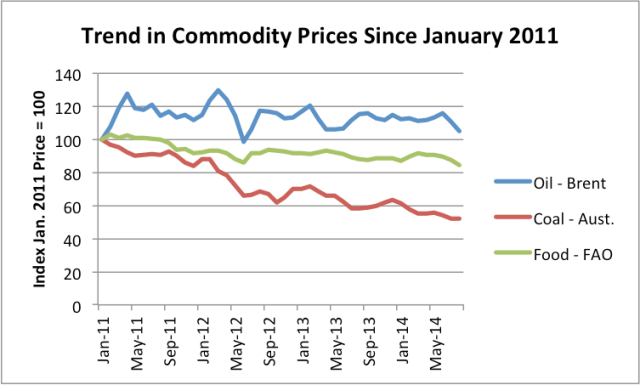
Figure 1. Trend in Commodity Prices since January 2011. Brent spot oil price from EIA; Australian Coal from World Bank Prink Sheet; Food from UN’s FAO.
I would argue that falling commodity prices are bad news. It likely means that the debt bubble which has been holding up the world economy for a very long–since World War II, at least–is failing to expand sufficiently. If the debt bubble collapses, we will be in huge difficulty.
Many people have the impression that falling oil prices mean that the cost of production is falling, and thus that the feared “peak oil” is far in the distance. This is not the correct interpretation, especially when many types of commodities are decreasing in price at the same time. When prices are set in a world market, the big issue is affordability. Even if food, oil and coal are close to necessities, consumers can’t pay more than they can afford.
A person can tell from Figure 1 that since the first part of 2011, the prices of Brent oil, Australian coal, and food have been trending downward. This drop in prices continues into September. For example, as I write this, Brent oil price is $97.70, while the average price for the latest month shown (August) is $105.27. It is this steeper, recent drop, which many are concerned about.
We are dealing with several confusing issues. Let me try to explain some of them.
Issue #1: Over the short term, commodity prices don’t reflect the cost of extraction; they reflect what buyers can afford.
Oil prices are set on a worldwide basis. The cost of extraction varies around the world. So it is clear that oil prices will not match the cost of extraction, or the cost of extraction plus a reasonable profit, for any particular producer.
If oil prices drop, there is a temptation to believe that this is because the cost of production has dropped. Over a long enough period, a drop in the cost of production might be expected to lead to lower oil prices. But we know that many oil producers are finding current oil prices too low. For example, the Wall Street Journal recently reported, “Royal Dutch Shell CEO: Can’t deny returns are too low. Ben van Beurden prepared to shrink company in order to boost returns, profitability.” I wrote about this issue in my post, Beginning of the End? Oil Companies Cut Back on Spending.
In the short term, low prices are likely to signal that less of the commodity can be sold on the world market. Commodities such as oil and food are very desirable products. Why would less be needed? The issue, unfortunately, is affordability. Affordability depends largely on (1) wages and (2) debt. Wages tend to be fairly stable. The likely culprit, if affordability is leading to lower demand for desirable products like oil and food, is less growth in debt.
Issue #2: Economic growth tends to produce a debt bubble.
Many economists believe that technological innovation is the key to economic growth. In my view, economies need a combination of the following to have economic growth of the type experienced in the last 100 years:1
(Increase in debt) + (cheap-to-extract fossil fuels) + (cheap-to-use non-fossil fuel resources) + (technological innovation)
In such a case, debt keeps increasing as an economy grows. Unfortunately, this economic growth is only temporary, because resources tend to become more expensive to use over time, making the “cheap” resources required for economic growth disappear.
The problem underlying the rising cost of resources (both for fossil fuels and others) is that we tend to use the cheapest-to-extract resources first. Technological innovation continues to occur, but as diminishing returns hit both fossil fuels and other resources, there are larger and larger demands on technology to keep costs in line with what workers can afford. Eventually, the cost of resources (net of technological improvements) rises too much, and economic growth is cut off. By this time, a huge mountain of debt has been built up.
Let me explain further how this happens. Without fossil fuels, the world is pretty much stuck with the goods that can be made with wood, or from other basic resources such as animal skins, cotton, flax, or clay. A small quantity of metal and glass goods can be made, but deforestation quickly becomes a problem if an attempt is made to “scale up” the quantity of goods that require heat in their production.2
Once inexpensive coal became available, its availability opened the door to technological innovation, because it provided heat in quantity that had not been available previously. While ideas such as the steam engine had been around for a long time, the availability of inexpensive coal made the production of metals needed for the steam engine, plus train tracks and railroad cars, available at reasonable cost.
With the ability to make steel and concrete in quantity (both requiring heat) came the ability to make hydroelectric dams and electrical transmission lines, thus enabling electricity for public consumption. Oil, as a liquid fuel, paved the way for widespread use of additional innovations, such as private passenger automobiles, mechanized farm equipment, and airplanes. Between coal and oil, many workers could leave farming and begin jobs in other sectors of the economy.
The transformation that took place was huge: from wooden tools and human or animal labor to a modern industrial society. How could such a big change take place? Before the change, the ability to generate a profit that might be used for future capital investment was very limited. Also, the would-be purchasers of products made in an industrial economy were very poor. I would argue that the only way of bridging this gap was debt. See my earlier posts, Why Malthus Got His Forecast Wrong and The United States’ 65-Year Debt Bubble.
The use of debt has several advantages:
- It allows the consumer to buy the end product made with the new resources, assuming the end product isn’t too expensive relative to the consumer’s earnings.
- It gives resource-extracting businesses the money they need to buy equipment and to hire workers, prior to the time they have earned profits from resource extraction.
- It gives the companies the ability to build factories, before they have accumulated profits to pay for the factories.
- It allows governments to fund needed infrastructure, such as roads and bridges, before having the tax revenue available to pay for such infrastructure.
- Most importantly, the “demand” generated by (1), (2), (3) and (4) raises the price of resources sufficiently that it makes it profitable for companies in the business to extract those resources.
Because of these issues, debt and cheap fossil fuels have a symbiotic relationship.
(1) The combination of debt, inexpensive fossil fuels, and inexpensive resources of other kinds allows the production of affordable goods that raise the standard of living of those using them. The result is what we think of as “economic growth.”
(2) The economic growth provides the additional income needed to pay back the debt with interest. The way this happens is indirectly, through what is sometimes described as “greater productivity of workers.” This greater productivity is really human productivity enhanced with devices made possible by fossil fuels, such as sewing machines, electric milking machines, and computers that allow workers to become more productive. Indirectly, the higher productivity of workers benefits both businesses and governments, through higher sales of goods to consumers and through higher taxes. In this way, businesses and governments can also repay debt with interest.
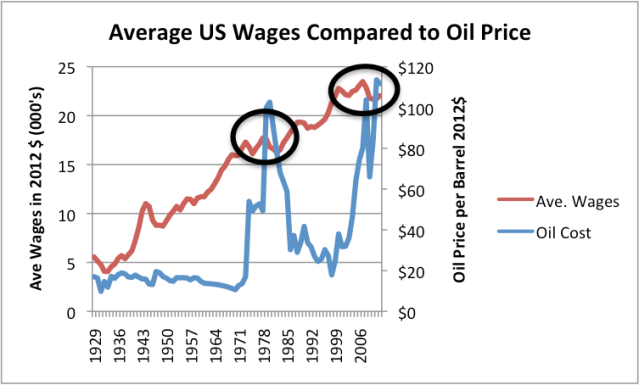
Higher-priced resources are a problem. Higher-priced resources of any kind tend to “gum up the works” of this payback cycle. Higher-priced oil in particular is a problem. In the United States, when oil prices rise above about $40 or $50 barrel, growth in wages stops.
Figure 2. Average wages in 2012$ compared to Brent oil price, also in 2012$. Average wages are total wages based on BEA data adjusted by the CPI-Urban, divided total population. Thus, they reflect changes in the proportion of population employed as well as wage levels.
With higher oil prices, the rise in the standard of living stops for most workers, and good-paying jobs become difficult to find. There are a couple of reasons we would expect wages to stagnate with higher oil prices:
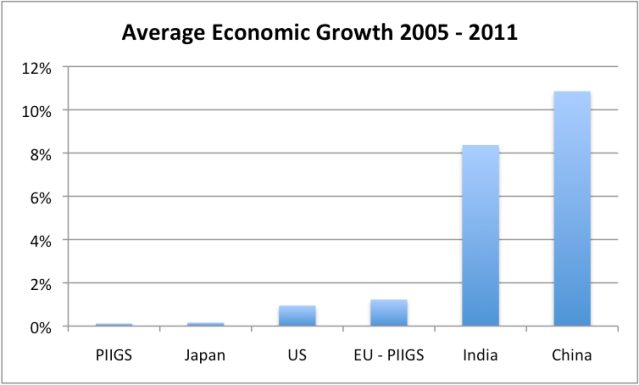
(1) Competition with cheaper energy sources. When oil prices rose, countries using a very high percentage of oil in their energy mix (such as the PIIGS in Europe, Japan, and United States) became less competitive in the world economy. They tended to fall behind China and India, countries that use much more coal (which is cheaper) in their energy mix.
Figure 3. Average percent growth in real GDP between 2005 and 2011, based on USDA GDP data in 2005 US$.
(2) Need to keep the price of goods flat. Businesses need to keep the total price of their products close to “flat” despite rising oil prices, if they are to continue to sell as much of their product after the oil price increase as previously. Oil is one major cost of production; wages are another. An obvious way to offset rising oil prices is to reduce wages. This can be done in several ways: outsourcing work to a lower cost country, greater automation, or caps on wages. Any of these approaches will tend to produce the flattening in wages observed in Figure 2.
Based on Figure 2, an oil price above $40 or $50 per barrel seems to put a cap on wages, and indirectly leads to much less economic growth. Even if we didn’t hit this oil price limit–for example, if we had discovered a liquid fuel that could be produced in quantity for less than $40 barrel–we would eventually hit some kind of growth limit. For example, the limit might be climate change or too much population for food production capability. Even too much debt can be a limit, if citizens’ incomes don’t rise in a corresponding manner. At some point, it becomes impossible even to make interest payments if the debt level is too high. Indirectly, citizens wages even support business and government debt, because business revenues and tax revenues depend indirectly on wages.
Issue #3: Repaying debt is very difficult in a flat or declining economy.
Once growth stops (or slows down too much), the debt bubble tends to crash, because it is much more difficult to repay debt with interest in a shrinking economy than in a growing one.
Figure 4. Repaying loans is easy in a growing economy, but much more difficult in a shrinking economy.
The government can hide this issue for a very long time by rolling over old debt with new debt and by reducing interest rates to practically zero. At some point, however, the system seems certain to fail.
Not all debt is equivalent. Debt that simply blows bubbles in stock market prices has little impact on commodity prices. In order to keep commodity prices high enough for producers to want to continue to produce them, the debt really has to get back into the hands of the potential buyers of the commodities.
Also, any changes that tend to reduce world trade push the world economy toward contraction, and make it harder to repay debt with interest. Thus, sanctions against Russia, and Russia’s sanctions against the US and Europe, tend to push the world toward debt collapse more quickly.
Issue #4: Rising oil and other commodity prices are a problem, especially for countries that are importers of those commodities.
Most of us are already aware of this issue. If oil prices rise, or if food prices rise, our salaries do not rise by a corresponding amount. We end up cutting back on discretionary purchases. This cutback in discretionary purchases leads to layoffs in these sectors. We end up with the scenario we had in the 2007-2009 recession: falling home prices (since higher-priced homes are discretionary purchases), failing banks, and many without jobs. See my article Oil Supply Limits and the Continuing Financial Crisis.
The reason that low oil and other commodity prices are welcomed by many people now is because the opposite–high oil and other commodity prices–are so terrible.
Issue #5: Falling oil and other commodity prices are a problem, if the cost of production is not dropping correspondingly.
If commodity prices drop for any reason–even if it is because a debt bubble is popping–it is going to affect how much companies are willing to produce. There is going to be a tendency to cut back in new production. If prices drop too far, it is even possible that some companies will leave the market altogether.
Even if it doesn’t look like a country “needs” the current high oil price, there may still be a problem. Oil exporters depend on the high taxes that they are able to obtain when oil prices are high. If they cannot collect these taxes, they may need to cut back on programs such as food subsidies and new desalination plants. Without these programs, civil disorder may lead to cutbacks in oil production.
Issue #6: The growth in oil sales to China and to other emerging markets has been fueled by debt growth. This debt growth now seems to be stalling.
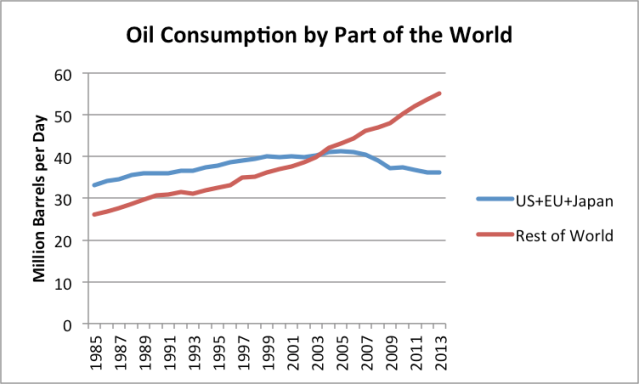
Growth in oil consumption has mostly been outside of the United States, the European Union, and Japan, in the recent past. China and other emerging market countries kept demand for oil high.
Figure 5. Oil consumption by part of the world updated through 2013, based on BP Statistical Review of World Energy 2014 data.
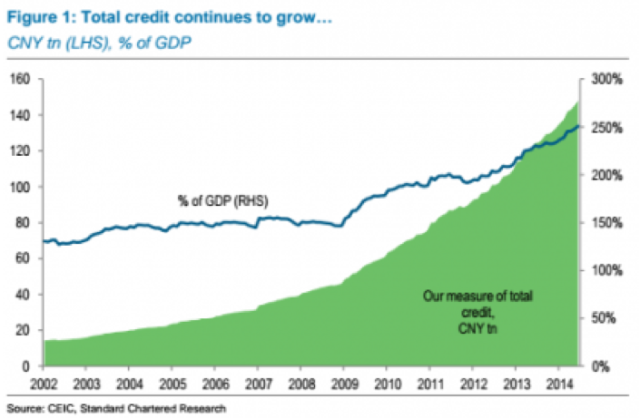
Ambrose Evans-Pritchard reports, China’s terrifying debt ratios poised to breeze past US levels. He shows the following chart of China’s growth in debt from all sources, including shadow banking:
Figure 6. China’s total debt, based on chart displayed in Ambrose Evans-Pritchard article.
This rise in debt now seems to be slowing, based on a Wall Street Journal report. A person wonders whether this stalling debt growth is affecting world oil and other commodity prices.
Figure 7. Figure from WSJ article PBOC Struggles as Chinese Borrowers Hold Back.
Other emerging markets also seem to be experiencing cutbacks. Since 2008, the United States, Europe, and Japan have had very easy money policies. Some of the money available at low interest rates was invested in emerging markets. Now the WSJ reports, Fed Dims Emerging Markets’ Allure. According to the article investors, investors are taking a more cautious stance on new investment because of fear of rising US interest rates.
Of course, other issues affect debt and world commodity demand as well. If interest rates rise, they many have a tendency to shrink new lending, in general, because loans become less affordable. Sanctions of one country against another, such as the US against Russia, and vice versa, also tend to reduce demand.
Issue #7: Debt bubbles have been a problem in past collapses.
According to Jesse Colombo, the Depression was to a significant result the result of debt bubbles that built up during the roaring twenties. Another, longer-term cause would seem to be the loss of farm jobs that occurred when coal allowed tasks that were previously done by farm workers to be done by either electricity or by horses pulling metal plows. The combination of a debt bubble and loss of jobs seems to have parallels to our current situation.
Many believe the subprime housing bubble crash contributed to the Great Recession. The oil price spike of 2007 and 2008 played a major role as well.
Issue #8: If we are facing the collapse of a debt bubble, it is quite possible that prices of many commodities will fall. This could possibly lead to a collapse in the supply of many types of energy products, more or less simultaneously.
Figure 8, shown below, is a very rough estimate of the kind of decline in energy use we could be facing if a debt collapse leads to very low prices of many types of fuels simultaneously. Prices of many commodities crashed in 2008, and it was only with massive intervention that prices were propped up to 2011 levels. After the beginning of 2011, prices began sinking again, as shown in Figure 1.
Figure 8. Estimate of future energy production by author. Historical data based on BP adjusted to IEA groupings.
Clearly governments will try to prevent another sharp crash in commodity prices. The question is whether they will be successful in propping up commodity prices, and for how long they will be successful. In a finite world, fossil fuel energy production eventually must decline, but we don’t know over precisely what timeframe.
Issue #9: My steep decline contrasts with the “best case” forecast of future oil consumption given by M. King Hubbert.
M. King Hubbert wrote about a scenario where another type of fuel completely takes over, before oil and other fossil fuels are phased out. He even discusses the possibility of making liquid fuels using very cheap nuclear energy. The way he represents the situation is the following:
Figure 9. Figure from Hubbert’s 1956 paper, Nuclear Energy and the Fossil Fuels.
In such a scenario, it is possible that oil supply will begin to decline when approximately 50% of resources are exhausted, and the down slope of the curve will follow a symmetric “Hubbert curve.” This situation seems to represent a best possible case; it doesn’t seem to represent the case we are facing today. If a debt collapse occurs, much of the remaining fuel is likely to stay in the ground.
Issue #10: Our economy is a networked system. Increasing debt is what keeps the economy inflated. If wages fail to keep pace with debt growth, the system seems likely to eventually crash.
In previous posts, I have represented the economy as a self-organized networked system, consisting of businesses, consumers, governments (with laws, regulations, and taxes), financial system, and international trade.
Figure 10. Dome constructed using Leonardo Sticks
One reason the economy is represented as hollow is because the economy loses its capability to make goods that are no longer needed–such as buggy whips and rotary dial phones. Another reason why it might be represented as hollow is because debt is used to “puff it up” to its current size. Once the amount of debt starts shrinking, it makes it very difficult for the economy to maintain its stability.
Many “peak oilers” believe that if we have a problem with the financial system, all we have to do is start over with a new one–perhaps without debt. Everything I can see says that debt is an essential part of the current system. We could not extract fossil fuels in any significant quantity, without an ever-rising quantity of debt. The problem we are encountering now is that once resource costs get too high, the debt-based system no longer works. A new debt-based financial system likely won’t work any better than the old one.
If we try to build a new system without fossil fuels, we will be really starting over, because even today’s “renewables” are part of the fossil fuel system.3 We will have to go back to things that can be made directly from wood and other natural products without large amounts of heat, to have truly renewable resources.
Notes:
[1] This is really a simplification of the real issues. As world population grows, it is necessary to obtain an increasing amount of food from the same arable land. Thus, it is necessary to find new processes to increase food production, at the same time that soil is quite possibly degrading. Soil is in a sense a “resource other than fossil fuels,” but I have not mentioned this issue specifically.
Growing pollution problems are in some sense an indirect cost of extracting fossil fuels and other resources. These represent another growing cost that I have not specifically identified. Furthermore, there are indirect expenses that do not fit neatly into any category, such as required desalination plants to handle growing populations in areas where water is scarce. We may need to consider mitigation expenses of all types as part of the “cost of resource extraction.”
My point is that it becomes increasingly difficult to offset these many cost increases with technological innovations. Furthermore, if no changes are made, a larger and larger share of both the workforce and resources are required for maintaining the status quo, leaving fewer workers and a smaller quantity of resources to “grow” the economy.
[2] Wind and water are additional sources of energy, but they are sources of mechanical energy, not heat energy, so are not helpful unless they can be converted first to electricity, and then to heat. In quantity, they never were very large in pre-fossil fuel days.
Figure 11. Annual energy consumption per head (megajoules) in England and Wales 1561-70 to 1850-9 and in Italy 1861-70. Figure by Tony Wrigley from Opening Pandora’s Box. Figure originally from Energy and the English Industrial Revolution, also by Tony Wrigley.
[3] Of course, any existing “renewable” will continue to work until it needs repairs that are unavailable. Other parts of the system (such as electric transmission lines, batteries, inverters, and attached devices such as pumps) may fail more quickly than the renewables themselves.
The Counter-Intuitive Rise of the U.S. Dollar
by Charles Hugh Smith
As things get dicier globally, assets in periphery nations typically get dumped as mobile capital flees risk and migrates to lower risk core nations and currencies.
I received many thoughtful comments on Why the Dollar May Remain Strong For Longer Than We Think. Given the many weaknesses of the U.S.--ballooning social-welfare and crony-capitalist liabilities, free money for financiers monetary policies, etc.--a strengthening dollar (USD) strikes many as counter-intuitive.
The dynamic complexities of fiscal and monetary policies, global capital flows and the foreign exchange (FX) market complicate any inquiry, so I try to keep it simple.
In my view, the USD serves both transactional (global trade) markets and the global need for currency reserves (i.e. as a store-of-value). Sorting out the various influences on its relative value in each capacity is complex enough, but there is also the X Factor--the hard-to-quantify components of any currency's relative value.
For the USD, the X Factor is hegemony, which includes financial dominance based on debt issued/denominated in USD and what might be called the real-world assets of the issuing nation: that nation's food, energy and water security (what I call the FEW resources), its proximity to potential enemies, its external environmental costs, its overseas financial assets, the strength of its legal system in protecting private assets,its demographic profile and of course its ability to project power to defend its interests.
By these basic measures, the U.S. scores pretty well. We can get some perspective on this by putting ourselves in the shoes of wealthy people in periphery nations where the risks of capital controls, currency devaluation, etc. are perceived to be high, or in the shoes of corrupt elites in countries where they fear their ill-gotten gains might not survive blowback (hence the almost universal desire of elites to leave China with their loot).
The strength of the USD is attractive to at-risk capital, even if transferring at-risk wealth into dollars requires a significant foreign-exchange haircut. Better to preserve 75% of your wealth in USD than leave it exposed to confiscation, capital control, etc. This is the basic flight-to-safety mechanism.
Ubiquity also counts. The USD is the proxy global currency. A $100 USD bill is recognized as money virtually everywhere. If you're stranded just about anywhere, USD will buy you food, transport, official "assistance" via bribes, etc. No other paper currency is even close to ubiquity/recognition. (Clean, crisp $100 USD bills are recommended--dirty crumpled bills are not highly esteemed.)
It's also critical to look at the relative scale of the money-printing that erodes the value of currencies: -China's credit expansion is much larger as a percentage of its economy and financial system than the Fed's money-printing as a percentage of the U.S. financial system.
Then there's the scramble-for-yield issue: imagine you're managing $10 billion. You need to preserve this wealth but you also need to earn a yield, or you'll be fired at the end of the quarter. Since FX (foreign exchange) is a much larger market than stocks or bonds, you're highly attuned to FX so you don't get blindsided by a shift in FX that wipes out your yield. You might wisely build an "insurance" position in precious metals, but because you need yield then you have exposure to bonds, stocks and as a result, FX.
As things get dicier globally, assets in periphery nations typically get dumped as mobile capital flees risk and migrates to lower risk core nations and currencies.
For money managers, the USD is an FX safe haven--especially since the capital flowing out of the riskier periphery pushes the USD higher. This makes for a secondary yield--as the USD rises, any asset denominated in USD will gain in relative value. So there's a self-reinforcing feedback loop: as the USD value rises, it attracts more of the money fleeing risk.
In a way, the USD acts as a currency equivalent of the English language. There are many languages and many currencies, but at present the indispensable language/currency in the global economy is English/USD.
How can we summarize this discussion?
1. FX is the "master market" of the global financial system.
2. The flow of mobile capital out of the periphery into the core will turn into a flood as global risks rise.
Both of these conditions favor the USD.
Time for a contrarian view: Eurozone's economy is turning the corner
by Sober Look
The take-up of the ECB's TLTRO program announced back in June was materially lower than expected. About €83bn worth of cheap long-dated loans was picked up by the area's banking system. Many had expected €150bn and even greater. Part of the reason is that banks that are not quite ready to deploy the funds don't want to sit on cash with negative rates. As a result some have concluded that the Eurozone's credit contraction will worsen from here and economic conditions will deteriorate further.
As views of doom and gloom envelop the Eurozone, it may be time time for a contrarian view: the euro area's economy is turning the corner. Yes, it's difficult to imagine such a thing and we are sure to get numerous angry emails and comments. Ultimately it's about the data.
First of all we start with the Eurozone's inflation expectations which continue to fall. That combined with a weaker than expected TLTRO take-up will keep the ECB highly active in its easing efforts, potentially even considering QE.
Market-implied inflation expectations 5 years out (source: DB)
It's important to keep in mind that the ECB is trying to replace at least in part the 3yr LTRO and MRO loans that banks have been repaying. These repayments have resulted in an unprecedented reduction in the central bank (Eurosystem) balance sheet since the beginning of last year.
Eurosystem (central bank) balance sheet (source: ECB)
Without a strong take-up in the TLTRO, the ECB will consider other options to expand the balance sheet. The planned ABS purchases will hardly make a dent because the new Basel Accord has all but destroyed that market. Therefore there will be pressure on the ECB to do something else in order to stem the decline in its balance sheet. Plus we are already seeing EU institutions calling on the BIS to loosen regulatory capital rules for structured credit issuance. All of this is positive for the Eurozone banks and will likely expand liquidity in the system. That's in part why we've had a nice pop in euro area bank shares recently.
FTSEurofirst 300 Banks Index Index Price (source: MarketWatch)
Interestingly, a number of analysts have been pointing out that the Eurozone bank deleveraging is over. Credit contraction in the area is ending. One can see glimpses of this in the area's money supply measures which have stabilized recently.
Euro area M3 money supply (source: ECB)
To some extent Mario Draghi has already generated some degree of stimulus for the area's economy by repricing the euro (via negative domestic deposit rates). This is a gift for German and other exporters who can now more effectively compete on the international markets.
EUR/USD (source: TradingView)
We may already be witnessing the impact of weaker euro, as German trade balance jumped recently, resulting in better than expected German industrial production report.
Source: Investing.com
Improved German exports (see chart) combined with several other factors have resulted in higher than expected growth in industrial production for the Eurozone as a whole.
Source: Investing.com
There is no question that the Eurozone's economy continues to struggle. Issues such as the recession in Italy, manufacturing stagnation in France, and massive unemployment across the area are not going away anytime soon. China's economy and the situation in Ukraine continue to pose risks. Surveys still show worsening business and consumer sentiment. But the expectations around the area's performance have been so bad lately, surprises to the upside are increasingly likely (see example). The ECB's aggressive easing stance as well as stronger trade and industrial activity data tell us that for now the worst of the euro area slowdown may be over.

