Wednesday, July 3, 2013

Euro drops amid debt-crisis speculation

By Joseph Ciolli and Lukanyo Mnyanda

The euro fell the most in two weeks against the yen as Portugal’s bonds slumped after two ministers resigned from the government, reigniting speculation Europe’s sovereign-debt crisis is worsening.

The Japanese currency climbed against all of its 16 most- traded peers as borrowing costs also increased in Spain and Italy and a drop in risk appetite boosted demand for the yen as a haven. The pound rose after U.K. services expanded. The dollar remained lower versus the yen after U.S. companies boosted employment more than forecast.

“Any time you have any sort of political uncertainty or anything that’s going to disrupt political stability, it’s going to be risk-off for the underlying currency,” said Eric Viloria, senior currency strategist at Gain Capital Group LLC in New York, in a phone interview. “That’s weighing on the euro.”

The 17-nation currency fell as much as 1.5% to 128.65 yen, the biggest intraday decline since June 14, before trading at 129.35 at 9:51 a.m. in New York, down 1%. The euro lost less than 0.1% to $1.2974 after sliding 0.4% earlier. The yen gained 0.9% to 99.70 per dollar.

The pound jumped the most in four weeks versus the dollar after a report showed U.K. services growth accelerated in June, adding to evidence the economic recovery is gaining strength.

Britain’s currency advanced against all of its major peers except the yen as reports this week showed manufacturing grew at the fastest in more than two years last month and construction expanded. Mark Carney began as governor of the Bank of England on July 1 and will announce his first policy decision tomorrow.

‘Positive Surprise’

“The numbers were a positive surprise, and the pound is showing some strength,” said Lutz Karpowitz, a senior currency strategist at Commerzbank AG in Frankfurt. “These are levels at which you don’t talk about a weak economy anymore.”

Sterling rose 0.7% to $1.5257 and gained 0.7% to 85.01 pence per euro.

Portugal’s 10-year bond yield jumped above 8% for the first time since November after Prime Minister Pedro Passos Coelho told voters in a televised speech from Lisbon yesterday he’s trying to hold his government together.

Portuguese Foreign Affairs Minister Paulo Portas, leader of junior coalition party CDS, quit yesterday in protest at the government’s budget policy. Portas was the second minister to resign this week after finance chief Vitor Gaspar stepped down, saying his credibility had been compromised by the government’s failure to meet budget targets set by the European Union.

‘Political Concerns’

“The euro is being driven by the headlines coming out of Portugal,” said Paul Robson, a senior currency strategist at Royal Bank of Scotland Group Plc in London. “In the past, markets have penalized currencies where you’ve got political concerns and a weak political backdrop. There’s been a lot of complacency about the euro-area periphery in general during the liquidity drench.”

The euro also weakened after a report showed services industries in the currency bloc shrank at a faster pace in June than initially estimated. An index based on a survey of purchasing managers was 48.3 last month, Markit Economics said. That’s less than an initial estimate of 48.6 on June 20 and below the level of 50 that divides expansion from contraction.

Europe’s common currency pared a loss against the dollar as initial claims for jobless benefits in the U.S. fell last week and the ADP Research Institute said American companies boosted employment by 188,000 workers in June, exceeding a Bloomberg survey’s forecast of a gain of 160,000.

A Labor Department report on July 5 may show U.S. nonfarm payrolls increased by 165,000 jobs, a Bloomberg survey forecast.

Fed Stimulus

The data are being reported as the Federal Reserve weighs whether labor-market progress is enough to reduce the $85 billion of bonds it buys each month to put downward pressure on borrowing costs and spur growth.

The premium for one-year options granting the right to sell the euro against the dollar relative to those allowing for purchases increased to 1.95 percentage points, the highest since Sept. 12, the 25-delta risk reversal shows.

The euro “remains under pressure,” having dropped back below its 200-day moving average, Karen Jones, a technical strategist at Commerzbank AG in London, wrote today in an e- mailed note to clients.

The shared currency may find support from $1.2931 to $1.2885, she said, referring to a level where buy orders may be clustered. The euro’s 200-day moving average was at $1.3075 today, according to data compiled by Bloomberg.

The euro has still gained 4.6% this year, according to Bloomberg Correlation-Weighted Indexes that track 10 developed-nation currencies. The dollar gained 6.7%, the best performer, and the yen tumbled 8.7%.

Aussie Drops

Australia’s dollar weakened against most major counterparts after central-bank Governor Glenn Stevens said the currency had been too high.

“If the economy needs a lower exchange rate, it will probably get it,” he said in a speech in Brisbane to the Economic Society of Australia.

The Aussie dollar fell 0.9% to 90.65 U.S. cents and reached 90.53 cents, the lowest since September 2010.

Trading in over-the-counter foreign-exchange options totaled $16 billion, compared with $37 billion yesterday, according to data reported by U.S. banks to the Depository Trust Clearing Corp. and tracked by Bloomberg. Volume in options on the dollar-Chinese yuan exchange rate amounted to $3.5 billion, the largest share of trades at 22%. Dollar-yen options totaled $3.2 billion, or 20%.

Dollar-yuan options trading was 5% above the average for the past five Wednesdays at a similar time in the day, according to Bloomberg analysis. Dollar-yen options trading was 4% below average.
See the original article >>

Has the Next Leg Down Begun?

by Graham Summers

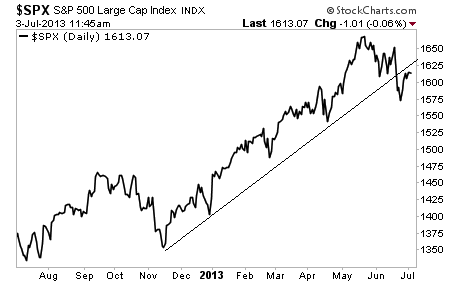
Well we got right to the trendline noted in earlier articles. We’re now beginning to roll over as we predicted.

The number of major problems hitting the system right now is truly staggering. Off the cuff I note:

1)   Egypt falling into governmental collapse and a possible coup.

2)   China entering a liquidity crisis.

3)   Japan’s economy slowing despite record QE.

4)   Multiple indicators flashing “recession” for the US.

5)   Corporate profits falling.

6)   EU back in crisis mode with both Portugal and Greece facing another round of collapse (with Spain and Italy waiting in the wings).

And those are just the major headline grabbing issues. Those banking on the market rallying even harder have got a lot of obstacles to overcome.

See the original article >>

Dow and Gold Silver Ratio Signals Coming Silver Price Rally

By: Hubert_Moolman

The Dow, in particular, has been the biggest obstacle to a rise in precious metals, due to it sucking up most of the available value on global markets. However, it appears that this obstacle is now out of the way, with the Dow likely having peaked.

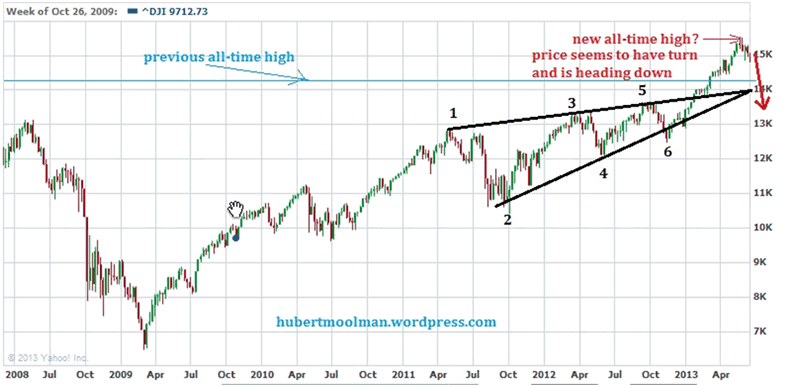
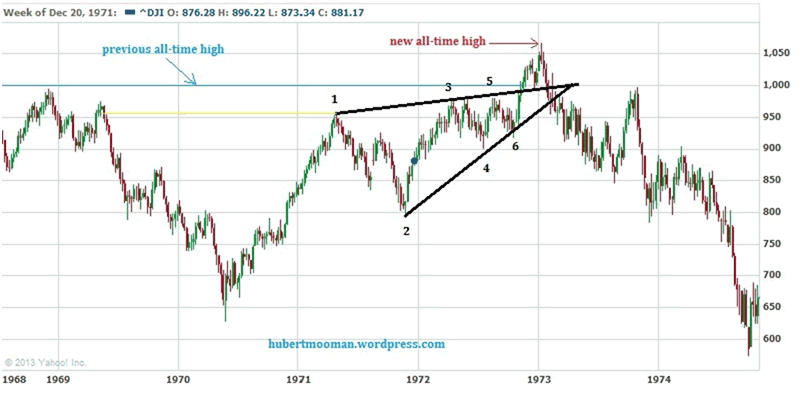
Below, is update of the fractal comparisons between the current period and the 70s, I have done for the Dow in a previous article:

(chart from yahoo)
The top chart is the Dow from 1968 to 1974, and the bottom one is the Dow from 2008 to 14 June 2013. I have illustrated how these patterns are alike by marking similar points from 1 to 6. It appears that there is a very good chance that we have finally reached the peak for the Dow.
This is a good picture of the medium-term situation that the Dow finds itself – right before a major decline just like in 1973. In 1973, soon after the Dow peaked, gold and silver started a massive rally; therefore, it appears that then, the Dow was also an obstacle preventing a silver and gold rally. This is, therefore, an indicator that we could be close to a major spike in gold and silver, as explained in a previous article.
Gold/Silver Ratio
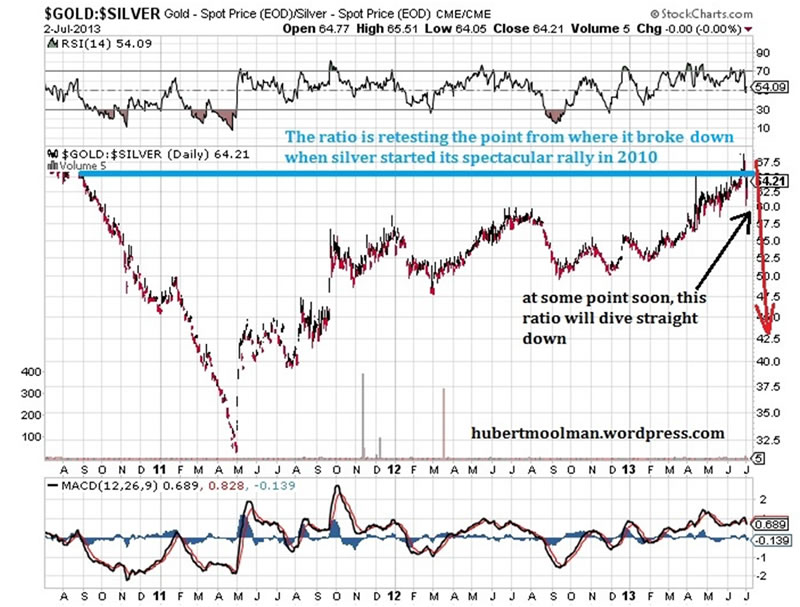
The gold silver ratio is also, showing strong signs that silver and gold is about to spike significantly. Below, is a gold/silver ratio chart from stockcharts.com:

The ratio is currently retesting the area from which it broke down when it started the spectacular rally in 2010. If this area between 67 and 70 holds, then the ratio is likely to fall significantly. Note that this ratio falls significantly mostly when silver and gold is having a rally (with silver outpacing gold of course).
Silver Chart
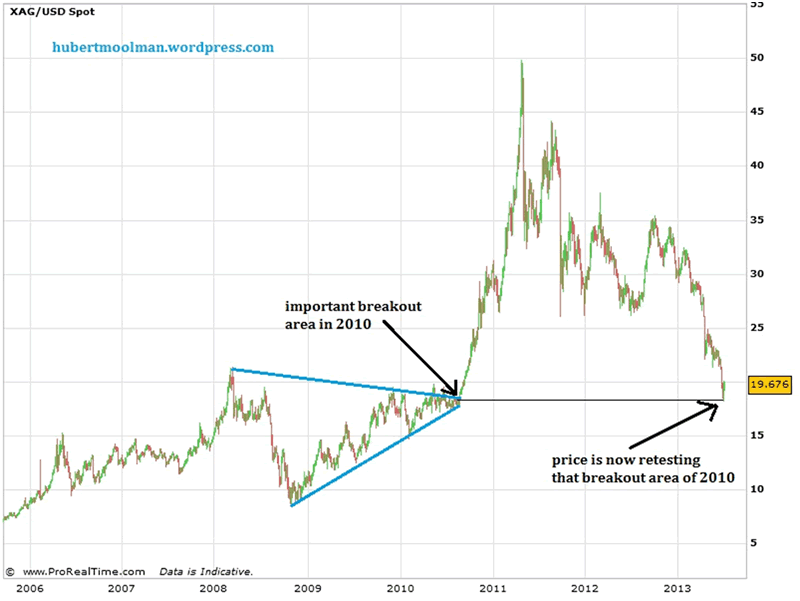
Below, is a silver chart from 2006 to 2013 (generated at fxstreet.com)

Silver is currently retesting its important breakout area of 2010 (similar to the gold/silver ratio). That breakout area of 2010 appears to be a critical area. If this area holds (which is very likely), then silver is likely to start a massive multi-month rally. Additional analysis is contained in my premium service.
Remember that these are massive patterns, so much patience is needed.
Conclusion
It is very unlikely that both the Dow and gold & silver are going to make new significant all-time highs from here. We, therefore, have to decide whether it is equities that will continue a bull market from here, or gold & silver.

See the original article >>

Opportunity Squandered: We Blew It

by Charles Hugh Smith

We are about to reap the consequences of tolerating the perfection of the Savior State / cartel-crony capitalism's neofeudal debtocracy.


We as a nation had an unparalleled, historic opportunity to set things right in the aftermath of the 2008 financial meltdown. Alas, we blew it. Instead of tearing down what had failed spectacularly, we chose to do more of what failed spectacularly: cartel-crony capitalism, centralized wealth and power and an expansion of our financialized debtocracy.

Gordon Long and I discussed this epic miss in Window of Opportunity: Blown!

While it's certainly easy to blame our corrupt, self-serving leadership, we have tolerated their "more of the same." It's been said that a people get the government they can tolerate (as well as the one they deserve), and the American people have tolerated an expansion of everything that is systemically destructive because we dared not risk our share of the Savior State swag.

The joke will be on us, because there won't be any swag when the rotten edifice collapses in a heap. The entire Status Quo response can be summarized thusly: save cartel-crony capitalism and increase central state power by expanding credit and blowing borrowed trillions, i.e. paper over structural flaws with tsunamis of free money and credit.

Let's check in on the effectiveness of the Keynesian Cargo Cult's project of borrowing and blowing trillions: Oops, diminishing returns.

Does this trajectory of federal borrowing look remotely sustainable to you?


The Federal Reserve's number 1 project of bailing out the parasitic financial cartel with trillions of dollars in free credit has also failed spectacularly, as the banks can't find any positive risk/return in loans except those that are guaranteed by the Federal government (FHA, Fannie Mae, etc.)


The Federal Reserve's number 2 project of "saving" cartel-crony capitalism and its captured political class of toadies, apparatchiks and factotums by blowing asset bubbles has succeeded in setting up one violent crash after another. You don't need Technical Analysis 101 to see the megaphone pattern traced out by the three Fed-inflated asset bubbles.

As you no doubt recall, nobody in the Fed, Wall Street or the Savior State saw the inevitable popping of the tech bubble or the housing bubble, and so it is unsurprising that our "leadership" has once again failed to anticipate the endgame of financial bubbles is not "to the moon" but collapse.

"But that can't possibly happen." Yes, we heard that in 1999 and 2006, too. What must happen will happen, and we as a nation are about to reap the consequences of tolerating the perfection of the Savior State / cartel-crony capitalism's neofeudal debtocracy.

See the original article >>

Sugar falls on weaker Brazilian real as harvest delayed

By Jack Scoville

SUGAR 

General Comments: Futures closed lower on a weaker Brazilian Real. Ideas are that mills had not had time to amass more sugar due to a delayed harvest in Brazil because of rains and also because they are concentrating on producing ethanol. Futures might try to work lower this week. There is still talk that a low is forming or has formed for at least the short term, but there is still a lot of Sugar around, and not only from Brazil. The Indian monsoon is off to a good start and this should help with Sugarcane production in the country. But, everyone is more interested in Brazil and what the Sugar market is doing there. Traders remain bearish on ideas of big supplies, especially from Brazil. Traders in Brazil expect big production to continue as the weather is good.

Overnight News: Showers are expected in Brazil, mostly in the south and southwest. Temperatures should average near to above normal.

Chart Trends: Trends in New York are mixed to down with objectives of 1640 and 1580 October. Support is at 1650, 1620, and 1600 October, and resistance is at 1690, 1715, and 1750 October. Trends in London are mixed to down with objectives of 475.00, 465.00, and 448.00 October. Support is at 476.00, 475.00, and 470.00 October, and resistance is at 490.00, 496.00, and 499.00 October.

COTTON

General Comments: Futures were higher after holding support on the charts. It was a low volume session with the holiday this week. Futures held the short term range. It is possible that futures can work lower again as demand has turned soft. Ideas of better production conditions in the US caused some selling interest. Texas is reporting light precipitation, mostly in southern areas. Dry weather is being reported in the Delta and showers and storms are seen in the Southeast. The weather should help support crop development in the Delta and Southeast, and could help in Texas. Weather for Cotton appears good in India, Pakistan, and China.

Overnight News: The Delta should be dry and Southeast will see showers and rains. Temperatures will average near to below normal this week, but near to above normal this weekend. Texas will get a few showers early this week, but will be mostly dry. Temperatures will average near to below normal, but near normal this weekend. The USDA spot price is now 82.55 ct/lb. ICE said that certified Cotton stocks are now 0.623 million bales, from 0.623 million yesterday. ICE said that 145 notices were posted today and that total deliveries are now 2,462 contracts.

Chart Trends: Trends in Cotton are mixed . Support is at 85.10, 84.00, and 82.80 October, with resistance of 86.70, 86.90, and 88.00 October.

FCOJ

General Comments: Futures closed higher in recovery trading. There has been little selling pressure on the market in the last week since the dramatic move lower. Better weather in Florida seems to be the big problem for the bulls at this time. Futures have been working generally lower as showers have been seen and conditions are said to have improved in almost the entire state. Ideas are that the better precipitation will help trees fight the greening disease. No tropical storms are in view to cause any potential damage. Greening disease and what it might mean to production prospects continues to be a primary support item and will be for several years. Temperatures are warm in the state, but there are showers reported. The Valencia harvest is continuing but is almost over. Brazil is seeing near to above normal temperatures and mostly dry weather, but showers are possible later this week.

Overnight News: Florida weather forecasts call for showers. Temperatures will average near to above normal. ICE said that 0 delivery notices were posted today and that total deliveries for the month are now 0 contracts.

Chart Trends: Trends in FCOJ are mixed to down with no objectives. Support is at 130.00, 125.00, and 122.50 September, with resistance at 136.00, 137.50, and 139.00 September.

COFFEE

General Comments: Futures were higher. The cash market remains very quiet. However, roasters are showing more buying interest and it is possible to get some business done. Sellers, including Brazil, are quiet and are waiting for futures to move higher. Buyers are interested on cheap differentials, and might start to force the issue if prices hold and start to move higher in the short term on ideas that the market made a bottom. Brazil weather is forecast to show dry conditions, but no cold weather. There are some forecasts for cold weather to develop in Brazil early next week, but so far the market is not concerned. Current crop development is still good this year in Brazil. Central America crops are seeing good rains now. Colombia is reported to have good conditions.

Overnight News: Certified stocks are lower today and are about 2.745 million bags. The ICO composite price is now 118.77 ct/lb. Brazil should get dry weather except for some showers in the southwest. Temperatures will average near to above normal. Colombia should get scattered showers, and Central America and Mexico should get showers, and rains. Temperatures should average near to above normal. ICE said that 8 delivery notices was posted against July today and that total deliveries for the month are now 807 contracts.

Chart Trends: Trends in New York are down with no objectives. Support is at 117.00, 116.00, and 113.00 September, and resistance is at 125.00, 128.00, and 128.00 September. Trends in London are mixed to up with objectives of 1835 nd 1900 September. Support is at 1755, 1720, and 1705 September, and resistance is at 1855, 1870, and 1900 September. Trends in Sao Paulo are down with no objectives. Support is at 140.00, 137.00, and 134.00 September, and resistance is at 150.00, 151.00, and 155.00 September.

COCOA 

General Comments: Futures closed higher despite ideas of good harvest weather and active movement of beans to ports in western Africa. Internal prices are reported weak in much of Africa. Ideas of weak demand after the recent big rally kept some selling interest around. The weather is good in West Africa, with more moderate temperatures and some rains. It is hotter and drier again in Ivory Coast this week, but the rest of the region is in good condition. Ivory Coast is starting to see showers, but will need more rain soon. The mid crop harvest is about over, and less than expected production along with smaller beans is reported. Malaysia and Indonesia crops appear to be in good condition and weather is called favorable.

Overnight News: Scattered showers are expected in West Africa. Temperatures will average near to above normal. Malaysia and Indonesia should see episodes of isolated showers. Temperatures should average near normal. Brazil will get mostly dry conditions and warm temperatures. ICE certified stocks are lower today at 4.934 million bags. ICE said that 55 delivery notices were posted today and that total deliveries for the month are 349 contracts.

Chart Trends: Trends in New York are mixed. Support is at 2130, 2100, and 2080 September, with resistance at 2190, 2200, and 2230 September. Trends in London are mixed. Support is at 1440, 1420, and 1360 September, with resistance at 1470, 1490, and 1520 September.

See the original article >>

Europe In Turmoil: Spreads Explode On Portulitical Crisis; Egypt Ultimatum Nears

by Tyler Durden

And just like that things are going bump in the night once more. First, as previously reported, the $100+ WTI surge continues on fears over how the Egyptian coup will unfold, now that Mursi has a few short hours left until his army-given ultimatum runs out. But it is Europe where things are crashing fast and furious, with the EURUSD tumbling to under 1.2925 overnight and stocks sliding on renewed political risk, with particular underperformance observed over in Portugal, closely followed by its Iberian neighbor Spain, amid concerns that developments in Portugal, where according to some media reports all CDS-PP ministers will resign forcing early elections, will undermine country's ability to continue implementing the agreed bailout measures. As a result, Portuguese bond yields have spiked higher and the 10y bond yield spread are wider by over a whopping 100bps as austerity's "poster child" has rapidly become Europe's forgotten "dunce." The portu-litical crisis has finally arrived.

Bloomberg has more:

Secretary of State for Treasury Maria Luis Albuquerque replaced Vitor Gaspar at the Ministry of Finance. That prompted Paulo Portas, who leads the smaller CDS party in the coalition government, to quit, saying the new minister would offer “mere continuity” of the country’s deficit-cutting plans.

“It sounds the alarm bell of austerity fatigue,” said David Schnautz, a strategist at Commerzbank AG in New York. “This domestic noise is definitely negative.”

Portugal’s 10-year bond yield jumped to 8 percent earlier today, the highest level since Nov. 27, and was hovering at 7.65 percent as of 11:10 a.m. London time. The nation pays an average 3.2 percent for loans it received as part of the aid package.

Prime Minister Pedro Passos Coelho is battling rising unemployment and a deepening recession as he cuts spending and increases taxes to meet terms of a 78 billion-euro ($101 billion) rescue plan monitored by the European Union, the International Monetary Fund and the European Central Bank, known as the Troika. Coelho announced measures on May 3 intended to generate savings of about 4.8 billion euros through 2015 that include reducing the number of state workers.

The contagion effect has quickly spread to other bond markets and both Italian and Spanish 10% spreads were seen wider by over 10bps. Financials underperformed on the sector breakdown, as fears of potential liquidity squeeze, together with the latest ratings action by S&P who cut Barclays, Deutsche Bank and Credit Suisse rating to A- from A, saw credit spreads widen. iTraxx crossover and sub fin indices widened by over 15bps, while the Eurodollar curve steepened on prospect of higher borrowing costs. In terms of macroeconomic releases this morning, the latest round of Eurozone Services PMIs had little impact on the price action, however the release of much better than expected UK Services PMIs saw GBP/USD break above 1.5200 level. Finally, a weaker than expected Eurozone Service PMI print (48.3, Exp. 48.6, last 48.6, once again driven by a weaker Germany) has certainly not helped matters.

If nothing else, at least Draghi's unused (and non-existent) OMT bazooka will soon have to be used. We will see just how effective it will be.

Looking elsewhere, the army in Egypt has given a deadline of around 1530 London time on Wednesday for the crisis to be dealt with; otherwise the so-called road map will be put forward by the army which included the outline for new presidential elections, the suspension of the new constitution and the dissolution of parliament. However, an Egypt military source denied local media reports on a political road map and instead suggested that next step will be to invite political, social and economic figures to talks on vision of the road map.

A quick summary of the European damage:

  • Portugal 10Y yield up 89bps to 7.61%, was up 130bps at 8.023% earlier
  • Spanish 10Y yield up 14bps to 4.76%
  • Italian 10Y yield up 7bps to 4.51%
  • U.K. 10Y yield down 4bps to 2.34%
  • German 10Y yield down 6bps to 1.64%
  • Bund future up 0.53% to 142.44
  • BTP future down 0.88% to 109.77
  • EUR/USD down 0.13% to $1.2962
  • Dollar Index down 0.15% to 83.42
  • Sterling spot up 0.62% to 1.525
  • 1Y euro cross currency basis swap down 1bp to -18bps
  • Stoxx 600 down 1.21% to 283.67

DB's Jim Reid has the full overnight rundown

The last 12-24 hours have turned into a bit of a round-the-globe Sovereign watch with Brazil, Egypt and Portugal all being highly newsworthy. Starting with Brazil, the BOVESPA (-4.2%) suffered its biggest one-day loss since September 2011, reaching its lowest level since April 2009, after the country reported weaker than expected industrial output data. Industrial production fell 2% mom (vs -1.1% expected) which is the worst result for the month of May since 1995 when industrial output contracted by 11%. As with other EM equities, the BOVESPA had a rough June. The index recorded 7 trading days with falls greater than 2% during the month, which is exactly half the number seen in the whole of 2012. Amongst the individual stock moves yesterday, there were material declines in market
heavyweights including Vale (-3.4%) and Petrobras (-4.8%) which both fell through their 52-week lows. On the credit side, Brazil’s 5yr CDS widened by about 9bp to 195bp. Conditions have also been challenging for Brazil's corporate funding markets with no Brazilian company able to price an international bond since May 15th according to Bloomberg data.

Moving to Portugal, there were signs of austerity fatigue amongst the ruling coalition government after Prime Minister Coelho lost two key ministers in as many days. The resignation of Finance Minister Vitor Gaspar was promptly followed by that of the foreign minister Paulo Portas who is also head of the smaller CDS party in the coalition. Portas reportedly disagreed with the PM’s decision to name Secretary of State for Treasury Maria Luis Albuquerque as a replacement for the FM, saying it would mean a continuation of the policies
deepening the country’s recession (Bloomberg). PM Coelho said he didn’t accept the resignation request and hasn’t asked the President to dismiss Portas due to the minister’s importance in the coalition. Portas did not say whether he would take his junior party out of the government — a step which would leave the government without a parliamentary majority. Portuguese bond yields added 33bp yesterday to 6.72% and are now up more than 140bp since the May lows. The PSI equity index finished 1.3% weaker. Elsewhere in the periphery, Greek 10yr yields jumped by 15bp after it was reported that the troika had given a 3-day ultimatum to the government to reassure international lenders that it can deliver on conditions attached to its bailout programme. The report was later denied by a spokesperson from the European Commission (Ekathimerini).

Speaking of ultimatums, President Mursi appeared on television yesterday to reject an ultimatum from the Egyptian military that he share power with his political opponents or face a military solution. In response, the Egyptian army said it was ready to sacrifice “blood…and its people” which has helped send WTI crude (+2.3% this morning) above the $100/bbl mark. At least one anti-Mursi TV station put up a clock counting down to the end of the military's ultimatum, putting it at 4 p.m. today (or 1400 GMT), though a countdown clock posted online by Mursi opponents put the deadline one hour later. The military did not give a precise hour (Associated Press). WTI has gained 17% since its low in mid-April, more than double an 8% gain in Brent crude over the same period. It will be interesting to see whether this shows up in US inflation numbers in the next few months and whether it impacts growth.

Overnight, Asian stocks are trading with a negative tone taking the lead from the S&P500 which faded into the close for the third consecutive day. Losses are being led by a -1.9% and 1.5% decline in the Hang Seng and Shanghai Composite respectively with the main laggards being Chinese banks and real estate developers. China’s official services PMI came in 0.4pts weaker than last month (53.9 vs 54.3) while the HSBC services PMI was a touch stronger (51.3 vs 51.2). On the fixed income side, Asian credit is trading about 9bp wider this morning but 10yr UST yield remain in a tight range (unchanged at 2.47% as we type). The AUDUSD is down 0.4% after disappointing Australian retail sales data (0.1% vs 0.3%) and comments from the RBA governor that the central bank will do what it reasonably can to assist the transition from a resource-led economy. S&P’s downgrade of several major European investment banking groups is also dampening overnight sentiment.

Looking at today’s calendar, Euroarea service PMIs, the US non-manufacturing ISM and ADP employment report are the three key highlights on the data docket. The last two will provide the final employment-related data points ahead of the looming payroll print on Friday. Specifically on the ADP, DB’s US economists view the ADP as the single best predictor of monthly changes in payrolls. Over the last 12 months, the average error between the difference in private payrolls and ADP has been -14k, which is quite small since the standard error on private payrolls is about 75k per month. US weekly jobless claims have been brought forward to today due to Independence Day holidays tomorrow. So these are going to be important numbers for markets. A reminder that US bond and equity markets will be shutting early today ahead of Independence Day tomorrow.

* * *

SocGen recaps the FX macro highlights

There were further gains in periphery debt prices yesterday resulting in lower yields in moves that were accompanied by broad based JPY selling and a the ascent over130.50 in EUR/JPY. It is tempting to interpolate a return of Japanese investor flows into eurozone debt two days before the ECB casts its verdict on monetary policy and before Spanish benchmark supply, but the co-movement of yields and the currency pair have been no coincidence and suggest Japanese flows may have flipped from the relentless repatriation from overseas in the spring. The 4.7% bounce in EUR/JPY from the June lows should not realistically be challenged by a dovish ECB (if that's how the press conference turns out tomorrow). The correlation of the currency pair with the US/EU 10y swap spread is only 0.41 and short JPY positions are considerably less heavy than they were six weeks ago. Option structures and flows aside, only a disappointing US payrolls report on Friday would give investors a reason to book profits. Meanwhile, Greece continues to bubble in the background as a EUR negative but the EC yesterday denied it has set the country a three-day deadline to reassure lenders if can deliver on the bailout terms. It was announced that the Eurogroup will make a decision next Monday whether or not to disburse the next EUR6.3bn bailout tranche to help cover the repayment of EUR2.17bn worth of government debt on 20 August.

A trio of key US labour market data will take precedence today over pretty much everything else. Initial claims, ADP and the ISM non-manufacturing services survey are due before US markets shut for Independence Day tomorrow. We got an inkling yesterday of the direction the market is willing to push the USD, irrespective of the fact that US yields continue to trade remarkably well in the face of Friday's upbeat employment expectations. Today's ADP and ISM releases may prove whether the calm is deceptive and the pivoting around 2.50% in cash yields and 2.70% in swaps is merely a testimony of investors playing for time before Friday and a function of reduced trading volume.

The Riksbank is expected to keep its benchmark rate on hold at 1.00% today. The bank issued a lower repo rate forecast last April and is likely to reiterate this view today without making meaningful changes to the underlying forecasts. Increases in the repo rate are not expected until the second half of 2014. For EUR/SEK, quite a bit rides on the ECB tomorrow and the UST reaction to payrolls tomorrow, but with the mean reversion move from 8.90 nearly over, SEK bears may be tempted to reload long EUR/SEK (and USD/SEK).

See the original article >>

3 Reasons Why I Expect A Weak June Jobs Report

by Lance Roberts

I have been asked quite a bit as of late as to my opinion about the June jobs report to be released on Friday, July 5th.  The current estimate, according to Econoday, is for 161,000 jobs to be created in June with a range of 145,000 to 200,000.  There are several reasons that I believe that this number could well come in below current expectations.

First, job creation, since the end of the last recession, has been a function of population growth as shown in the chart below.

Employment-population-growth-070213

Employment is ultimately created by either increasing aggregate end demand or by expectations of stronger demand in the near future.  Business owners are sensitive to employment as it is a major cost of any business which directly impacts profitability.  Therefore, after the financial crisis, employers shed jobs as rapidly as possible, increased productivity and extended working hours to meet demand while increasing profitability.  However, as shown in the chart above, employment increases have mostly been about the incremental demand increase caused by population growth.

Currently, weak economic forecasts caused by uncertainty surrounding fiscal policy keeps businesses focused on minimizing costs by increasing productivity and minimizing employment.  These actions have been instrumental in the record levels of corporate profits generated per employee.

Corporate-Profits-Employees-070213

With the Affordable Care Act (ACA) looming just ahead, higher current tax rates and reduce tax incentives in the future; it is not surprising to see businesses opting for temporary/part-time hires to reduce the costs associated with full-time hires.  Currently, full-time employment relative to the population remains near the recessionary lows.

Employment-Fulltime-population-070213

The decline in jobless claims, which has been a "rallying cry" by mainstream analysts for the elusive economic recovery, is due more to the effect of "labor hoarding" than due to increases in employment.  Corporations have simply run out of people to "fire" and are now being forced to modestly increase wages to retain quality employees.

This brings me to the 3 reasons why I think the June jobs report could be a disappointment.

1) Reduced Demand

The recent negative revision to GDP, from an initial read of 2.5% to a final print of 1.8%, is continued evidence of slow economic growth.  The negative revision was almost entirely focused in the consumer spending component of the economic calculation which is a bulk of the demand driver for businesses.  The weaker read on consumption is likely to have led to not only weaker employment in June but also, potentially, negative revisions to the April and May data as well.   The chart below shows the correlation between the annual changes in PCE and Employment.  The current negative trend in PCE is likely to drag employment lower in the months ahead which could pose a serious issue to Bernanke's view to a strengthening economy and a reduction in liquidity programs.

PCE-Employment-070213

2) Corporate Profits Have Likely Peaked

As I stated above the main driver of employment is increased end demand that leads to increased profitability.  The problem currently, as I discussed recently, is that corporate profits have reached what seems to be a peak in growth.  The chart below show both operating and reported earnings for the S&P 500.

sp500-earnings-070213

With earnings growth slowing it is far more likely that corporations will become more defensive in their hiring in order to sustain profitability.  Furthermore, with exports comprising roughly 40% of corporate profits, the Euro-zone recession, slowing in China and Japan's realization of the limits of "Abe-nomics" is negatively impacting profits, outlooks and employment.

3) "Muddling" Economy

Weak economic growth certainly does not inspire corporations to hire.  The chart below shows the correlation between the annual changes in employment and the STA Composite Employment indicator (see here for detailed explanation) which is a composite indicator of the employment component of major economic surveys.

STA-Employment-Index-070213

Currently at 15.60 the indicator is at its lowest levels since December of 2012 when the economy was barely growing as the "fiscal cliff" loomed.  While there has been some pickup in hiring intentions in some of the latest manufacturing reports; these are more related to seasonal hiring tendencies and the need to meet demand growth from increased population.

While the mainstream analysts, and economists, continue to hope for a resurgence in the economy, and a return to full employment, the reality is that such a event is likely very far away.  With 90 million people out of the work force, near record levels of individuals on food stamps, disability or other forms of government assistance and wages stagnant as the cost of living continues to rise - there are few indicators that would suggest a strong economic recovery in on the horizon.

It is currently expected that the "fiscal policy" drags from recent tax hikes, reductions in tax credits, and increased regulations will somehow dissipate as we head into 2014.  The reality is that such fiscal drags take quite some time to filter into the economy and begin to take a toll on consumption.  Furthermore, the onset of the ACA, going into the beginning of next year, has not been fully factored into economist's expectations.  The higher costs of health care, benefits and regulations will likely have a much higher negative impact to profitability, employment and growth than what is currently factored in.

Lastly, it has been completely disregarded that we are now more than four (4) years into the current economic recovery.  After trillions of dollars of stimulus, bailouts and artificial supports; expectations for a surge in economic growth are coming very late in this cycle.  While it is clearly possible to delay an economic recession with enough monetary stimulus - it has yet to be proved that such events can be repealed.

For all of these reasons I suspect that the June report on Friday will be a disappointment of between 120-150K jobs with a surge in temporary hires.  However, employment numbers in the current month are always "iffy" and subject to adjustments that cannot be accurately accounted for.  However, what I am most interested in seeing is the revisions to prior employment estimates.  If I am right - we are likely to see negative revisions in that data which would be a reflection of the continued slow growth economic environment that has been the hallmark of this recovery.

See the original article >>

Dow is Infested With Sharks

by Greg Harmon

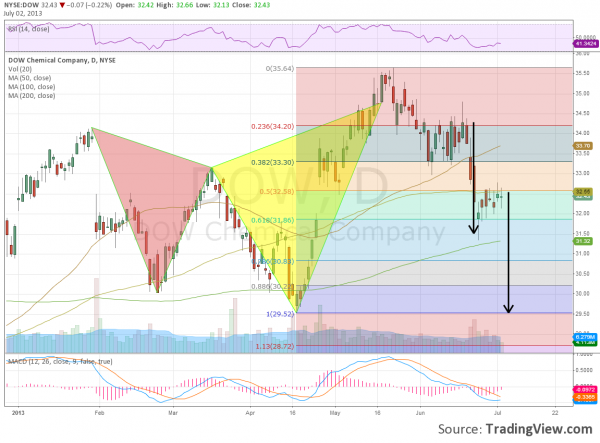
Dow Chemical, $DOW, has been living with sharks all year. The Harmonic type of sharks. Since late January the chart below shows the Bearish Shark playing out. In mid May it went above the Potential Reversal ZONE (PRZ) and came back down through by the end of the month. The reversal has been playing out and it is now at a inflection point. Last week it hit a 61.8% retracement of the range of the Shark and held. This is a stall at the target for the reversal. The Relative Strength Index (RSI) continues to look lower, while the Moving Average Convergence Divergence indicator (MACD) That is the key.

dow

So what is next? A bounce here over the 50% retracement and 100 day Simple Moving Average (SMA) at 32.58 triggers a long entry looking for move higher to resistance at 34.30. And then the previous high. But a breakdown below the 31.86 level at the 61.8% retracement has a target lower at 29.52, a full retracement and the Measured Move at 29.50 coincides with it. Two signals, two plays. Take what it gives you.

See the original article >>

Goldman Sachs To The Fed: Taper But Don’t Tighten

by AuthorWolf Richter

New York Fed President William Dudley has spoken. He represents Goldman Sachs, where he was a partner and managing director until 2007. Goldman owns part of the NY Fed and is one of the 21 “primary dealers” – TBTF banks and security dealers from around the world, many of them bailed out by the NY Fed – to which the NY Fed hands the money that it prints on orders from the FMOC, in exchange for Treasuries and mortgage-backed securities, currently $85 billion a month. If it sounds incestuous, so be it.

Goldman et al. want free money for as long as possible no matter what that does to the real economy, savers, or pension funds. Creating bubbles? No problem. They’ll make money off them. “We at the Fed have been working hard to help homeowners and the overall housing market recover,” Dudley said, hence Housing Bubble II, with home prices jumping 26% in Nevada year over year in May, and 12.2% nationwide,  according to CoreLogic, the bubbliest rise since 2006, just before Housing Bubble I blew up.

And that’s good. But Goldman doesn’t want the financial system to blow up again, of which it is one of the largest beneficiaries. You can milk a cow many times, but you can bleed it only once. Hence, a modicum of prudence.

That’s exactly what Dudley proffered in his speech at the Business Council of Fairfield County, Stamford, Connecticut. Concerning the national economy, he served up the usual fare of how it was muddling through, with some things getting better, such as employment. And then he drew the line in the sand – dotted with some ifs.

If this pattern continues, the FMOC would “begin to moderate the pace of purchases later this year,” he said. Whether it would be “in, say, September,” as Federal Reserve Board member Jeremy Stein had pointed out last Friday, Dudley didn’t say. But he did agree with Stein: unless a major fiasco mucked up the scenario, the Fed would taper its money-printing and bond-buying binge this year.

Goldman said so. CEO Lloyd Blankfein had made it public a couple of weeks ago when he said that “eventually interest rates have to normalize,” that it wasn’t “normal to have 2% rates.” They’re all worried about the same thing: that asset bubbles caused by the money-printing and bond-buying binge would eventually pop and take down the financial system [my take...  Controlling The Implosion Of The Biggest Bond Bubble In History].

While Stein had put the beginning of the Big Taper on the calendar – September – Dudley penciled in the completion date. After starting this year, the Big Taper would proceed “in measured steps” and be complete by “around mid-2014. A year from now. Participants expect one heck of a ride, judging from the clicks of seatbelts being buckled around the world.

He assumed that by then, the unemployment rate would hover near 7%, with the economy’s momentum allowing for “further robust job gains in the future.” But he kept an eraser handy. Policy decisions would depend on the economic outlook “rather than the calendar.” So the scenario he’d described was just “one possible outcome.” If economic conditions were to “diverge significantly” – not just a little – the drunken binge could go on.

He then explained to all partiers what that would mean for the punch bowl. It would remain on the table, and it would be refilled, but in such a manner that it would be watered down little by little. The continued asset purchases, though at a lesser rate, would be “adding monetary policy accommodation, not tightening monetary policy,” he said. Based on this logic, bubbles should remain inflated, or deflate gradually, as the asset purchases would “put downward pressure on longer-term interest rates.” To keep them from blowing through the roof. Until mid-2014.

Ah yes, and the Fed would be “likely to keep most of these assets on its balance sheet for a long time.” Selling the mortgage-backed securities? Forget it: A “strong majority” no longer favored that. And raising short-term rates? “A long way off.” So, even if the unemployment rate dropped below the 6.5% threshold, the FMOC might “wait considerably longer.” He mentioned 2015, a mirage that keeps moving further into the future.

A glorious admission that the money-printing and bond-buying binge glued to a zero-interest-rate-policy has permanently screwed up the normal functioning of the markets, that the Fed could not return them to their prior state, that it might never be able to do so, and that Goldman et al., after having grown immensely fat under this regime, don’t want to give it up. But they don’t want the financial system to blow up either. Hence the Big Taper.

Selling bonds and raising short-term rates would be the actual tightening, but “it’s always: yes, in the long term we need to stop with the policy of cheap money and just piling on debt, but please not right now; now the economy must first get back on its feet,” said William White, one of the few central-bank economists who’d predicted the Financial Crisis. Read.... “For 25 Years, It’s Never Been The Right Moment” To Tighten

See the original article >>

How to Take Advantage of the Inevitable Rise in Interest Rates

By Sasha Cekerevac

Many people are only just now coming to understand something I’ve been warning about for several months: interest rates are set to rise.

In the month of June, there was a record amount of money pulled out of bond mutual funds and bond exchange-traded funds (ETFs).

According to TrimTabs, a total of $70.8 billion exited bond mutual funds, with an additional $9.0 billion of assets being pulled out of bonds ETFs. That $80.0 billion in total assets being pulled out of the fixed-income asset class was almost twice as large as the pullout that occurred in the fall of 2008, the previous record of monthly outflows. (Source: “Unprecedented $80 Billion Pulled from Bond Funds,” CNBC, July 1, 2013.)

Obviously, long-time readers of mine won’t be surprised, since I’ve been recommending adjusting one’s investment strategy to incorporate higher interest rates for several months now.

Even just over a month ago, when 10-year interest rates crossed the two percent barrier, I wrote in the Investment Contrarians article “Why U.S. Treasuries Are Still the Worst Investment” that my analysis had led me to conclude that interest rates were set to continue rising. Even at that time, I was urging readers to incorporate this into their investment strategy.

At the time, many so-called “market experts” thought that interest rates would begin to fall and test the lows of the year. My argument has been that we’ve seen the lows of this cycle, and interest rates for the next few years will begin to rise significantly, especially on the long end of the curve.

Clearly, we are not Japan, because there are already signs of our economy improving. In addition, the Federal Reserve has been much more aggressive over the past few years in trying to promote economic growth. Only now, after decades of inactivity, has the Bank of Japan embarked on an ultra-aggressive monetary policy similar to what the Federal Reserve has been doing over the past few years.

10-Year US Treasury Chart

Chart courtesy of www.StockCharts.com

The above long-term chart of interest rates for the 10-year U.S. Treasury shows that even though the move has been substantial, interest rates are still historically very low.

It is important to note that interest rates will adjust in different measures along the fixed-income curve, so investors need to be careful in their investment strategy allocation. The Federal Reserve will stop its asset purchase program over the next year; however, they will keep the Fed funds rate, which is for extremely short-term overnight lending, at very low levels likely until 2015.

That means short-term interest rates won’t move as much as the long-term end of the curve. Personally, as an investment strategy, I have been recommending investors move out of very long-term interest rates, such as the 10-year note or 30-year bond, and to essentially keep cash on hand in short-term investments for when interest rates rise. Over the next few years when rates begin to rise, investors should then reallocate an investment strategy to lock in higher interest rates.

The recent up-tick in interest rates could be used by fixed-income investors to allocate funds in relatively short-term paper, such as a two-year note—and when this investment matures, we would have an environment of much higher interest rates to roll these funds into a long-term fixed-income asset.

See the original article >>

The Stock Bull Market Top

By: Ed_Carlson

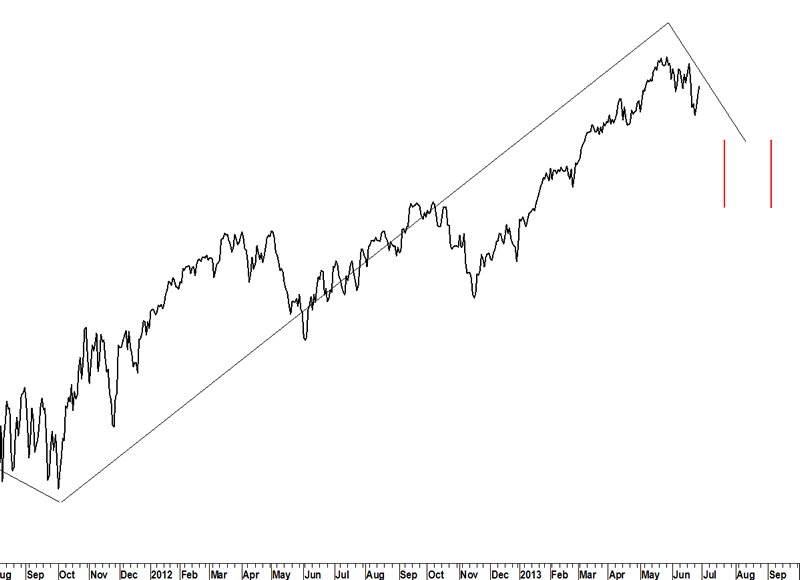
It looks increasingly likely that the high in the Dow on 5/22/13 was the top of the bull market. Let’s go through the process used by George Lindsay to discover why.
It is true that the window for the top (as defined by the 15year interval from October 1997) is open until the end of September, as is the time span of a short basic advance (630-718 days) from the low of the basic cycle on 10/4/11.

A final high on 5/22/13 would make the basic advance 596 calendar days. This count fits the time span of a sub-normal basic advance (414-615) but the occurrence of sub-normal advances has been very rare.
A Middle Section count, taken from the major cycle, points to a high within five days of the May top.
All the above (by itself) does not rule out the possibility of a higher high before the end of September. The likely elimination of any higher high during that time frame is inferred from the following observations.
The next Middle Section forecast for a high comes on 7/5/13. A top then would make the basic advance 640 days and fit the time span of a short basic advance (630-718 days). Despite new-month bullish seasonality, it seems unlikely that the Dow can gain enough in the next two trading days to see a new high. Of course, it is possible…
The bigger challenge is the existence of a 12year interval which points to a tradable low (not bear market low) between 7/21/13 and 9/4/13. The 12year interval should be expected to pull the Dow down into a low sometime during this period.
If a new high is not printed in the days surrounding 7/5/13, and a decline is seen into the late July/ early September time frame, that leaves only three weeks before the window closes for a final high to the bull market in the Dow.  It wouldn’t be unusual to see the 12year interval expand to include most of September, and not just the first four days. Given September’s track record, an advance during this time of year seems unlikely.

See the original article >>

Inflation’s Shot Across the Bow, Deflationary Pressure is Expected to Resurface

By: Clif_Droke

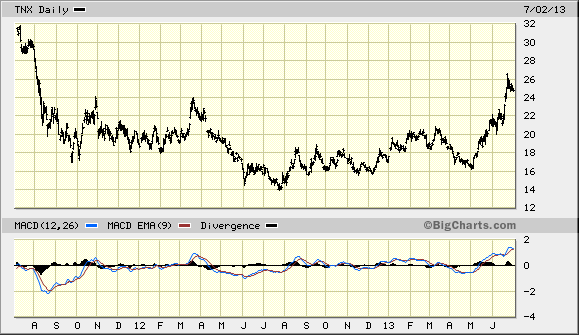
On May 3, the bond market fired the proverbial “shot heard ‘round the world.” Treasury yields began a two-month climb to levels not seen in almost two years. Many analysts proclaimed the end of the 30+ year interest rate decline. The true significance in the yield rally isn’t that the long-wave deflationary trend in interest rates is over, however. Rather, it’s that the commencement of long-term inflation is within sight.

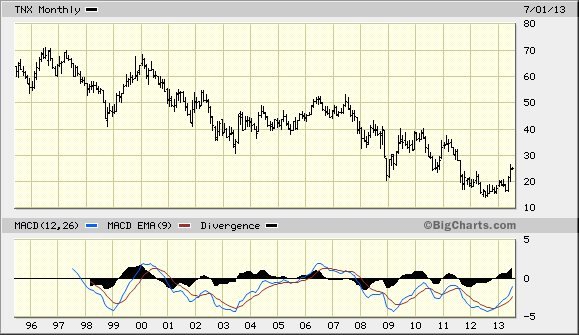
While the rally in Treasury yields does have longer-term significance, it’s still far too early to assume the downtrend in yields is over. As we’re still some 15 months away from the bottom of the 120-year cycle of inflation/deflation we can only assume the downward trend in interest rates remains intact. Additionally, as real estate analyst Robert Campbell has pointed out, “until the actions of the Fed speak otherwise, Fed policy is currently working to push mortgage rates down.”
The rally in Treasury yields, while impressive, should be put into context with the longer-term yield trend. Here’s what the Treasury Yield Index (TNX) looks like from the vantage point of a 2-year chart. In this relative short-term chart you can clearly see the attempt yields have made in establishing a new rising trend in relation to the steep drop in 2011-2012.

It’s only when we examine the long-term monthly chart of TNX that the true long-term trend becomes clear. The downtrend line that can be drawn by connecting the yield peaks from 1996 through 2011 hasn’t even been broken yet. The interest rate downtrend is therefore presumed to be still in force. It likely won’t be until after October 2014, when the Kress mega cycle bottoms, that we’ll finally see this downtrend broken.

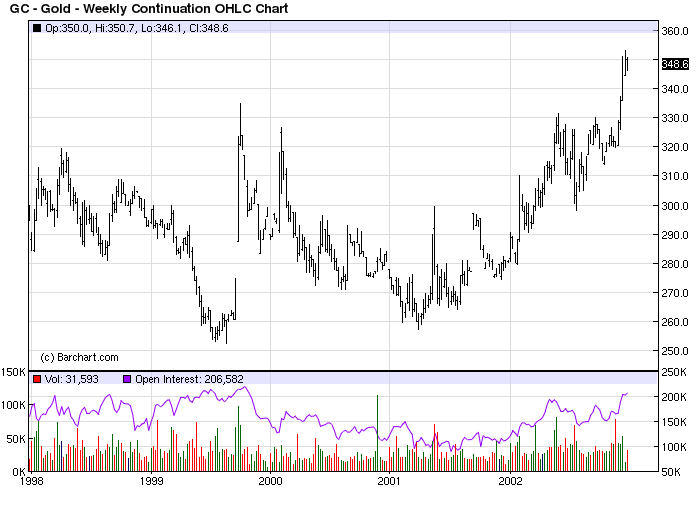
What then is the ultimate significance of the sharp rally in bond yields? The spike in yields can only be appreciated by making historical comparisons with markets that behaved in a similar fashion. For instance, gold was in a similar long-term downtrend from 1981 through 1999 when, in the autumn of ’99, the yellow metal unexpectedly launched a vigorous rally from its long-term low of nearly $250/oz. to a high of over $330/oz. in just a few short weeks (see chart below). This wasn’t the official beginning of gold’s long-term bull market, which would actually begin less than two years later. It was, however, an advance warning that a major change of gold’s long-term trend was in the making.

Comparing gold with bonds isn’t as dissimilar as some may think, for both are excellent barometers of longer-term global liquidity and inflation/deflation expectations. Of the two, interest rates are a more important indicator of inflation and deflation, so it will be especially important to monitory the interest rate trend in the coming months as we draw closer to the 120-year cycle bottom.
The ultimate meaning behind the short-term rally in Treasury yields can only be known with certainty after the facts have become clear. It’s still far too early to discern what those facts may be. Based on historical examples, however, it’s probable that the yield rally is a “shot across the bow” preliminary to the beginning of a new long-term inflationary trend starting in late 2014/early 2015.
U.S. Economy
The selling pressure which hit stocks and bonds in June left the U.S. retail economy unscathed.
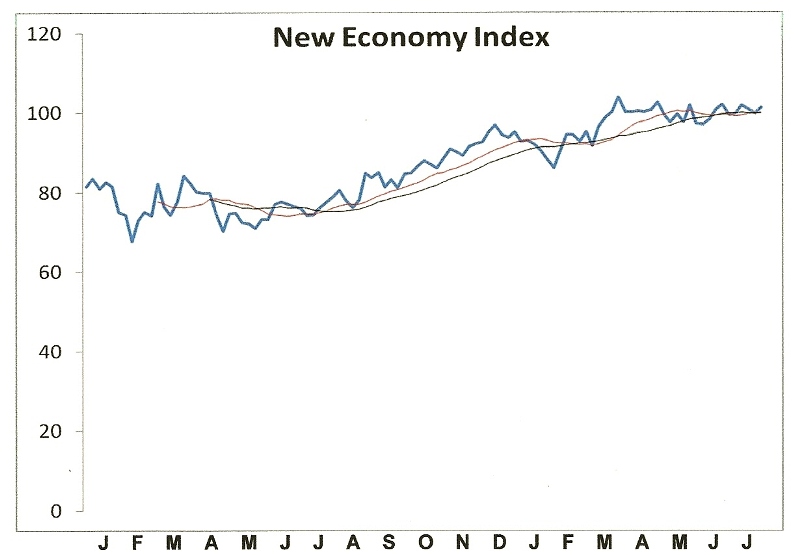
Among the individual corporate stock components of the New Economy Index (NEI), which measures the real-time strength of the economy, only Wal-Mart (WMT) took a sizable tumble in June. Monster Worldwide (MWW), the jobs component of the NEI, also plunged last month but its stock price accounts for only a small amount of the index.
Meanwhile Amazon (AMZN), EBay (EBAY) and FedEx (FDX) – the other important components of the index – are in varying degrees of health or recovery. The signals reflected in the stock price performance of these three stocks alone are worth a hundred conventional economic indicators of the type relied on by mainstream economists.
The NEI reading for last week was in line with the reading of recent weeks, viz. the NEI is still holding on above its 12-week and 20-week moving averages. The interim uptrend for the index remains intact (below), therefore we still have a confirmed “buy” signal for the U.S. economy.

Deflationary pressure is expected to resurface as we head closer to the final “hard down” phase of the long-term Kress cycle in 2014, but for now those pressures are confined mainly to Europe and Asia and haven’t yet appeared in the U.S. The domestic retail economy, along with the consumer spending that supports it, is still firm.

See the original article >>

Oil cracks $100 as Egypt violence adds to risks

By Phil Flynn

I have been telling my clients that for WTI crude oil to get above $100 a barrel we would need an event. Yesterday we got two. Not only did Egypt's President act defiant against military demands to meet the protestors demand, then we had a big drop in American Petroleum Institute's supply report. The API showed-U.S. weekly crude stocks off 9.4 mln bbls -U.S. weekly gasoline stocks off 183,000 bbls weekly distillate stocks off 2.3 mln bbls . Obviously the flooding and pipeline closures impacted supply. We also had the restart of the big BP Whiting Indiana plant, a factor that will change Cushing supply.

In Egypt the situation is adding to the risk. Violence overnight is adding to the tension as Morsi says heck no, I won't go.  The Suez Canal is now on high alert and there are increased risks that there may be sabotage of oil pipelines mainly the SUMED pipeline. The Energy Information Administration reminds us why oil cares. According to the EIA the Suez Canal/SUMED Pipeline strategic routes for Persian Gulf oil shipments to Europe. Closure of the Suez Canal and SUMED Pipeline would add an estimated 6,000 miles of transit around the continent of Africa.

The Suez Canal is located in Egypt, and connects the Red Sea and Gulf of Suez with the Mediterranean Sea, spanning 120 miles. In 2011, petroleum (both crude oil and refined products) and liquefied natural gas (LNG) accounted for 15 and 6 percent of Suez cargoes, measured by cargo tonnage, respectively. In 2011, 17,799 ships transited the Suez Canal from both directions, of which 20 percent were petroleum tankers and 6 percent were LNG tankers. Only 1,000 feet wide at its narrowest point, the Canal is unable to handle Ultra Large Crude Carriers (ULCC) and most fully laden Very Large Crude Carriers (VLCC) class crude oil tankers. The Suezmax was the largest ship capable of navigating through the Canal until 2010 when the Suez Canal Authority extended the depth to 66 feet to allow over 60 percent of all tankers to use the Canal, including ships that are 220,000 of dead weight tons in size.

SUMED Pipeline The 200-mile long SUMED Pipeline, or Suez-Mediterranean Pipeline, provides an alternative to the Suez Canal for those cargos too large to transit through the Canal (laden VLCCs and larger). The crude oil flows through two parallel pipelines that are 42-inches in diameter, with a total pipeline capacity of around 2.4 million bbl/d. Oil flows north through Egypt, and is carried from the Ain Sukhna onshore terminal on the Red Sea coast to its end point at the Sidi Kerir terminal on the Mediterranean. The SUMED is owned by Arab Petroleum Pipeline Co., a joint venture between the Egyptian General Petroleum Corporation (EGPC), Saudi Aramco, Abu Dhabi's National Oil Company (ADNOC), and Kuwaiti companies.

The SUMED Pipeline is the only alternative route to transport crude oil from the Red Sea to the Mediterranean if ships were unable to navigate through the Suez Canal. Closure of the Suez Canal and the SUMED Pipeline would divert oil tankers around the southern tip of Africa, the Cape of Good Hope, adding approximately 6,000 miles to transit, increasing both costs and shipping time. According to the International Energy Agency (IEA), shipping around Africa would add 15 days of transit to Europe and 8-10 days to the United States.

Fully laden VLCCs transiting toward the Suez Canal also use the SUMED Pipeline for lightering. Lightering occurs when a vessel needs to reduce its weight and draft by offloading cargo in order to enter a restrictive waterway, such as a canal. The Suez Canal is not deep enough to withstand a fully laden VLCC and, therefore, a portion of the crude is offloaded at the SUMED Pipeline at the Ain Sukhna terminal. The now partially laden VLCC then goes through the Suez Canal and picks up the portion of its crude at the other end of the pipeline, which is the Sidi Kerir terminal.

The majority of crude oil transiting the Suez Canal travels northbound, toward markets in the Mediterranean and North America. Northbound canal flows averaged approximately 535,000 bbl/d of crude oil in 2011. The SUMED Pipeline accounted for about 1.7 million bbl/d of crude oil flows from the Red Sea to the Mediterranean over that same period. Combined, these two transit points were responsible for nearly 2.2 million bbl/d of crude oil flows into the Mediterranean. Northbound crude transit has declined by almost half since its level in 2008 when 943,000 bbl/d of crude transited northbound through the Canal and an additional 2.1 million bbl/d of crude travelled through the SUMED to the Mediterranean. Contrarily, crude oil shipments travelling southbound through the Canal toward the Red Sea, primarily destined for Asian markets, increased from 2008 through 2010, but fell slightly in 2011. Total oil flows from the Suez Canal declined steeply by more than one-third in 2009 to about 1.8 million bbl/d, down from 2008 levels of over 2.4 million bbl/d. Crude oil flows through the SUMED experienced a much steeper drop to1.2 million bbl/d from approximately 2.1 million bbl/d over the same period. The year-over-year difference reflects the collapse in world oil market demand that began in the fourth quarter of 2008, followed by OPEC production cuts (primarily from the Persian Gulf), which caused a sharp fall in regional oil trade starting in January 2009. Drops in transit also illustrate the changing dynamics of international oil markets where Asian demand is increasing at a higher rate than European and U.S. markets, and West African crude production is meeting a greater share of the latter's demand. At the same time, piracy and security concerns around the Horn of Africa have led some exporters to travel the extra distance around South Africa to reach West African markets. Total oil flows through the Suez Canal increased year-over year to almost 2.2 million bbl/d in 2011, but still remain below previous levels prior to the global economic downturn.

Unlike oil, LNG transit through the Suez Canal has been on the rise since 2008, with the total number of laden tankers increasing from approximately 210 to over 500, and volumes of LNG traveling northbound (laden tankers) increasing nearly six-fold. Southbound LNG transit originates in Algeria and Egypt, destined for Asian markets while northbound transit is mostly from Qatar and Oman, destined for European and North American markets. The rapid growth in LNG flows over the period represents the startup of five LNG trains in Qatar in 2009-2010. The only alternate route for LNG tankers would be around Africa as there is no pipeline infrastructure to offset any Suez Canal disruptions. Countries such as the United Kingdom, Belgium, and Italy received over 80 percent their total LNG imports via the Suez Canal in 2010, while Turkey, France, and the United States had about a quarter of their LNG imports transited through the Canal.

We also have Portugal bond yields rising, a factor that could signal more rough times for Europe. Reports a plenty today could also make for some wild swings.

See the original article >>

Stock Market Flash Crash Still Probable

By: Anthony_Cherniawski

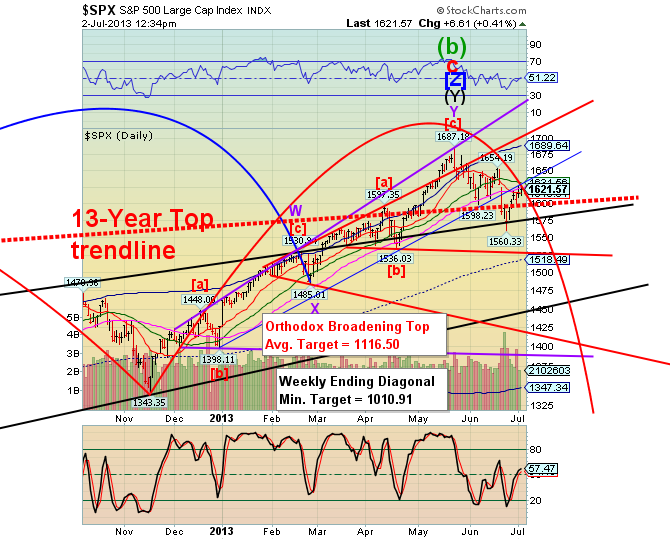
SPX revisited the 50-day moving average this morning at 1624.06 and has since declined toward Short-term support and rally trendline at 1650.50. Once beneath these supports, we should see the SPX fall away pretty rapidly. The probability of a Flash Crash is very high, with a potential bottom date of Tuesday, July 9. Beyond that, there may only be a short but powerful bounce that will rollover into a deeper decline ending in the first week of August.

There may considerable pressure to keep the markets elevated into the July 4 holiday. We all know that this is a political “hot potato” and it would be preferred not to have too many people upset going into their holiday. Cycles may be pushed and prodded to look good at quarter-ends and holidays. But the decline and its targets are only postponed.

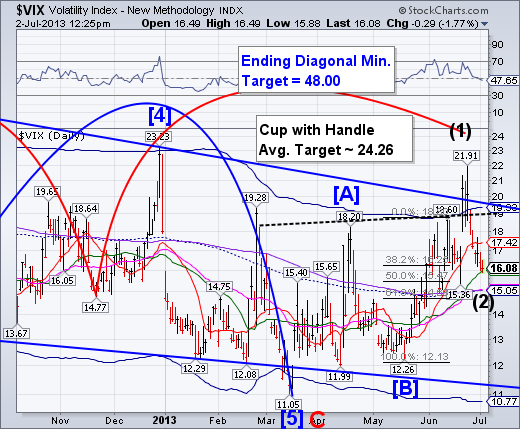
VIX stopped its decline at Intermediate-term support at 16.02 and is ready to resume a short, but very powerful rally that could top out on Monday. This lines up with the thesis that a Flash Crash still awaits the equities.

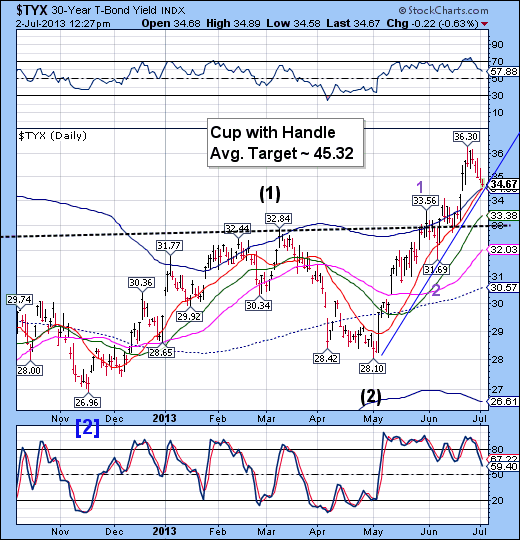
TYX has pulled back to a triple support at 34.49. This portends a spike in 30-year Treasury rates to 4.00%! This could also happen by next Tuesday. More evidence for a Flash Crash…in bonds as well as stocks. From there, another pullback that lasts a week, then rates go higher still.

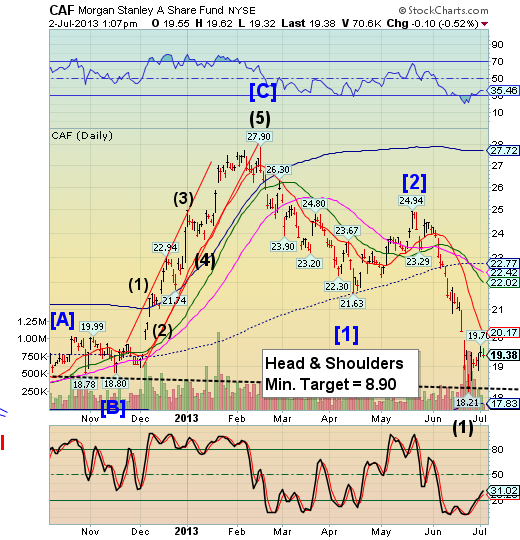
CAF bounced from its Head & Shoulders neckline and its retracement also appears to be over. The next decline may be the worst yet as the Head & Shoulders neckline is sure to be violated.

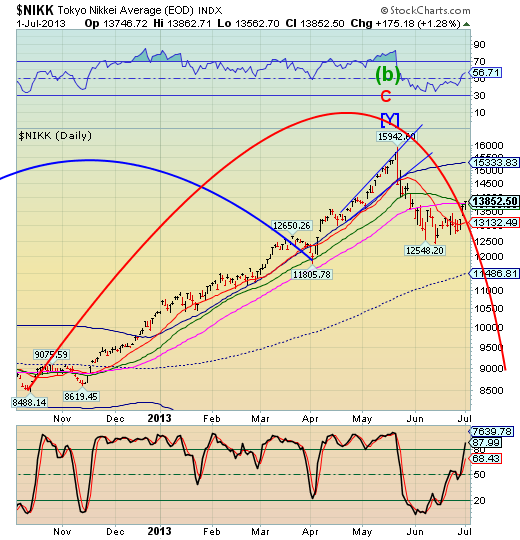
The Nikkei also closed near its 50-day moving average yesterday. Last night it went over 14000.00. Japan is the country with the most pressure to print its way out of its malaise. However, once the US market rolls over, it should be unable to maintain its current support level.

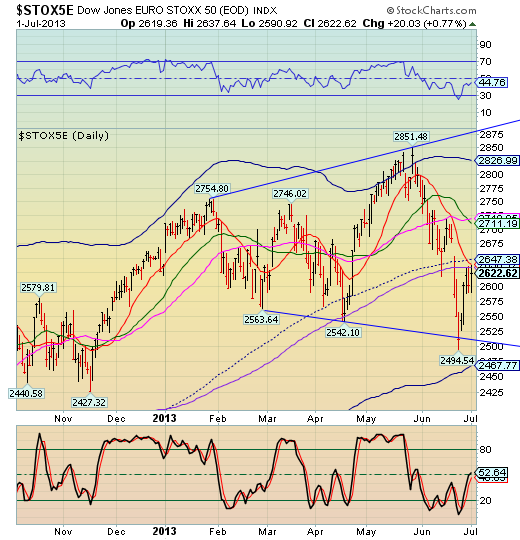
Euro Stoxx appear to be in the worst shape among the global equity indexes. It has long ago left the 50-day moving average behind and is now retesting the 200-day moving average. It has also pierced the bottom of its Orthodox Broadening Top, so the next decline will be the trigger for a crash to 1925.00 – 1950.00. There is a high probability that Stoxx will also bottom next week, or early in the following week.

I am monitoring all of these indices in my Model. This gives me a pretty fair assessment of what may be coming and the intensity of the declines. The next decline in Stoxx will be the most intense, since it will be a Primary Cycle decline.

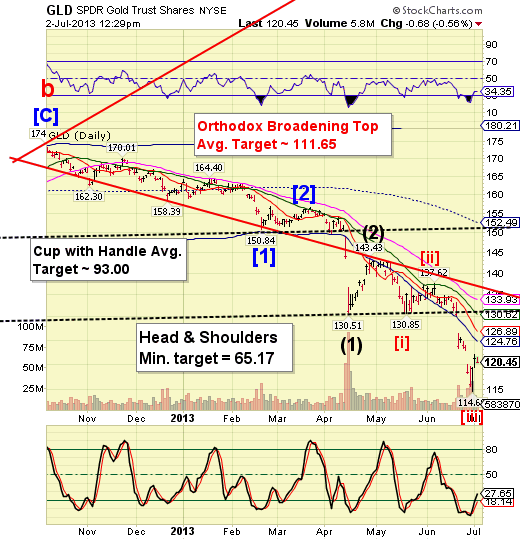
GLD doesn’t have much time left for its rally. The probable top may be at the close on Wednesday (Remember, the market closes at 1:00) or early on Friday. Cycle bottom resistance appears to be the limit for the rally at 124.75. Short-term resistance is only two points above, if it should go higher.

I will be doing a write-up on the currencies next.

See the original article >>

Dollar Firm, but Yen and Sterling Shine

by Marc to Market

Problems in Portugal and Greece, coupled with disappointing service PMI, have kept the euro under pressure. It is recording its first complete session below $1.30 since late May. The yen and sterling are the best performers today.

Initially in Asia, the dollar's gains ere marginally extended a little above JPY100.80, but traded in narrow ranges, until early Europe when it was sold off amid anxiety over the more general investment climate. The impetus was not coming from Japanese asset markets, where equities were mixed (Topix and JASDAQ up, but Nikkei down) and JGBs were slightly firmer. The dollar fell to near yesterday's lows (~JPY99.50). A convincing break would undermine the technical tone of the greenback.

Sterling has rallied a little more than a cent on the back of a much stronger than expected UK services PMI, which completely the week's trifecta of improving PMIs. The service PMI rose to 56.9 from 54.9, whereas the consensus had expected a small decline.  The data reinforces the view that the UK economy is posting healthy growth in Q2 (~0.5%) and has momentum going into Q3.  Ironically, the new governor of the central bank was picked in large measure due to his ability and willingness to innovate and deploy monetary policy in a way that is more supportive of growth.  Carney's first meeting (tomorrow) was never expected to be the key event, but with the recent string of data, with price pressures still sticky, talk of exit strategies is likely to emerge.  This is turn will test Carney's forward guidance tools. 

The euro has been turned back from the GBP0.8600 level as anticipated yesterday.  The low in Europe was set near GBP0.8490, largely meeting our GBP0.8480-GBP0.8500 objective.  The initial move looks nearly exhausted, but the larger down move may not be.  Initial resistance is now seen in the GBP0.8520 area.  Sterling itself is posting a potential key reversal against the US dollar, trading on both sides of Tuesday's range. A close above Tuesday's high, just below $1.5240, would confirm the one-day reversal pattern.  The upside objective would be in the $1.5360-$1.5400 area. 

The poor price action yesterday failed to allow a low risk entry into our other trade idea of buying and Australian dollar against the Canadian dollar on a possible head and shoulders bottom pattern.   Although Australia reported a better than expected trade surplus (third in a row after more than a year of deficits) was not sufficient to offset the disappointing retail sales (0.1% vs 0.3% consensus) and the RBA governor's call for a weaker currency.  The Australian dollar was sold to new lows for the move, near $0.9050.   This leg down in the Aussie is threatening the head and shoulders bottom against the Canadian dollar. 

The euro area news stream is going from poor to worse.  Political uncertainty in Portugal continues to undermine the local bond market, which is thinly traded even in the best of times. The 10-year yield is up more than 110 bp and the 5-year CDS is up almost 90 bp.  The political tensions in the governing coalition complicate the Troika's review that is due to start in mid-July, a snap election may still not be the most likely outcome.  If the center-right coalition member the CDS leaves, the government would have 108 of 230 seats and may try as a minority government, which may buy time over the summer.   Local elections are scheduled for September, coinciding with the government's submission of the 2014 budget. 

Meanwhile, one must marvel at how long Greece's three-day deadline lasts.  We have been skeptical of it and recognize that the whole process has been fraught with brinkmanship tactics and that the real deadline is next week's Eurogroup meeting.  We see plenty of room for innovative compromises and expect a deal will be announced at the very last moment that will allow Greece to have sufficient funds to cover a bond maturity later this month. 

In terms of economic data, the disappointing service sector PMI offsets the better than expected retail sales data.  Owing in good measure to the decline in the German PMI reading to 50.4 from the 51.3 flash reading, the region's services PMI fell to 48.3 from 48.6 of the flash reading.  That it is still up from 47.2 in May shows that a muted recovery is still underway.    France actually did better than the flash (47.4 vs 46.5), and Spain also surprised to the upside.  Italy, however, joined Germany, with disappointment. Its reading fell to 45.8 from 46.5.  The consensus was for a rise to 47.0. 

May retail sales rose 1.0% which was much better than that 0.2% Bloomberg consensus.  However, that consensus seems out of date as Germany and France had already reported much better than expected national figures. 

Initial resistance in the euro is now seen in the $1.2980 area.  We continue to look for the euro to test trend line support seen near $1.2850.

Lastly, we note that China's service PMI was mixed, with official one ticking down and the HSBC measure ticking up.  There is no big take away from the data.  On the other hand, the credit crunch has continued to ease. Although the key short-term money market rates have not completely returned to levels that had previously prevailed, the drama is over. 

The North America features a slew of economic data in what will be an abbreviated session for many participants.  Note that due to tomorrow's holiday, weekly initial jobless claims will be reported today.  However, they will be overshadowed by the ADP jobs estimate and the US trade balance.  Later in the North American morning, the service sector ISM will be reported.  Separately, note that the June auto sales that trickled in yesterday came in at new post-Lehman highs of 15.89 mln annualized rate (vs 15.5 mln expected) and should bode well for June retail sales.  The recovery of the US auto sector stands in marked contrast with the euro area and Japan. 

See the original article >>

Shanghai flag pattern breaks 20-year support, pulling other markets with it!

by Chris Kimble

CLICK ON CHART TO ENLARGE

Could a slow down in China not only impact other Emerging markets, could it ripple in the U.S.? The above 4-pack reflects that the Shanghai index is breaking support of a multi-year flag pattern, with the bottom of the flag pattern, being a support line that has been in place for 20-years.

The 4-pack above reflects that the Hang Seng index is breaking support along with EEM and VWO, two of the six largest ETF's in the U.S.!  Don't overlook the potential ripple effects and impact on markets in the U.S. if these flag breakdowns continue to push lower!

See the original article >>

Copper gains as traders close bearish bets amid supply concern

By Agnieszka Troszkiewicz

Interruptions to output are affecting physical supply of copper, according to Societe Generale SA.Interruptions to output are affecting physical supply of copper, according to Societe Generale SA.
Copper rose on the London Metal Exchange, the only gain among the six main metals traded on the bourse, as traders closed out bets on lower prices amid concern about supply.

Interruptions to output in recent months are affecting physical supply of copper, according to Societe Generale SA. Speculators are likely positioned “very short on the LME,” Standard Bank Group Ltd. said yesterday, referring to bets on a decline. Prices reached the lowest level since 2010 last week.

“There is an impression that the market is a bit short copper, so you have a little bit of a squeeze,” Jesper Dannesboe, a senior commodity strategist at Societe Generale in London, said by phone. He cited “the supply disruptions that hit the headlines several months ago,” as well as “some short- covering.”

Copper for delivery in three months climbed 0.5 percent to $6,946 a metric ton by 10:55 a.m. on the LME. Metal for immediate delivery was at a $1.50-a-ton premium to the three- month contract, narrowing from as much as $18 yesterday, the widest backwardation in a year. Copper for delivery in September rose 0.2 percent to $3.149 a pound on the Comex in New York.

Freeport-McMoRan Copper & Gold Inc. is awaiting approval to restart underground mining at Grasberg in Indonesia, the world’s second-biggest copper mine, after a deadly accident in May. A landslide in April reduced production at Rio Tinto Group’s Bingham Canyon mine in Utah. Factory orders in the U.S. rose more than estimated in May, a report showed yesterday.

“Evidently, some market players have squared short positions in the wake of better economic data of late, pessimism among speculative financial investors having hit an 11-week high at the beginning of last week,” Daniel Briesemann, an analyst at Commerzbank AG in Frankfurt, said in a report today.

China’s State Reserve Bureau was buying aluminium, Goldman Sachs Group Inc. said in a report yesterday. Speculation that the stockpiling agency was buying copper supported the market, according to James Marks, a co-head of global metals at Xconnect Trading Ltd., a London-based interdealer broker.

Aluminum, nickel, tin, lead and zinc fell in London. Comex floor trading will be closed tomorrow for Independence Day.

See the original article >>

Chinese purchases fuel revival in grain prices

by Agrimoney.com

Grain futures extended their recovery as China made fresh purchases, extending a theme, in wheat, of rising demand underlined by the return of top importer Egypt to tender.

September wheat futures and December corn futures, the best-traded contracts, set course for a second day of gains – after on Tuesday posting their first headway in nine sessions.

The gains were attributed by traders in part to short-covering ahead of the July 4 Independence Day holiday which, besides bringing no chance to trade on US markets, has often preceded volatility in the past.

At broker Allendale, Paul Georgy said: "We must plan ahead for July 5. Historically, corn and soybeans have sharp moves on the first trading day after the holiday."

Chinese purchases

However, short-covering was leant an extra gear by news of Chinese purchases, with Beijing's official CNGOIC think tank confirming the country has booked an extra three cargoes of US corn, taking the total so far this year to 2.8m tonnes.

The corn was purchased at $272 a tonne, some 400 yuan ($65), a tonne cheaper than domestic supplies, the CNGOIC said.

Separately, traders said that China had purchased 300,000 tonnes of new crop Australian wheat, following its order two weeks ago of 200,000 tonnes of French wheat.

The purchases, said to be for January delivery for the Australian order, come amid concerns over the quality of the Chinese harvest, after late rains damaged an estimated 10m tonnes of the crop.

'Definitely due to damage'

Separately, China is, through Sinograin, building state reserves too, although the Australian deal was said to have been purchased by grain trading giant Cofco for meeting more immediate market needs.

"The Australian wheat was purchased by Cofco for the market," rather than for the reserves, a Beijing-based trading manager with a global trading company told Reuters.

"The purchases are definitely due to damage of domestic wheat quality."

Supply meets demand

The deals added to ideas of firm demand for wheat spurred by the return of Egypt, the top importer, to purchases this week at its first tender since February, a hiatus attributed by traders to the country's financial difficulties.

On Tuesday Tunisia too bought 100,000 tonnes of optional origin soft wheat.

"It is a reminder that even though we are on for some strong harvests this year, demand looks like swallowing it all up," a UK grain trader told Agrimoney.com.

"Stocks are not tight, but they are not going to get any looser."

The International Grains Council on Monday forecast world grain stocks rising by 2m tonnes to 181m tonnes over 2013-14.

See the original article >>

Japan is Winning

by Greg Harmon

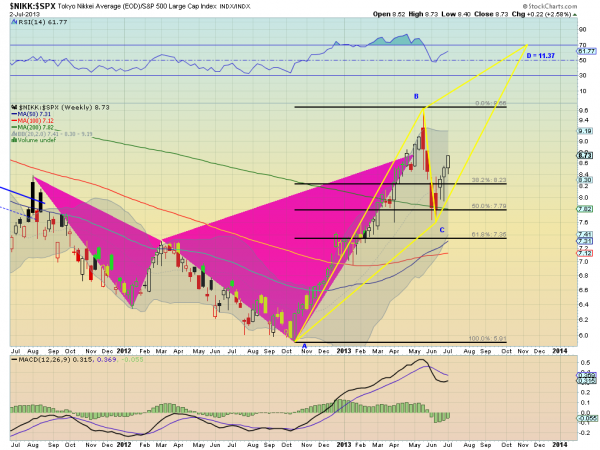
The Japanese stock market ($NKY) has been front and center in the world economic news. And it has been competing with the US market ($SPX) for dominance. Abe-nomics pushed things around and gave a nice correction in the back half of May into the first half of June, but from the ratio chart below it is clear that pull back in relative strength has ended. Technically it fits the story very well. After completing a bearish Shark, it pulled back 50% of the range. From there a

nky-spx

Tweezers Bottom on the 200 week Simple Moving Average (SMA) started a bounce higher that is gaining strength. The 3 Advancing White Soldiers pattern signals continued movement higher and the AB=CD pattern suggests a move as high as 11.37. Both the Relative Strength Index (RSI) and the Moving Average COnvergence Divergence indicator (MACD) support more upside as well.

See the original article >>

Follow Us