Sunday, February 27, 2011

Schumpeter vs. Wall and the Business Cycle Count in the Long Wave

By David Knox Barker

Joseph Schumpeter was a Harvard economist and president of the Econometric Society (1940-41). He was author of the two-volume tome Business Cycles (McGraw-Hill 1939). Schumpeter’s cycle research is of particular interest because he was one of the first to attempt to integrate sociological understanding into economic trends. He also presented an integrated approach to cycles that presented the Kondratieff long wave as a larger scale of the smaller cycles. In Business Cycles, he introduced a theoretical model for how all the various cycles fit together.

Schumpeter’s model of how all the cycles worked together to produce long waves included Kitchin cycles (the regular business cycle of 3-5 years) and Juglar cycles (7-11 years), with three Kitchins in each Juglar. Schumpeter also wrote of the Kuznets cycles (15-25 years), but didn’t put them in the charts below. The chart depicts the flow of the Kitchin and Juglar cycles integrated in 56-year long wave cycles. Note that Schumpeter’s model presented 18 business cycles in a regular long wave.

Schumpeter was limited by linear mathematics. His ideas needed non-linear dynamical systems to formalize his approach. This is precisely what is proposed at LongWaveDynamics.com, which takes a dynamic systems approach to business cycle analysis, long wave seasons and the Kondratieff long wave cycle, and the smaller cycles used by active traders.

The late market analyst PQ Wall presented a long wave model different from Schumpeter, which was essentially a dynamical systems approach to market cycles. Wall did not describe his approach to stock market and social cycles in terms of dynamic systems, but Wall took what he described as a threeness and fourness approach to cycle divisibility, which was a genuinely novel approach to cycle analysis.

Wall proposed that long waves consist of four seasons of development, much like the natural seasons of the year; spring, summer, fall and winter. This seasonal approach to the long wave cycle is expected to have originated with Oswald Spengler, the German sociologist. Wall divided each season by four, producing sixteen business cycles in every long wave. The chart below presents Wall’s approach to business cycles in a long wave. The important take away is that PQ Wall’s approach produces 16 and not 18 business cycles in every long wave. 
Idealized Long Wave 
After two decades of stock market cycle research from a dynamic systems approach, I have come to endorse Wall’s approach to the business cycles that produces what I have termed long wave dynamics. Below is a chart that presents an inflation adjusted 20-year moving average of returns in the S&P 500. This chart knocks out some of the noise produced by fiscal and monetary intervention, which is for the express purpose of eliminating business cycle; a goal that always manages to elude the interventionist, no matter how well intended their gallant stimulus efforts. PQ Wall was fond of saying, “Politics destroys the money world.” The riots sweeping the world and subsequent tumbling markets demonstrate this observation. 

The analytical power of the four-season approach to long wave analysis is clear on this chart. It is also clear on this chart that global stock markets are in the midst of a winter season rally that will surely wane. The spring and fall are seasons of corporate efficiency, which drive corporate profits and stock market gains. The summer and winter are seasons of corporate inefficiency, where overproduction and excess debt are a drag on the profits of the global economy. More debt is not the solution. It is winter, but spring is coming. 
Long Wave S&P Inflation Adjusted 20 Year 
To understand the dynamics of business cycles, and how they fit in long waves, a closer look is required at the length of a regular business cycle. Most analysts have observed that the business cycle typically does not manifest in exact lengths, fluctuating within a range. Kitchin himself believed they averaged 40 months. In the footnote on page 174 of the two-volume 1939 edition of Business Cycles, Schumpeter conveys that the most valued assistant that Kitchin ever had:
“threw up his hands in holy horror when he expressed himself satisfied, in a certain case, with a periodicity of 48 months as showing the presence of the 40-month cycle.”
Many market cycle analysts have experienced this same frustration in grappling with cycles and their lack of consistent length, particularly the regular business cycle. Schumpeter provides additional review of research on the expected length of regular business cycles:
“The 40-month cycle, although first none too favorably received, has since acquired citizenship which, as we shall see, cannot reasonably be questioned. Professor Mitchell’s authority may, it seems, be appealed to for qualified support (op. cit. pp. 339 and 385), based upon analysis of five American systematic series (among them, two of clearings and one of deposits) for 1878-1923, which gives a mean duration (of cycles in general) of 42.05 months with a standard deviation of 12.37 months, while the median is 40 months.”
It is important to note that Kitchin, Mitchell and Spengler were analyzing business cycle data from the late 1800s and early 1900s, most of the business cycles they studied occurred prior to the creation of the Federal Reserve System. This was also a time before government interventionism and central banks began a systematic attempt to stamp out business cycles, blaming their existence on animal spirits. The conviction remains that such animal spirits can be appeased, with appropriate Keynesian black magic. Research by Jay Forrester in the System Dynamics program at MIT indicates that such intervention makes business cycles and long waves run longer, only delaying the day of reckoning.

A dynamic approach to business cycles suggests the radical notion that there is such a thing as natural length that produces an ebb and flow to business cycles, and that cycles fluctuate around that natural length. Cleary business cycles are running longer than their natural lengths since central banks and governments began to come to the rescue. This fact is important for any dynamic analysis of business cycles. Since this long wave began in 1949 the Kitchin cycle has averaged almost exactly 48 months.

The 48 month of the election cycle clearly has produced a gravitational pull since the politicians have used their post-depression intervention to try and stamp it out, especially in election years. Based on 2008, the politicians appear to have lost control of the business cycle, and now Russian economist Kondratieff is in the driver’s seat of international free market capitalism. The mother of all business cycles, driven by the U.S. housing bubble, crashed and burned into the March 2009 low. Forget the animal spirits; Nikolai Kondratieff is now at the wheel of a global overproduction and debt crisis that threatens a global trade war. Once we return to truly limited government, and it is coming, the business cycles will return to a natural shorter rhythm.
    
In the 1990s, I began researching business cycles and their corresponding stock market cycles in pursuit of the “natural” or ideal length of cycles. This was accomplished by searching for hits on Fibonacci ratios around a specific length. Using the logic presented above regarding the 42.05-month mean length of the cycle and other literature an exact 42-month cycle was tested. I was looking for Fibonacci ratio deviation hits from that ideal length in the real stock market data.

A 42-month Kitchin cycle produced many hits, often in the same week of the Fibonacci ratio date targets relative to the ideal target, or hits on or close to the Level 2 targets. The Level 2 targets are the Fibonacci targets between two Fibonacci targets. Below is the Kitchin cycle forecaster that shows a direct hit on the fifth degree 14.589% Fibonacci ratio target in the Kitchin cycle that lasted from the low on 10/8/1998 to the low on 10/10/2002. It produced an exact date hit. If you recall those two days, they were important stock market cycle lows that ended the old and began the new Kitchin cycle. The stock market cycles do not match the economic business cycles exactly.  
 Kitchin Cycle Forecaster 
The Kitchin cycle is a cycle that investors need to pay close attention to at all times. The Kitchin cycle rolls over 16 times every long wave, and wreaks havoc with investors and traders. What is most interesting for traders is that every Kitchin cycle divides into nine Wall cycles. Investors and traders will recognize this cycle as the 20-week cycle. 

Using the 42-month “ideal” cycle makes the “ideal” or “natural” Wall cycle 141.9-days. Like the Kitchin cycle, the Wall cycle tends to fluctuate in Fibonacci ratios around the ideal lengths. Since monetary and fiscal stimulus is expanding the Kitchin cycles, and making them run long, it is also expanding the Wall cycles. They often run long in exact Fibonacci ratio extensions. Below is the cycle forecaster for the Wall cycle that began on July 8, 2009 and ended on February 5, 2010. All Wall cycles are not all this accomodative with the Fibonacci Wall cycle bottom forecaster, but often come very close.   
Wall Cycle Forecaster 
Combining cycle tracking in time with Fibonacci ratio extensions of the natural stock market cycles with Fibonacci drill-down grids in price is the essence of cycle research. Investors and traders can track stock market cycles with these methods, providing for entry, exit and stop loss strategy to reduce risk and improve performance.

The global economy is now in a topping process in the final business cycle and stock market rally in the long wave that began in 1949. The long wave winter is the season of overproduction and debt deleveraging. The long wave winter season is in its final years, and they will be devastating for investors and traders that are not prepared.

Global stock markets face long wave forces into an expected late 2012 long wave bottom. An important global stock market top is in the cards, and it could be sooner rather than later. The final leg down of the long wave winter season will derail the global stock market rally and could financially devastate unsuspecting investors and traders. The approach to long wave cycle analysis described in this article is fully explained in Jubilee on Wall Street (2009).    

Tracking the global stock market cycles in price and time is essential for serious investors and traders. Joseph Schumpeter was a remarkable business cycle analyst, but the late great stock market cycle analyst PQ Wall wins the long wave business cycle count debate. There are 16 business cycles in a long wave. The current and last Kitchin cycle in this long wave is set up to roll over into 2012.


Stock Market Investor Sentiment and a Quick Dow Theory Update


Sentiment alone is not a timing tool for the market.  But, it is useful in telling us when too many people get on the same side of the boat, which in turn tells us that conditions have ripened for a turn.   I have said many times of late that the recent sentiment environment reminded me of the 2006 and 2007 period.    In the chart below I have included the S&P 500 and a sentiment indicator that is comprised of the Investor Intelligence Bulls divided by Bulls plus Bears.  In other words, this shows us the percentage of Bulls to total Bulls and Bears.  Now, note on the chart below that during the 2007 period when this reading rose above 72%, an intermediate-term top soon followed.   

Now note that since the March 2009 low, every time the percent of Bulls rose above the 72% level an intermediate-term top has been at hand.  Again, sentiment readings are not timing tools, but this is telling us that conditions have been ripe for another intermediate-term top and based on the price action this past week, that top may very well be in place.  I will have to look at other indicators after the weekly close in order to determine if an intermediate-term sell signal has indeed been triggered and I will report this in my subscriber updates.   If it proves the market has in fact made an intermediate-term top, then the correction that follows should carry this sentiment indicator down toward the 50% mark.   More importantly, once price moves into our timing band for the next intermediate-term cycle low, along with these lower sentiment readings we will be able to zero in on the next intermediate-term low and buying opportunity. 
 

In the next chart below I have included both the Dow Jones Industrials and the Transports.   In light of the recent weakness, the Transports have shown more relative weakness than the Industrials.    I have again received questions as to whether this relative weakness has any forecasting value from a Dow Theory perspective.   The answer is no.  When considering Dow theory it is the movement of both averages above or below previous secondary high points that is important.  To consider only one average or to try to infer a meaning from the movement of only one average is not Dow theory.
   
If this correction should carry both averages below the January 28th lows, on a closing basis, then the next error I see coming from a Dow theory perspective will be that people will be mistakenly calling such price action a Dow theory “Sell Signal.”   Granted, any violation of the January lows should be followed by further weakness.  But, any such weakness will be associated with a decline into the next Secondary Low Point and not a Dow theory “sell signal.”  So, I want to warn you ahead of time, do not listen to any such comments that you may see or hear in regard to any such weakness because it will not be correct in accordance with orthodox Dow theory.
     

I have begun doing free market commentary that is available at www.cyclesman.info/Articles.htm   The specifics on Dow theory, my statistics, model expectations, and timing are available through a subscription to Cycles News & Views and the short-term updates.  I have gone back to the inception of the Dow Jones Industrial Average in 1896 and identified the common traits associated with all major market tops.  Thus, I know with a high degree of probability what this bear market rally top will look like and how to identify it.  These details are covered in the monthly research letters as it unfolds.   I also provide important turn point analysis using the unique Cycle Turn Indicator on the stock market, the dollar, bonds, gold, silver, oil, gasoline, the XAU and more.   A subscription includes access to the monthly issues of Cycles News & Views covering the Dow theory, and very detailed statistical-based analysis plus updates 3 times a week.

Continue reading this article >>

A Warning Shot For Investors?


Many important global stock markets, including China, Brazil, India and Hong Kong, have been in fairly significant corrections since November, down between 12% and 17%. Their major concerns have been rising inflation and the resulting monetary tightening by their central banks to combat the inflationary pressures.

The U.S. market has had no such worries, and has continued its non-stop bull market to new highs.

But it did stumble a bit this week, spooked by the spike-up in oil prices created by the spreading unrest in oil-producing countries, notably Libya. Yet in the week’s decline the Dow and S&P 500 fell less than 3%, hardly a blip on the long-term charts.

And short-term, the next ‘monthly strength period’ has arrived, when the market tends to be positive for the five-day period from the last trading day of the month through the first four days of the following month.

As I have written before, it is a quite consistent pattern. For instance, in 2010 the S&P 500 gained 143 points, or 12.8% for the year, but its gains on just the first three days of each month amounted to 229 points, or 20.5%. The pattern has pretty much continued so far this year, with nice gains in the first weeks of both January and February.

That raises the odds for a return to a positive market next week.

Yet, the events of the past week may have been a warning shot. There had already been enough potential catalysts for a market correction. This week added several more.

As most investors are aware, investor sentiment has been at levels of bullishness and confidence usually seen near market tops. And the major market indexes are as over-extended above their long-term 200-day moving averages as they usually get without at least a 10% to 12% correction down to retest the support at those moving averages. As noted, many important global stock markets, including China, Brazil, India and Hong Kong, have been in fairly significant corrections since November, and global markets, including the U.S., tend to move in tandem with each other in both rallies and corrections.

Now we have spiking oil prices. The 2003-2007 bull market ended in October, 2007 when the price of oil reached $96 a barrel. The 2007-2009 recession began three months later. After trading briefly above $100 a barrel on Thursday oil pulled back, but was still trading around $97 at the week’s end.

On Thursday it was reported that new home sales plunged an unexpected and huge 12.6% in January. It was not a good start for this year, after 2010 was the worst year for new home sales in almost half a century. Not providing much encouragement for coming months, it was also reported that applications for mortgages are at a 15-year low.

Then, on Friday it was reported that the economy was even weaker than previously thought in the December quarter. Gross Domestic Product (GDP) growth for the quarter was unexpectedly revised down to only 2.8% from the previously reported 3.2%.

These events and reports - turmoil in the oil-producing countries that is more likely to spread than go away; spiking oil prices that tend to cut into U.S. economic growth (and add to global inflation pressures); news that the economy grew significantly slower in the 4th quarter than previously thought – were more than enough reasons for the market to nosedive this week. But it only stumbled for a few days.

Yet it was enough to cause some concern and nervousness. That could be seen in the sharp drop in bullish investor sentiment, and the upturn in the number of pundits declaring the end of the bull market. The poll of its members by the American Association of Individual Investors (AAII) this week shows the percentage of those who are bullish plunged to just 36.6% from readings above 50% just three weeks ago, and the near record high of 63% in late December.

Sentiment does reverse from high levels of bullishness near tops to increasingly pessimistic expectations as corrections develop.

So was this week’s stumble the beginning of a more serious correction?

The events and reports this week did provide more evidence that the stock market may be ahead of reality regarding prospects for the economy, and therefore corporate earnings, going forward, which should at least limit the market’s upside potential.

Limited upside potential – more downside risk?

It might be wise to lighten up some into strength that may develop over the next few days during the ‘monthly strength period’. Continue reading this article >>

Global cotton usage to rise by 3% during 2011-12

by Commodity Online

Global cotton usage will expand by 3 percentage during 2011-12 fiscal, said the USDA.

In its latest report the USDA said cotton consumption will in 2011-12, for a second successive season, break with history and fall behind world economic growth, expected to reach 4-5 percent in 2012.

Traditionally, the figures have moved in step, a reflection of cotton's use in clothing, largely an item of choice, rather than in food, like other farm commodities.

Indeed, in the five years before the world recession the world economy expanded by 4.6% a year, and cotton consumption by 4.7%.

However, next season, the tie will be broken by mills' enthusiasm to rebuild inventories depleted by the shortfall in supplies this season, and a slowdown in clothing demand as soaring cotton prices, which hit a record earlier this month, feed through to retailers.

High prices will also provoke a continued shift demand to polyester, which is roughly twice as cheap compared with cotton as it was five years ago.

The consumption lag, coupled with the prospect of a cotton values inspiring a strong rebound in production, will enable world inventories to jump by 17.5% to 50.3m bales.

At this level, stocks would represent 42% of consumption, a large rise on this season's 32% figure, but "low relative to the recent average", Mr Johnson told the USDA Outlook Forum.

The stocks-to-use ratio, a widely used metric for gauging the availability of a crop and therefore its pricing potential, suggested a drop in values, as measured by the Cotlook A index from an average of 175 cents a pound in 2010-11 to 1.35 cents a pound next season.

The index stood at 209.30 cents a pound on Friday, down 6.45 cents on the day, and below a record high hit earlier this month.

And cotton prices may fail to revisit their highs, if falling prices encourage farmers, who have been stockpiling the fibre in the hope of selling out at the top, to cash in, Rabobank analysts said.

"The possibility exists that the declining values actually encourage selling by producers who are worried about further price weakness," the bank said.

"A surge in selling along with likely bullish indications of large northern hemisphere plantings may mean that, without a disruption in production, values may find it difficult to revisit the recent highs."

Nonetheless, the fibre was set to find support from bargain-hunting speculators, and from trade buyers, "once it looks like prices have bottomed out".

And with supplies thin until the next harvests are in the bag, "volatility and sharp moves are likely to continue over the coming months".

In New York, cotton for March delivery gained 2.2% to 185.34 cents a pound, looking for its first rise in five trading days.
The better-traded May lot was 1.9% up at 180.52 cents a pound.


Continue reading this article >>

Bring Champagne and Caviar, The Sell Off is Over, Right?

by Greg Harmon

The Holiday shortened week saw the first measurable pullback in the market since November. With the broad indexes recovering more than 50% of the losses by the end of the day Friday everyone was breathing a sigh of relief. The bull market can continue on to new highs. A look at the daily charts for the SPDR Sector funds gives the same conclusion. Each has a rising price trend, a Relative Strength Index (RSI) that has either bounced off of the low and is moving back higher off of the mid line or back to it, and a Moving Average Convergence Divergence (MACD) indicator that had moved lower but is leveling or improving. The two exceptions to this are the Energy Select Sector SPDR, XLE, which just keeps going up, and the Utilities Select Sector SPDR, XLU which remains in a downward channel. Time for the Champagne and Caviar.


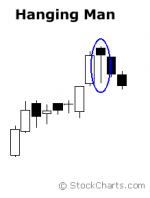
Unless you decide to look at the weekly charts. Oh, they are not signaling an imminent decline, but there are reasons for caution, the main culprit being the Hanging Man.  The Hanging Man reversal candlestick pattern, shown below, shows up in 8 of the 9 SPDR Sector charts.  It is not a one period pattern, meaning that it needs to be confirmed with a lower candlestick the following period to signal a reversal.  But it does signal that there is a loss of momentum to the upward trend and the start of some selling pressure.  In that way it makes sense to see them given the pullback this week.
  
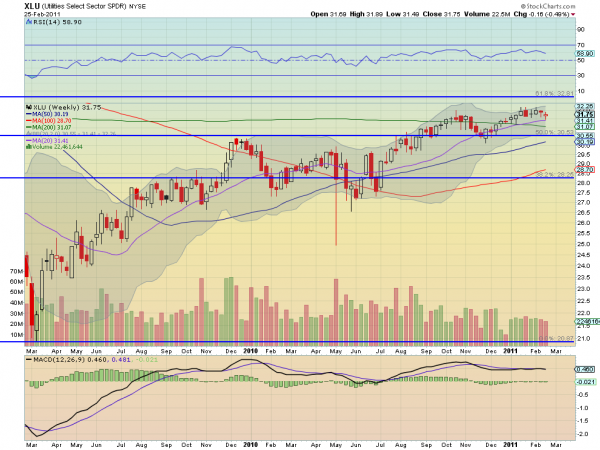
The worst example of this  is exhibited by the XLU. A quick look at the chart below shows that XLU actually printed a Hanging Man candlestick two weeks ago and it was confirmed with a lower candlestick print this week.  Coming after a nearly 2 year upward trend in the XLU it is something to pay attention to.

Utilities Select Sector SPDR, XLU

The seven other SPDR Sector funds that printed a Hanging Man this week include Materials, Energy, Financials, Industrials, Technology, Health Care and Consumer Discretionary (XLB, XLE, XLF, XLI, XLK, XLV, and XLY respectively). The weakest of these is in XLF as it has the shorted and least powerful trend higher. The Hanging Man candles for XLB, XLI, XLK, XLV, and XLY are more troublesome as their runs higher have lasted longer and been more powerful. All 6 of these candlesticks occurred below the high that was set the previous week. Because of that they are not as worrisome as the one in XLE, chart below.

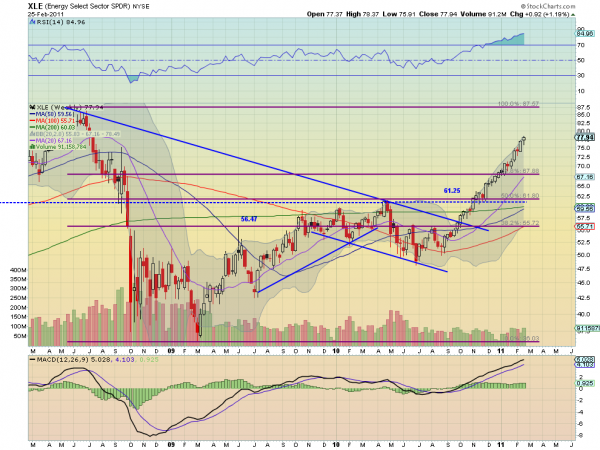
Energy Select Sector SPDR, XLE

Notice that the Hanging Man here occurred at new highs. This does not mean that XLE is going to head lower or that it has a greater chance of going lower than the other sectors. What is of interest is that there was selling pressure at the highs in a strong uptrend. The RSI at nearly 85 is another signal that corroborates the caution signal put out by the Hanging Man. 

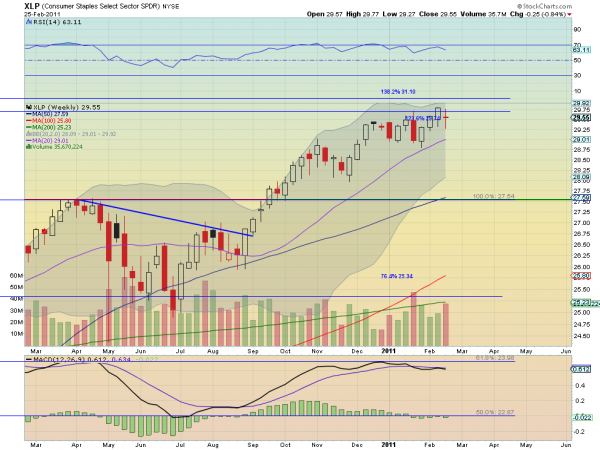
That leaves just Consumer Staples Sector SPDR, XLP, to discuss. There are caution flags here as well, just of a different variety. This chart printed a Long Legged Doji candlestick. This candlestick signals indecision as there was a lot of back and forth ending up virtually unchanged from where it started. 
Indecision means uncertainty and therefore requires caution too, which is reinforced by the slightly falling RSI and slightly negative MACD.

Consumer Staples Select Sector SPDR, XLP

So caution is warranted across all sectors despite the big rally on Friday. What should you do Monday? First put the Champagne and Caviar back on ice. Then look to protect your gains. Take some profits, buy some put protection or tighten your stops, if you have not already. The uptrend is not dead, but it did get caught up this week. Be prepared in case the noose tightens on the Hanging Men sending it lower.

Continue reading this article >>

WHEN IRISH EYES ARE VOTING

by John Mauldin

Most of the world is focused on the Middle East and Libya, and rightly so. We will look at that in a minute. (Sidebar: the White House spelled the country “Lybia” in a recent tweet. Can you imagine what the liberal media would have done to poor Dan Quail if that tweet was from him? Just saying.) And I agree the Middle East is important. But my eyes are focused on what I think is the far more important event of the day, and that is the election going on in Ireland.

I have written about Ireland before, but we need to once again focus on what are not smiling Irish eyes. Ireland was once the envy of Europe, with one of the highest growth rates in the world. It was not long ago that Ireland could borrow money at lower rates than Germany. Now rates are 6% and likely to rise with the new government. Let’s look at a few data points from a brilliantly written article by Michael Lewis, who ranks as one of my favorite writers. When he writes, I read it just for the education on what great writing should look like, as well as for the always fascinating information. The article is at http://www.vanityfair.com/business/features/2011/03/michael-lewis-ireland-201103 .

(I am often asked about how you can become a financial writer by young people who are starting out. I have just two suggestions. Write a lot and then write some more. Writing is no different than the piano or guitar. It takes a lot of practice, and then more practice. You don’t start playing concerts on day one, and your writing won’t be worth much either, but you will get better. Second, study the great writers and learn from them. Try to copy the styles of the guys you like for practice. Take the best and make it your own style. Lewis is one of the best.)

· Housing prices in Dublin had risen by 500% since 1994. Rents for homes were often 1% of the price of the home. A $1-million-dollar home went for $833 a month. That is a very clear bubble.

· Irish home prices implied an economic growth rate that would leave Ireland, in 25 years, three times as rich as the United States.

· In 1997 the Irish banks were funded entirely by Irish deposits. By 2005 they were getting most of their money from abroad. The small German savers who ultimately supplied the Irish banks with deposits to re-lend in Ireland could take their money back with the click of a computer mouse. Since 2000, lending to construction and real estate had risen from 8 percent of Irish bank lending (the European norm) to 28 percent.

One hundred billion euros—or basically the sum total of all Irish public bank deposits—had been handed over to Irish property developers and speculators. By 2007, Irish banks were lending 40 percent more to property developers than they had to the entire Irish population seven years earlier.

· As the scope of the Irish losses has grown clearer, private investors have been less and less willing to leave even overnight deposits in Irish banks and are completely uninterested in buying longer-term bonds. The European Central Bank has quietly filled the void: one of the most closely watched numbers in Europe has been the amount the ECB has loaned to the Irish banks. In late 2007, when the markets were still suspending disbelief, the banks borrowed 6.5 billion euros. By December of 2008 the number had jumped to 45 billion. 

As Burton spoke to [Lewis], the number was still rising from a new high of 86 billion. That is, the Irish banks have borrowed 86 billion euros from the European Central Bank to repay private creditors. In September 2010 the last big chunk of money the Irish banks owed the bondholders, 26 billion euros, came due. Once the bondholders were paid off in full, a window of opportunity for the Irish government closed. A default of the banks now would be a default not to private investors but a bill presented directly to European governments.

· A political investigative blog called Guido Fawkes somehow obtained a list of the Anglo Irish foreign bondholders: German banks, French banks, German investment funds, Goldman Sachs. (Yes! Even the Irish did their bit for Goldman.)

· [And this is the kicker!] “Googling things, Kelly learned that more than a fifth of the Irish workforce was employed building houses. The Irish construction industry had swollen to become nearly a quarter of the country’s G.D.P.—compared with less than 10 percent in a normal economy—and Ireland was building half as many new houses a year as the United Kingdom, which had almost 15 times as many people to house.” [That makes the US housing bubble look small by comparison.]

· And just for fun: “A few months after the spell was broken, the short-term parking-lot attendants at Dublin Airport noticed that their daily take had fallen. The lot appeared full; they couldn’t understand it. Then they noticed the cars never changed. They phoned the Dublin police, who in turn traced the cars to Polish construction workers, who had bought them with money borrowed from Irish banks. The migrant workers had ditched the cars and gone home. Rumor has it that a few months later the Bank of Ireland sent three collectors to Poland to see what they could get back, but they had no luck. The Poles were untraceable: but for their cars in the short-term parking lot, they might never have existed.”

Now, let’s turn to that repository of all things leftist, the UK Guardian, as they write about today’s elections.

An Extra “15 Million” Homes

“Though the campaign has shed disappointingly little light on realistic options ahead, the financial numbers are scary. After 2000 the early Celtic Tiger years became a property-led speculative bubble, made worse by weak planning laws and 300,000 too many new homes. The crash saw GDP collapse by 11%, unemployment triple to 13.3% and government debt quadruple to 95%, which will rise to 125% by 2014 on IMF estimates.”

Let’s think about that for a moment and compare it to the US. We built somewhere between 2 and 3 million too many homes in our bubble, depending on whom you ask. Total Irish population (including Northern Ireland) is 6 million people. If the US had built the same number of excess homes, there would have been 15 million of them! And the banks just kept lending!

Irish taxpayers are being asked to pay French, German, and British bond banks and the ECB, which bought that debt. It is 30% of their GDP, along with the rest of the debt. At 6% interest, that means it will take 10% of their national income just to pay the interest. It guarantees that Ireland will be in a poverty cycle for decades. The ECB and the IMF seem to think the solution for too much debt is more debt. And in order to pay the ECB, the Irish must take on an austerity program that guarantees even worse recessions and higher unemployment.

The government that agreed to take on the bank debts is going to be voted out in spectacular fashion today. Whether one party can win or has to form a coalition government is not yet clear, but the mandate is to renegotiate the Irish debt. Both the ECB and the Germans have said that is not possible, that deals have been made. But asking Irish voters, you don’t get the sense they feel the same obligation.

Even the venerable Martin Wolf of the Financial Times agrees. Writing last week:

“So what might a new government seek to do? Its degrees of freedom are, alas, limited. Even excluding recapitalisation of the banks, the primary fiscal deficit (before interest payments) was close to 10 per cent of GDP last year. Under the IMF programme, this is to be turned into a surplus of 1.5 per cent of GDP by 2015. Given the lack of access to private markets, the deficit would have to be eliminated even more quickly without the official assistance. Again, the debt overhang would be huge, under any plausible assumptions. Ireland is doomed to fiscal stringency for decades, given its poor growth prospects, at least in comparison with its Tiger years.

“Apart from the Armageddon of a sovereign default, two partial escapes exist. The more trivial would be a reduction in the rate of interest on Ireland’s borrowing: a 1 per cent reduction in the rate of interest would save the state 0.4 per cent of GDP a year. That would be a small help, at least. A more valuable possibility would be a writedown of existing subordinated and senior bank debt, which currently amounts to €21.4bn (14 per cent of GDP).

“The ECB and the other members of the European Union have vetoed this idea, fearful of contagion. Indeed, the assistance package was partly to prevent just such an outcome. Yet the idea that taxpayers should bail out senior creditors of massively insolvent banks at such risk to the solvency of their state is both unfair and unreasonable. If the rest of the EU is determined to protect senior creditors, it should surely share in the cost of doing so. Why should the taxpayers of the borrowing country pay all? The new Irish government should make this point firmly.” (http://www.ft.com/cms/s/0/436234b8-3ebb-11e0-834e-00144feabdc0.html#ixzz1F1aZpM1L)

There are a significant number of Irish voters who wonder why they should pay any of it. Not the majority (yet), but enough. This is the Maginot Line for the ECB. If they renegotiate with Ireland, then Greece will be at the door in a heartbeat. Ditto for Portugal.

As one story I read about Ireland said, “Parties we go to now are going away parties as people, especially young people, leave for other countries with better opportunities.” The mood of the country will grow more dour.

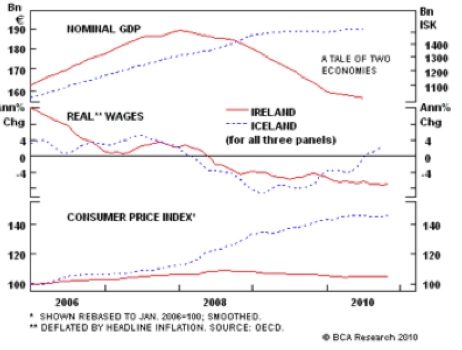
Look at this chart. Notice how well Iceland did after it simply repudiated its debt. It wasn’t easy, and inflation is brutal, but they are better off than if they had taken on a debt burden that would have made them indentured servants to British taxpayers for decades. The ECB, the IMF, and the rest of the EU is asking Ireland to willingly fall into a lengthy depression. Would walking away from the debt, or restructuring it, be any worse?
What if the opening negotiating line started was, “We will repay the principle, but no interest, and the timeline has to be stretched out over 25 years?” And no payments for five years. Oh, and we have about 300,000 houses you can have as our first payment.

Yes, the Irish would be frozen out of the bond market. It would result in an even more serious recession. But they could actually grow their way out of it over time. A lot faster than if they were trying to pay off the debt at 6-7% interest. And remember that Argentina, for God’s sake, got money just a few years after defaulting – twice, if I remember right! If Ireland got back on a sound footing, they could once again find acceptance in the bond market.

I know, that sounds radical. But give it a few years of austerity and see what the next elections bring. Irish debt will default, not because the Irish don’t have hearts of gold or don’t want to not pay their debts, but because they are under such a burden they can’t. And eventually enough voters will realize that. It may not be next month, or even next year, but it will come. You can only ask so much of a people. Defaulting on sovereign debt is only unthinkable in elite European Union circles. And asking German voters to pay for those defaults? Care to run on THAT platform?

This has the potential to really roil the debt markets, not to mention the interbank markets. The US is doing ok, except that job creation has been slow. A European debt crisis could throw a wrench into the world gears.

And that is the heart of the problem. The Irish really do want to do the right thing. The Greeks, not so much. Portugal? Spain?

The leadership of the EU is living in denial if they think that more debt is the answer to too much debt. It is all well and good for the Germans to tell everyone to cut back (and they should) but to do so means that the countries go into recession and have even less money to pay their debt burdens. They get into a debt spiral and the only way out is restructuring, which is default by a nice name.

Somewhere, sometime, this is all going to end in tears. The EU will be better off restructuring the debt, letting insolvent banks go the way of all flesh, or financing them and letting the euro drop like a stone, which will only make their exporting companies more competitive (not good for the US and China, but we don’t get to vote in the EU). Or they can break up. I think the former is better than the latter, but that’s just me.

The world went crazy with debt. The US, Japan (where I fly to in less than 12 hours), much of Europe, and Great Britain. And now we have to deal with it. Acting like adults would be best, and recognizing that some countries just can’t assume their banking debts is just being realistic. A lot of people made bad choices and now those choices are coming home.

It is all so very sad. People are hurting. I read the blogs in Ireland and it brings tears to me Irish eyes (or the large part of me that is of Irish heritage).

There are no easy answers. No easy button. The only button we have is the reset button, for the Blue Screen of Death. That means pulling the plug and starting over. This time with realistic debt levels and bond markets.

Some Thoughts on the Middle East

Let me offer a different, and perhaps cynical, view of what’s happening in the Middle East. First, the army was in control in Tunisia and Egypt, and still is. Some things will change, and hopefully the false, crony capitalism will be one of the things to go; but I don’t think we will see sweeping changes for some time. Libya is 2% of the world’s oil supply. Other than that, they are like Greece. They are not that big a player. Gaddafi is on his way out. His bank accounts are being frozen. He will end up in Venezuela or some equally wonderful place. Couldn’t happen to a nicer bad guy. The new leadership will most likely be the army, and it will get the oil turned back on as soon as possible. (See the trend here?)

By the way, the idea that Saudi Arabia can make up for Libyan oil is a little fanciful. Libyan oil is light sweet crude, and it takes three barrels of Saudi oil to make as much diesel as Libyan oil. Oil could get very volatile and move up strongly if Gaddafi hangs on too long. $4 gas is not out of the question here in the US if he doesn’t leave soon; but at the end of the day, not too much will change in Libya.

The key place to watch is Bahrain. Now THAT is an issue. It is a strategic country with the US 5th fleet based there, and it has a large Shiite population that could ally with Iran. There is no real way of knowing what will happen there, and that is something I have my Google notes set to watch, along with talking from time to time with George Friedman of Stratfor. Nice to have friends with inside information. But even he is not sure tonight.

Saudi Arabia? Pay attention, but so far it looks like the changes are still in the future. One day it will change, but it doesn’t appear imminent (although anything can happen).

The one thing that I hope changes? Maybe the Iran street will force some change. I am on record saying that one day Iran will be our new best friend. The population is young and getting younger. They’re on the Internet. They see what the world is like and they want it. Maybe not this year or next, but it will happen.

MARKET VOLATILITY REQUIRES A SELL STRATEGY

by Charles Rotblut

Downside volatility returned to the markets this week, as unrest in Libya (and Bahrain, Yemen, etc.) caused oil prices to hit $100 in the U.S. for the first time in two years. The result was a notable daily drop in stock prices. The S&P 500 posted its fifth daily move of 1% or more since December 3 on Tuesday.

Ironically, the drop occurred the same day I read two research reports that discussed the possibility of a market correction. In addition, over the weekend, I noticed that the valuations of the stocks identified by my personal screen were not as cheap as they were a few months ago. (The screen is based on the 10-point stock scoring system presented in my book, Better Good than Lucky, and was detailed in the December AAII Journal.) However, both the reports and the screen results were coincidental with this week’s decline.

I cannot tell you whether we are on the verge of a near-term pullback in stock prices with any more accuracy than I can tell you which college basketball teams will make it to this year’s Final Four. I can tell you, however, that even the strongest of bull markets experience short-term declines (making any forthcoming pullback a normal event), and that my Kansas Jayhawks have the potential for a big run in the NCAA tournament.

Clearly there are risks if oil prices continue rising. However, over the long term, stocks compensate you for putting up with shorter-term volatility. There are always crevices on the proverbial wall of worry that stocks often climb. That does not mean you should keep one finger hovering over the sell button, however. Quite the opposite;you should be ready to leave your diversified portfolio unchanged while maintaining a plan for dealing with unwanted events.

An effective strategy for keeping your emotions out of your investing decisions is to write down the reasons you would sell an investment before you buy it. You will have the least amount of emotional attachment to a stock (or a bond, ETF, mutual fund, etc.) before you own it and will be most cognizant of its potential risks. You won’t be able to identify everything that could possibly go wrong, but you should have enough knowledge about an investment’s risks to give yourself a pretty good game plan.

I use a spiral notebook to do this. You could use whatever medium works best for you—a pad of paper, a smart phone, a PC, etc. It does not matter; your goal is to get the reasons for selling out of your head and onto something permanent. Doing so will give you a rational strategy you can depend on when the market gets volatile. Plus, you are not depending on your memory to determine what your sell strategy is.

Just knowing you have an exit plan can provide a boost of confidence when you need it. A plan for selling can also keep you from making reactionary market timing decisions, thereby allowing you stay focused on your long-term goals. As much as possible, you want to be a proactive investor, not a reactive investor.

You can’t predict the future, but you can have a strategy for dealing with uncertainty.

RULES FOR SELLING

The most basic rule of stock investing is to sell when the reason you bought the stock no longer applies. This can mean the valuation has gone from low to high, business conditions have deteriorated, growth is slowing, or that a company’s strategy has failed to positively adapt to a changing marketplace. I personally also look out for downward revisions to earnings estimates and negative news events, as well as relying on price targets to force me to reevaluate my investments.

Though there are underlying commonalities, rules for selling differ depending on the type of investing style. For example, AAII Founder James Cloonan has his own specific rules for managing the Shadow Stock Portfolio, our small- and micro-cap stock portfolio.

Continue reading this article >>

Follow Us