Sunday, July 10, 2011
Europe Scrambles To Deal With Italy Contagion Fallout, Calls Emergency Meeting As Former ECB Official Says "Very Worried About Italy"
by Tyler Durden
As was reported last week, Europe has suddenly found itself shocked, shocked, that the bond vigilantes decided to not pass go and go directly to the purgatory of the European core, in the form of the country that, at €1.5 trillion euros, has more debt than even Germany, but far more importantly, has a debt/GDP ratio of over 100%, and has the biggest amount of net notional CDS outstanding (not to mention that it has dominated Sigma X trading for the past several weeks). Italy. On Friday we explained why things are about to get really ugly for the boot as a flurry of bond auctions is now imminent. Which is why it was not surprising to read that tomorrow morning the European Council has called an emergency meeting "of top officials dealing with the euro zone debt crisis for Monday morning, reelecting [sic; we assume Reuters means reflecting] concern that the crisis could spread to Italy, the region's third largest economy." Newsflash: the crisis has spread to Italy. And it will only get worse at this point as Spain is largely ignored for now (until its own mortgage crisis starts making daily headlines like this one, however, where courtesy of the insolvent Cajas which are simply a GSE waiting to be nationalized, the can will be kicked down the road for at least 6-9 months ) and the vigilantes start dumping Italian debt and buying up every CDS available and related to Italy. "We can't go on for many more days like Friday," a senior ECB official said. "We're very worried about Italy." But, but, didn't Draghi just say Italy's banks will pass the second, "far more credible" stress test en masse? Welcome to the second, and final, part of the European insolvent dominoes contagion, the one which culminates with everyone bailing each other out... and the death of the euro currency of course.
As a reminder, this is the key chart that matters vis-a-vis Italy.
More from Reuters:
European Central Bank President Jean-Claude Trichet will attend the meeting along with Jean-Claude Juncker, chairman of the region's finance ministers, European Commission President Jose Manuel Barroso and Olli Rehn, the economic and monetary affairs commissioner, three official sources told Reuters.
The talks were organized after a sharp sell-off in Italian assets on Friday, which has increased fears that Italy, with the highest sovereign debt ratio relative to its economy in the euro zone after Greece, could be next to suffer in the crisis. A second international bailout of Greece will also be discussed.
We reported on the UniCredit collapse, but here it is again:
Shares in Italy's biggest bank, Unicredit Spa, fell 7.9 percent on Friday, partly because of worries about the results of stress tests of the health of European banks that will be released on July 15. The leading Italian stock index sank 3.5 percent.
The market pressure is due partly to Italy's high sovereign debt and sluggish economy, but also to concern that Prime Minister Silvio Berlusconi may be trying to undermine and even push out Finance Minister Giulio Tremonti, who has promoted deep spending cuts to control the budget deficit.
"We can't go on for many more days like Friday," a senior ECB official said. "We're very worried about Italy."
Greece or Italy? Pick one.
Monday's emergency meeting will precede a previously scheduled gathering of the euro zone's 17 finance ministers to discuss how to secure a contribution of private sector investors to the second bailout of Greece, as well as the results of the stress tests of 91 European banks.
Back to "square one."
A senior euro zone official told Reuters on Friday that rather than progress being made in the talks with the IIF, as IIF managing director Charles Dallara has said, all sides were close to being "back to square one."
Dallara will attend the meeting of euro zone finance ministers in Brussels on Monday.
Since the euro zone's debt crisis erupted last year, the region's rich governments have aimed to isolate it to Greece, Ireland and Portugal, which have signed up to bailouts totaling 273 billion euros -- a sum that is small compared to the financial resources of the zone as a whole.
Spain, commonly seen as the next potential domino in the crisis, has managed to retain its access to market funding through fiscal reforms. But because of the large sizes of the Spain and Italy, pressure on the euro zone would increase dramatically if those countries eventually needed financial assistance.
Actually make that square minus one. So as Europe scrambles to convince itself it is not insolvent, America is doing the same across the pond. And when everything comes crashing down, as it will, once again nobody "will have been able to predict any of this."
Etichette:
articles,
Economy article,
Finance article,
market articles
Exclusive: EU calls emergency meeting as crisis stalks Italy
By Luke Baker
European Central Bank President Jean-Claude Trichet will attend the meeting along with Jean-Claude Juncker, chairman of the region's finance ministers, European Commission President Jose Manuel Barroso and Olli Rehn, the economic and monetary affairs commissioner, three official sources told Reuters.
Van Rompuy's spokesman Dirk De Backer said: "It's a coordination, not a crisis meeting." He added that Italy would not be on the agenda and declined to say what would be discussed.
However, two official sources told Reuters that the situation in Italy would be discussed. The talks were organized after a sharp sell-off in Italian assets on Friday, which has increased fears that Italy, with the highest sovereign debt ratio relative to its economy in the euro zone after Greece, could be next to suffer in the crisis.
A second international bailout of Greece will also be discussed, the sources said.
The spread of the Italian 10-year government bond yield over benchmark German Bunds hit euro lifetime highs around 2.45 percentage points on Friday, raising the Italian yield to 5.28 percent, close to the 5.5-5.7 percent area which some bankers think could start putting heavy pressure on Italy's finances.
Shares in Italy's biggest bank, Unicredit Spa, fell 7.9 percent on Friday, partly because of worries about the results of stress tests of the health of European banks that will be released on July 15. The leading Italian stock index sank 3.5 percent.
The market pressure is due partly to Italy's high sovereign debt and sluggish economy, but also to concern that Prime Minister Silvio Berlusconi may be trying to undermine and even push out Finance Minister Giulio Tremonti, who has promoted deep spending cuts to control the budget deficit.
"We can't go on for many more days like Friday," a senior ECB official said. "We're very worried about Italy."
Monday's emergency meeting will precede a previously scheduled gathering of the euro zone's 17 finance ministers to discuss how to secure a contribution of private sector investors to the second bailout of Greece, as well as the results of the stress tests of 91 European banks.
GREECE
Greece is already receiving 110 billion euros ($157 billion) of international loans under a rescue scheme launched in May last year but this has failed to change market expectations that it will eventually default on its debt.
Senior euro zone officials worry that progress toward a second Greek bailout, which would also total around 110 billion euros, is not being made quickly enough and that the delay is poisoning investors' confidence in weak economies around the region.
"We need to move on this in the next couple of weeks. It's not a case of waiting until late August or early September as Germany is saying. That's too late and markets will make us pay for it," a top euro zone official told Reuters on Saturday.
German officials insist they too want to put together the second Greek bailout as quickly as possible, but the private sector's contribution is proving to be a major sticking point.
Germany, the Netherlands, Austria and Finland are determined that banks, insurers and other private holders of Greek government bonds should bear some of the costs of helping Athens. But more than two weeks of negotiations with bankers represented by the Institute of International Finance (IIF), a lobby group, have made next to no progress on agreeing a formula acceptable to all sides.
Initially talks focused on a complex French plan for private creditors to roll over up to 30 billion euros of
Greek debt, buying new bonds as their existing ones matured. Around half of proceeds from Greek bonds maturing before the end of 2014 would be rolled over into very long-term debt while 20 percent would be put into a "guarantee fund" of AAA-rated securities.
But as that plan has floundered, Berlin has revived a proposal to swap Greek bonds for longer-dated debt that would extend maturities by seven years. Proposals to buy back Greek bonds and retire them have also been floated.
In a buy-back, the euro zone's bailout fund, the European Financial Stability Facility, might buy Greek bonds from the market, or the EFSF might lend Greece money to buy bonds. However, these schemes would require further changes to the EFSF's rules and would therefore have to go through national parliaments, an official source said.
SQUARE ONE
A senior euro zone official told Reuters on Friday that rather than progress being made in the talks with the IIF, as IIF managing director Charles Dallara has said, all sides were close to being "back to square one."
Dallara will attend the meeting of euro zone finance ministers in Brussels on Monday.
Since the euro zone's debt crisis erupted last year, the region's rich governments have aimed to limit it to Greece, Ireland and Portugal, which have signed up to bailouts totaling 273 billion euros -- a sum that is small compared to the financial resources of the zone as a whole.
Spain, commonly seen as the next potential domino in the crisis, has managed to retain its access to market funding through fiscal reforms. But because of the large sizes of the Spain and Italy, pressure on the euro zone would increase dramatically if those countries eventually needed financial assistance.
The Coming Bond Market Crash: The Three Moves Every Investor Must Make
By Martin Hutchinson
But QE2 ended yesterday (Thursday), meaning the Fed will no longer be a big buyer of Treasury bonds.
So starting today (Friday), the U.S. Treasury needs to sell twice as many Treasury bonds to end investors as it had been.
But the problem is, who's going to buy them?
Not China, which is diversifying its trillions in assets to get as far away from the U.S. dollar as fast as it can.
Not Japan, which is trying to rebound from its March 11 earthquake, tsunami and nuclear disaster - and is focusing all its spending on reconstruction.
And - as we've seen -neither is the Bernanke-led Fed.
I'm telling you right now: We are headed for an epic bond market crash. If you don't know about it, or don't care, you could get clobbered.
But if you do know, and are willing to take steps now, you can easily protect yourself - and even turn a nice profit in the process.
Let me explain ...
A Timetable for the Coming Crash
I'm an old bond-market hand myself - my experience dates back to my days at the British merchant bank Hill Samuel in the 1970s - so I see all the signs of what's to come.
Having the two biggest external customers of U.S. debt largely out of the market is a huge problem. Unfortunately, those aren't the only challenges the market faces. The challenges just get bigger from there - which is why I'm predicting a bond market crash.
Having the two biggest external customers of U.S. debt largely out of the market is a huge problem. Unfortunately, those aren't the only challenges the market faces. The challenges just get bigger from there - which is why I'm predicting a bond market crash.
Steadily rising inflation is one of the challenges. Inflation is a huge threat to the bond markets, and is almost certain to create a whipping turbulence that will ultimately infect the stocks markets, too.
Many pundits will tell you that if investor demand for bonds declines, and investor fear of inflation increases, bond-market yields could increase in an orderly fashion.
But I can tell you that the bond markets don't work like that. Price declines affect existing bonds as well as new ones, so the value of every investor's bond holdings declines. And with many of those investors heavily leveraged - especially at the major international banks - the sight of year-end bonuses disappearing down the Swanee River as bonds are "marked to market" will cause a panic. That's especially true when end-of-quarter or end-of-year reporting periods loom.
That's why we can expect a bond market crash at some point. If you ask me to make a prediction, I'd say that September or December were the most likely months for such a crash.
A Boxed-In Bernanke
One sad - even scary - fact about what I'm predicting is that Fed Chairman Bernanke won't be able to do much about it ... though he'll certain try.Consumer price inflation is now running at 3.6% year-on-year while producer price inflation is running at 7.2%. In that kind of environment, a 10-year Treasury bond yielding 3% is no longer economically attractive. Since monetary conditions worldwide remain very loose, inflation in the U.S. and worldwide will trend up, not down.
The bottom line: At some point, the "value proposition" offered to Treasury bond investors will become impossibly unattractive. When that happens, expect a rush to the exits.
If Bernanke attempts "QE3" - a third round of "quantitative easing" - he will have a problem. If other investors head for the exits, Bernanke may find that the U.S. central bank is as jammed up as the European Central Bank (ECB) currently is with Greek debt: Both will end up as the suckers that are taking all the rubbish off of everyone else's books.
There's a limit to how much Treasury paper even Bernanke thinks he can buy. And if everyone else is selling, that "limit" won't be high enough to save the bond market.
With Bernanke buying at a rapid rate, the inflationary forces will be even stronger, so every Bureau of Labor Statistics report on monthly price indices will be marked by a massive swoon in the Treasury bond market.
Eventually, there has to be a new head of the Fed - a Paul A. Volcker 2.0 who is truly committed to conquering inflation. Alas, it won't be Volcker himself since, at 84, he is probably too old.
But it might be John B. Taylor, who invented the "Taylor Rule" for Fed policy. The Taylor Rule is actually a pretty soggy guide on running a monetary system. But it has been flashing bright red signals about the current Fed's monetary policy since 2008.
However, since a Fed chairman who is actually serious about fighting inflation would be a huge burden for current U.S. President Barack Obama to bear - and could badly hamper his chances for re-election, any such appointment is unlikely before November 2012.
How to Profit From the Bond Market Crash
Given that reality, it's likely that Bernanke will attack any bond market crash that occurs ahead of the presidential election just by printing more money; there won't be any serious attempt to rectify the fundamental problem, meaning inflation will continue to accelerate.For you as an investor, this insight leads to two conclusions that you can put to work to your advantage. The scenario I've outlined for you will be:
Very good for gold and other hard assets. Challenging for Treasury bonds; prices will remain weak no matter how vigorously Bernanke attempts to support them.
So what should you do with this knowledge? I have three recommendations.
First and foremost, if Bernanke were not around, I would expect gold prices to fall following a bond market crash. But since he's still at the helm at the Fed, I expect him to do "QE3" in the event of a crash. And that means gold - not Treasury bonds - would become an investor "safe haven."
You can expect gold prices to zoom up, peaking at a much higher level around the time Bernanke is finally replaced. Silver will also follow this trend. So make sure you have substantial holdings of either physical gold and silver or the exchange-traded funds (ETFs) SPDR Gold Trust (NYSE: GLD) and iShares Silver Trust (NYSE: SLV).
Second, if you want to profit more directly from the collapse in Treasury bond prices, you could buy a "put" option on Treasury bond futures (TLT) on the Chicago Board Options Exchange (CBOE). The futures were recently trading around 94, and the January 2013 80 put (CBOE: TLT1319M80-E) was priced around $4.50, which seems an attractive combination of low price and high leverage.
Finally, if you don't already own a house, you should buy one - and do so with a fixed-rate mortgage. A U.S. Treasury bond market crash will send mortgage rates through the roof, so today's rates of about 4.8% will represent very cheap money, indeed. Even if house prices decline by 10%, a 2% rise in mortgage rates would increase the monthly payment (even accounting for a 10% smaller mortgage), by a net 11.8% (the payment on a $100,000 mortgage at 4.8% is $524.67; that on a $90,000 mortgage at 6.8% is $586.73).
Needless to say, the same benefits apply to rental properties financed by fixed-rate mortgages: With lower home ownership and rising inflation, rents are tending to rise significantly.
There's a storm coming in the Treasury bond market. But by recognizing its approach, we can turn the bond market crash to our advantage.
Etichette:
articles,
Economy article,
Finance article,
financials,
market articles
Obama faces new obstacles in high-stakes debt talks
(Reuters) - President Barack Obama will seek to salvage high-stakes debt talks on Sunday after Republicans pulled back from a joint effort to craft a broad $4 trillion deficit-reduction deal as part of a plan to avoid a government default.
On the eve of bipartisan negotiations hosted by Obama, House of Representatives Speaker John Boehner -- facing stiff opposition from fellow Republicans over the prospects of higher taxes as part of a large-scale deal -- told the Democratic president he would only pursue a smaller, $2 trillion package.
Boehner's decision threatened to thrust Sunday's White House meeting between Obama and congressional leaders into disarray as the clock ticked down on the August 2 deadline for raising the national debt ceiling.
Failure to act could mean the first-ever default on the nation's financial obligations, which the White House and private economists warn could push the United States back into recession and trigger global financial chaos.
Aides to Obama and Boehner had been working on a far-reaching package of spending cuts and new revenue that would have reduced deficits by $4 trillion over 10 years and cleared the way for lifting the $14.3 trillion cap on the government's borrowing capacity.
But Boehner's move dampened hopes of any immediate compromise and raised doubts about the chances that Sunday's talks would start moving the budget debate toward an endgame.
"Despite good-faith efforts to find common ground, the White House will not pursue a bigger debt reduction agreement without tax hikes," Boehner, the top Republican in Congress, said in a statement. "I believe the best approach may be to focus on producing a smaller measure."
BIG DIFFERENCES REMAIN
Boehner and Obama, whose 2012 re-election prospects are tightly linked to U.S. economic and fiscal health, spoke by phone on Saturday and failed to resolve key differences over taxes and entitlement spending.
But after Boehner's announcement, the White House said Obama would not "back off" his efforts toward a comprehensive deal and suggested he might try to change the Republican's mind. Sunday's session is set for 6 p.m. EDT.
"Both parties have made real progress thus far," White House communications director Dan Pfeiffer said.
"Tomorrow, he will make the case to congressional leaders that we must ... take on this critical challenge."
Obama had summoned congressional leaders to lay out their "bottom-line" demands for what the White House has billed as vital phase in the quest for a sweeping budget agreement.
There had been growing pressure from rank-and-file lawmakers who must approve anything hammered out in closed-door White House talks. Critics on the left and the right had voiced unease at some options on the table, and they are now expected to dig in their heels even further.
The biggest obstacles to an agreement remain.
Democrats want to shield popular domestic programs from huge cuts and say that any deal must include increases in tax revenue, including an expiration of Bush-era tax cuts on wealthier Americans.
Republicans -- under pressure from Tea Party conservatives -- reject any increased taxes and want curbs on popular benefit programs such as Medicare, Medicaid and Social Security.
The stakes are high for Obama. His 2012 re-election hopes hinge not only on reducing America's 9.2 percent unemployment but on his appeal to independent voters who want tougher action to get the country's fiscal house in order.
But Boehner and other mainstream Republicans do not want to be blamed for the economic turmoil that could be unleashed by any government default on its debt.
For his part, Obama is risking a mutiny on the left flank of his party for even agreeing to discuss entitlement programs traditionally protected by Democrats and which many feared would have been curbed under a $4 trillion plan.
Aides to Obama and Boehner were also discussing revenue increases that would have been achieved in part by a streamlining of the tax code, something that appeals to both Democrats and Republicans.
But Democrats' demands for $1 trillion in additional revenue also include eliminating tax breaks and other measures that many Republicans were reluctant to support.
Leana Fallon, an aide to House Republican Leader Eric Cantor, urged that the talks focus on a framework for between $2 and $2.5 trillion in cuts discussed in meetings led by Vice President Joseph Biden in May and June that ended in impasse.
Democratic Representative Chris Van Hollen blamed the abandonment of a bigger deficit-reduction goal on a "Republican fixation with protecting tax breaks for corporate special interests and the very wealthy."
Republicans want an agreement for at least $2 trillion in cuts as the price for a debt limit increase big enough to accommodate borrowing needs through the 2012 election.
Obama spent Saturday at the Camp David presidential retreat in Maryland and was due to return for the rare Sunday talks, his second session with bipartisan leaders in four days.
Etichette:
articles,
Economy article,
Finance article,
market articles
Here are the salaries of the Italian Parliament
Ecco gli stipendi dei parlamentari italiani.
■STIPENDIO Euro 19.150,00 al mese
■STIPENDIO BASE circa Euro 9.980,00 al mese
■PORTABORSE circa Euro 4.030,00 al mese (generalmente parente o familiare)
■RIMBORSO SPESE AFFITTO circa Euro 2.900,00 al mese
■INDENNITA’ DI CARICA (da Euro 335,00 circa a Euro 6.455,00)
■TUTTI ESENTASSE
Più
■TELEFONO CELLULARE gratis
■TESSERA DEL CINEMA gratis
■TESSERA TEATRO gratis
■TESSERA AUTOBUS – METROPOLITANA gratis
■FRANCOBOLLI gratis
■VIAGGI AEREO NAZIONALI gratis
■CIRCOLAZIONE AUTOSTRADE gratis
■PISCINE E PALESTRE gratis
■FS gratis
■AEREO DI STATO gratis
■AMBASCIATE gratis
■CLINICHE gratis
■ASSICURAZIONE INFORTUNI gratis
■ASSICURAZIONE MORTE gratis
■AUTO BLU CON AUTISTA gratis
■RISTORANTE gratis (nel 1999 hanno mangiato e bevuto gratis per Euro 1.472.000,00). Intascano uno stipendio e hanno diritto alla pensione dopo 35 mesi in parlamento mentre obbligano i cittadini a 35 anni di contributi (per ora!!!)
Incassano circa 103.000,00 Euro con il rimborso spese elettorali (in violazione alla legge sul finanziamento ai partiti), più i privilegi per quelli che sono stati Presidenti della Repubblica, del Senato o della Camera. (hanno a disposizione e gratis un ufficio, una segretaria, l’auto blu ed una scorta sempre al suo servizio).
Gente con simili privilegi, ed avendo pure prodotto i risultati che sono sotto gli occhi di tutti, non ha neppure il pudore di porre in essere tagli ai propri "privilegi" prima di imporre "sacrifici" ai cittadini.
The Icelandic solution
Perchè, se da un lato siamo stati informati su tutto quello che sta succedendo in Egitto, dall’altro i mass-media non hanno sprecato una sola parola su ciò che sta accadendo in Islanda?
Il popolo islandese è riuscito a far dimettere un governo al completo; sono state nazionalizzate le principali banche commerciali; i cittadini hanno deciso all’unanimità di dichiarare l’insolvenza del debito che le stesse banche avevano sottoscritto con la Gran Bretagna e con l’Olanda, forti dell’inadeguatezza della loro politica finanziaria; infine, è stata creata un’assemblea popolare per riscrivere l’intera Costituzione. Il tutto in maniera pacifica. Una vera e propria Rivoluzione contro il potere che aveva condotto l’Islanda verso il recente collasso economico.
Sicuramente vi starete chiedendo perchè questi eventi non siano stati resi pubblici durante gli ultimi due anni. La risposta ci conduce verso un’altra domanda, ancora più mortificante: cosa accadrebbe se il resto dei cittadini europei prendessero esempio dai “concittadini” islandesi?
Ecco brevemente la cronologia dei fatti:
- 2008 – A Settembre viene nazionalizzata la più importante banca dell’Islanda, la Glitnir Bank. La moneta crolla e la Borsa sospende tutte le attività: il paese viene dichiarato in bancarotta.
- 2009 – A Gennaio le proteste dei cittadini di fronte al Parlamento provocano le dimissioni del Primo Ministro Geir Haarde e di tutto il Governo – la Alleanza Social-Democratica (Samfylkingin) – costringendo il Paese alle elezioni anticipate. La situazione economica resta precaria. Il Parlamento propone una legge che prevede il risanamento del debito nei confronti di Gran Bretagna e Olanda, attraverso il pagamento di 3,5 MILIARDI di Euro che avrebbe gravato su ogni famiglia islandese, mensilmente, per la durata di 15 anni e con un tasso di interesse del 5,5%
- 2010 – I cittadini ritornano a occupare le piazze e chiedono a gran voce di sottoporre a Referendum il provvedimento sopracitato.
- 2011 – A Febbraio il Presidente Olafur Grimsson pone il veto alla ratifica della legge e annuncia il Referendum consultivo popolare. Le votazioni si tengono a Marzo ed i NO al pagamento del debito stravincono con il 93% dei voti. Nel frattempo, il Governo ha disposto le inchieste per determinare giuridicamente le responsabilità civili e penali della crisi. Vengono emessi i primi mandati di arresto per diversi banchieri e membri dell’esecutivo. L’Interpol si incarica di ricercare e catturare i condannati: tutti i banchieri implicati abbandonano l’Islanda. In questo contesto di crisi, viene eletta un’Assemblea per redigere una Nuova Costituzione che possa incorporare le lezioni apprese durante la crisi e che sostituisca l’attuale Costituzione (basata sul modello di quella Danese). Per lo scopo, ci si rivolge direttamente al Popolo Sovrano: vengono eletti legalmente 25 cittadini, liberi da affiliazione politica, tra i 522 che si sono presentati alle votazioni. Gli unici due vincoli per la candidatura, a parte quello di essere liberi dalla tessera di qualsiasi partito, erano quelli di essere maggiorenni e di disporre delle firme di almeno 30 sostenitori. La nuova Assemblea Costituzionale inizia il suo lavoro in Febbraio e presenta un progetto chiamato Magna Carta nel quale confluiscono la maggiorparte delle “linee guida” prodotte in modo consensuale nel corso delle diverse assemblee popolari che hanno avuto luogo in tutto il Paese. La Magna Carta dovrà essere sottoposta all’approvazione del Parlamento immediatamente dopo le prossime elezioni legislative che si terranno.
The Coming U.S. Federal Collapse
By: LewRockwell
As Gary North has noted, the great 21st century default of the U.S. government has already started, with the raiding of federal pension funds to stay solvent a few months ago. We may recall the 2000 presidential election, when Al Gore spoke favorably about creating a social security "lockbox," even as Social Security "taxes" had been treated for years as a core part of the federal budget, simple annual "income" for the state.
Terms like "lockbox," as with the words "freedom" and "patriotism" and "progress" have been used by the state for a long time to confirm and communicate the false idea that the federal government is, and has ever been, on solid ground. Gore helped many millions of us create in our minds a vision of a social security lockbox that simply never existed, and one that could never exist, in the context of what George Ayittey described, in several of his books, "the vampire state."
Dr. Ayittey gave an impassioned and entertaining talk at TED a few years ago, entitled "Cheetahs vs. Hippos." In it, he mentions vampire states, and describes a begging bowl that leaks. While these metaphors refer to governments on the African continent, both are well-suited to 20th and early 21st Century American federalism. Ayittey speaks of unleashing the "Cheetah generation," and as a metaphor for what comes next, it is both lovely and powerful.
As we watch the Washington D.C. megalith begin to crumble, and make no mistake, we are watching this today – with its frantic decades-long construction of government facilities and monuments, combined with an even more frantic last ditch effort to control what individuals do, earn, say, and where and how they travel. And, might I remind you, all of this construction, of monuments, prisons, bases and office space (2.2 billion square feet for the U.S. military alone) and all these rules and regulations cost lots of money to be eternally loaned by we the people and from interested investors. Funny, I don’t recall signing a contract or even being asked. Perhaps that what they mean by patriotism: my country’s spending, right or wrong.
Is it to be a Cheetah’s generation, or as The Daily Bell has it, the playing out of the Internet "reformation?" Will we see the ascension of an anti-individual hivemind? Will we become Borg drones or even, as the Federal Government's medical outreach program has it, zombies in a zombie apocalypse? Will the future belong to those who recognize the acronym TEOTWAWKI and lost to those who do not? Has American been zombified?
From my perspective, while the great futurists and science fiction masters have great metaphors, I believe it will be the metaphors that speak most simply to people in their own lives that will prove the most useful. Along those lines, here are some of my favorites:
For describing the future of the U.S. federal system and its devotees, I can say no more than a single word. Idiocracy. Several Lew Rockwell writers have marveled at this hilarious movie, its only flaw a miscalculation of how far into the future the script purports to be. Rather than 500 years away, we see that Idiocracy is alive and expanding now in America. Idiocracy responds to professional political, social and economic system explainers – the elected politician, his and her corporate sponsors and financiers, the media "experts, and the free-lunch Keynesians – with a dull, uncomprehending stare. The movie celebrates both the rule of the hivemind as well as the degradation of everything government touches, and has a multiplicity of memorable images and quotes, any of which are applicable and helpful today.
To understand how the state functions, in a visceral and fundamental way, I love the concept of Americans not as sheep, or pigs, or even cattle or bees – but as "livestock" farmed by the state. This metaphor captures the human tendency to follow the herd, and promotes the popular and often religion-friendly idea that we are here for some unified and agreed-upon purpose, waiting only to be pointed in the "right" direction. The term "livestock" is powerful because unlike the pejorative "sheep," it allows for subgroups and variation – a form of individuality Americans cherish even as they exist as "citizens" with a productive potential defined by solely by their owner, the state. We look to the state as all-knowing and protective shepherd, as evidenced in both Republican and Democratic circles, and as broadcasted every waking minute by all mainstream media. That we often consider livestock stupid is also a worthwhile aspect of this metaphor. Of course, farmers understand, like Gump, that stupid is as stupid does. On the other hand, livestock define the farmer, as we the people define the state. We should all reflect on what it means to be farmed by the state.
To know the state, the popular emergence of the phrase "political class" is very useful. When we articulate this term, we immediately separate ourselves from the political class, we become critics of the rulers, we recognize the unitary nature of the political system, and we begin to understand how and why it is that we are "farmed" by the state. Even Rasmussen Reports polls with this term, and the citizenry responds predictably well in blaming our rulers for many of our systemic ailments. Of course, it is both herdlike and human to blame others – but when we recognize a political class, we are also recognizing that our conception of electoral politics among a mass of over 300 million people cannot possibly be just and righteous. Surely we did not ask to be farmed like cattle, ruled like serfs, raised and routinely sheared like sheep, trained like obedient dogs and sent forth to die on command by a remote federal state that enriches itself and grows while we wait and wither. Talking about the political class, as in kings and princes, works well as an educational metaphor. And while speaking contemptuously of other powerful classes is often used successfully by politicians, it is invariably transparent and revealing when they do so.
I don’t know if Eric Peters invented it, but I love the term "clovers." It describes the anti-freedom and pro-state mentality, the nanny-state mindset, and applies to Americans of all eras who embraced progressivism and state-as-moral-agent since the late 1800s. It doesn’t sound exceptionally pejorative, at first glance. It’s not an ugly phrase, so it is possible one might actually speak to clovers about their cloverism, in a helpful and constructive way. Cloverism is something we can see in small and routine ways – as Peters waxes eloquently, on the highways. Yet it captures an entire battlefront in the ongoing fight for liberty in America. It’s elegant – useful, purposeful, and valuable. To be a clover is to imply government is to be trusted, and obeyed – and yet 99% of clovers probably do not always trust, obey or believe government pronouncements. Accordingly, many clovers are libertarians in waiting, and deserve our care and attention. If a conservative is a liberal who has been mugged (safely philosophically within the confines of state-slavery), a libertarian might be a clover who wakes up to find the state’s been lying to them.
Will we be cheetahs, nimble and swift, or livestock confined by, dependent upon, and serving the state until we are no longer useful? Are we passionate about our liberty, or fearful unimaginative clovers? Do we embrace the present idiocracy, or fight it, openly laugh at it, and work hard to live beyond and outside of it? Do we own ourselves, or are we serfs who cannot imagine real change? Is it not possible that the real battle has long been analyzed and defined by our betters, and that this decade marks not a battle between human liberty and the state, but a battle already won by libertarian ideas, and now roughly struggling to make the transition to peace and real human prosperity and liberty?
I’ll offer another metaphor for this decade – a decade that will pave the way for peaceful secession of American states, regions, counties, and communities from the central state’s debt, its political class, its empire, and its arbitrary rules and false ethics. For cheetahs, and for recovering clovers, I can see a faithful unwavering light – an unprecedented era of libertarian reconstruction in North America, conducted person to person, quietly, often underground, and in the language of metaphor.
Etichette:
articles,
Economy article,
Finance article,
market articles
Stock Market Uptrend Continues
By: Tony_Caldaro
After the July 4th holiday the market seemed to struggle this week. Tuesday and wednesday were about flat. Then thursday gapped up ending with a new uptrend high, and friday gapped down giving all of thursday’s gains back before a rally into the close. The economic news seemed to reflect the market action ending with 4 positive reports and 5 negative. On the positive side: factory orders swung back into the black, the ADP index was up nicely, wholesale inventories improved, as did the weekly jobless claims.
On the negative side: ISM services, consumer credit, the WLEI and the payrolls report declined, while the unemployment rate ticked up to 9.2%. For the week the SPX/DOW were +0.45%, and the NDX/NAZ were +1.75%. Asian markets gained 1.5%, European markets lost 2.0%, the Commodity equity group lost 0.5%, and the DJ World index gained 0.1%. Next week looks like a thriller, highlighted by: the Twin deficits, FOMC minutes, Retail sales, Industrial production and friday’s Options expiration.
LONG TERM: bull market
This week the market rallied to within 1% of the bull market high, which happens to be over 100% above the bear market low, and some are still calling this a bear market rally. Bull markets climb a wall of worry, while bear markets slide down the slope of hope. The stock market has been climbing higher for over two years now. The wall of worry seems to appear in the first half of the year, and then magically disappears in the second half. We are in the second half of the year now.
Technically the market continues to look good. We did get unusually oversold recently in the weekly RSI, but the MACD stayed well above neutral and turned up this week. The OEW wave count cleared up a bit with the confirmation of the current uptrend. After a simple five Major wave Primary wave I, and a three month 17% correction Primary II. Primary wave III has gone into its customary extension/subdivision mode. Major wave 1 was quite strong: up 33% in seven months. Then a mild 7% correction for Major wave 2. After that a somewhat tricky subdivision for Major wave 3: Intermediate waves i and ii. This uptrend should now be Intermediate wave iii of Major 3 of Primary III. Thus far we have had an 8% rally off the June 16th SPX 1258 low. We continue to anticipate a bull market top, around the previous all time highs, in 2012.
MEDIUM TERM: uptrend high SPX 1356
After a sluggish beginning from the SPX 1258 low: Minor 1 1299, and Minor 2 1263; Minor wave 3 exploded to the upside. This week it hit SPX 1356, just two weeks after the Minor 2 low. Market momentum remained extremely overbought for about a week before dropping to neutral, and then oversold this week.
We have been tracking some projections we have made for this uptrend. First, we expected some resistance in the 1339-1344 area. Second, a Minor wave 3 to top around the OEW 1371 pivot. Third, the uptrend high would reach the OEW 1440 pivot by September. Thus far, the market did run into resistance at SPX 1341 and pulled back. However, friday’s larger pullback from SPX 1356 was somewhat unexpected. After the reviewing both the SPX and DOW short term charts we feel Minor wave 3 may still be unfolding. Our Minor wave 3 target may still be possible. We posted this count on the SPX hourly chart, and an alternate, (Minor wave 3 top), on the DOW hourly chart. The timeframe for the hourly charts have been shortened for easier tracking of Intermediate wave iii.
SHORT TERM
Support for the SPX remains at 1313 and 1303, with resistance at 1363 and then 1372. Short term momentum just touched slightly oversold and has risen past neutral. The count we are tracking is as follows: Minor 1 SPX 1299 and Minor 2 SPX 1263. Minor wave 3 then divides as follows: Minute i SPX 1284, Minute ii SPX 1267, Minute iii SPX 1356, Minute iv possibly ended at SPX 1334, and Minute v may be underway now.
Should this be the market’s count Minute v, (Minor 3), would end in the OEW 1371 pivot range. Then a similar 20+ point pullback like we just experienced for Minor 4. After that a rally to the OEW 1440 pivot range for Minor wave 5 to end Intermediate wave iii. This is just a potential roadmap.
FOREIGN MARKETS
Asian markets were all higher on the week gaining 1.5%, and three of the five are in confirmed uptrends.
European markets were mostly lower on the week losing 2.0%. Here three of the five are in confirmed uptrends too.
The Commodity equity sector was mixed on the week for a loss of 0.5%. Only one of three indices are in a confirmed uptrend.
The DJ World index is uptrending and gained 0.1% on the week.
COMMODITIES
Bonds are downtrending, but had a big rally on friday for a net weekly gain of 1.4%.
Crude has yet to confirm an uptrend but gained 3.6% on the week.
Gold is still in a downtrend and has been a bit tricky of late: up 4.0% on the week.
The USD is still uptrending and gained 2.0% on the week.
Etichette:
Analysis Technic,
analysis technic article,
articles,
eMini SP,
Index,
market articles
Italia, Repubblica fondata sulle Tasse ...
by Tassati e Mazziati
LE TASSE, VISIONE D’INSIEME
Lo Stato preleva il 51 % del reddito lordo ai contribuenti “onesti”
Perché lo Stato percepisce risorse finanziare dalle tasse?
- erogare servizi (sanità, ordine pubblico, sicurezza)
- ridistribuire le risorse (pensioni e assistenza sociale)
- ripagare il debito pubblico.
Quali tasse mediamente“conosciamo”?
IRPEF, Addizionali IRPEF, IVA, dichiarazione dei redditi, trattenute sulla busta paga
Spesso si associano le tasse ad appuntamenti temporali precisi.
Giulio Tremonti (libro bianco per la riforma fiscale) individua 100 tasse di cui14 tributi sulla casa e 9 sull’automobile.
Censimento tasse ISTAT: 107 forme di prelievo di cui 73 vigenti (con gettito corrispondente)
----------------------------------
LE TASSE MENO CONOSCIUTE
Il prelievo IRPEF effettuato su un lavoratore dipendente è l’imposta che maggiormente grava sulle tasche degli italiani.
L’IRPEF (imposta sul reddito delle persone fisiche) varia in funzione del reddito, e dei famigliari a carico (solo moglie o moglie e figlo)
IRPEF è solo la punta dell’iceberg, vi sono altre imposte che versiamo (più o meno inconsapevolmente) nelle quali ci si imbatte quotidianamente:
• Contributi previdenziali
• Contributo del Servizio Sanitario Nazionale
• Premio INAIL casalinghe
• Addizionale comunale IRPEF
• Addizionale regionale IRPEF
• Imposta sula valore aggiunto IVA
• Prelievo sui rifiuti (TIA/TARSU)
• Bollo auto
• Accise
• Imposta sulle assicurazioni
• Canone RAI
• Addizionale comunale sui consumi di energia elettrica
• Addizionale regionale sui consumi di gas
• Ritenuta d’imposta sugli interessi attivi.
Tutte queste tasse, aggiunte all’IRPEF, portano la pressione fiscale del contribuente medio a raggiungere e superare il 43,2%.
Questa quota può variare in dipendenza alla situazione familiare:
- Lavoratore celibe (43,9%)
- Famiglia bireddito (40,3%)
- Famiglia monoreddito (45,5 %)
----------------------------
CAPITOLO CASA e AUTO
Dalle tasse sulla casa si ricava un gettito di 43,2 miliardi di euro ca. così ripartiti:
62.8 % allo Stato
34.5 % ai Comuni
2.5 % a Province e Regioni.
Le “tasse casa”, in riferimento al consumo di energia e gas, sono in sostanza tre:
- Accisa
- IVA
- Addizionale regionale
Dalle tasse sulle auto, compreso il comparto trasporti nel complesso (flotte aziendali, autocarri e altri veicoli) lo Stato ricava circa 58 miliardi di euro.
Le “tasse auto”sono invece cinque e comportano un aggravio superiore a quello del bene casa:
- Contributo al Servizio Sanitario nazionale sui premi RC Auto
- L’imposta sulle assicurazioni
- Le accise
- L’IVA
- Il bollo auto
A proposito del possesso dell’auto è da evidenziare come si rappresenti il problema assurdo delle “tasse sulle tasse”; ad esempio ad incrementare il premio RC auto concorre anche il fisco:
Le tasse ammontano a ben il 18,7 % del premio versato ovvero capaci di incrementare il premio netto di ben il 23 %.
-----------------------------
LE ACCISE
Ricorrono più volte le ACCISE: cosa sono?
Sono particolari imposte indirette caricate principalmente sui prodotti energetici che pesano in modo determinante sulla composizione del prezzo del bene e vengono calcolate sulle quantità prodotte e consumate.
Nel corso della storia utilizzate per reperire gettito in occasione di eventi straordinari, ma, terminato l’evento non sono stati mai abolite; eccone alcuni esempi:
- 1.90 lire per la guerra di Abissinia del 1935
- 14 lire per la crisi di Suez del 1956
- 10 lire per il disastro del Vajont del 1963
- 10 lire per l’alluvione di Firenze del 1966
- 10 lire per il terremoto del Belice del 1968
- 99 lire per il terremoto del Friuli del 1976
- 75 lire per il terremoto dell’Irpinia del 1980
- 205 lire per la missione in Libano del 1983
- 22 lire per la missione in Bosnia del 1996
- 39 lire (0,020 euro) per il rinnovo del contratto degli autoferrotranvieri del 2004.
Il tutto corrisponde a 0,25 euro.
Una curiosità, stando ai calcoli, quanti giorni l’anno un contribuente lavora “per lo Stato”?
160 gg/anno lavoratore celibe
166 gg/anno famiglia monoreddito
147 gg/anno famiglia bireddito
Ricordiamo che la tassazione in Italia subisce variazioni rispetto alla Regione in cui si risiede e talvolta anche rispetto al Comune in base alle cosiddette Addizionali Irpef.
------------------------
IL FENOMENO DELLE “TASSE SULLE TASSE”
L’aggravio fiscale che subiscono i contribuenti dovuto alle tasse sulle tasse è notevole: di seguito alcune delle principali:
Energia elettrica: IVA con aliquota al 10% calcolata su:
- accisa su energia elettrica destinata allo Stato
- addizionale comunale destinata agli Enti locali
Gas: IVA con aliquota al 10% sui primi 480 mq, al 20 % oltre, su:
- accisa erariale sul consumo di gas
- addizionale regionale
Carburanti per autotrazione: IVA con aliquota al 20 % calcolata su:
- accisa erariale
Tassa rifiuti: tributo provinciale con aliquota al 5 % su:
- TARSU
- TIA
Addizionale ex ECA del 10 % su:
- TARSU
IVA del 10 % su:
- TIA
Alcune cifre, dalle tasse sulle tasse si percepiscono:
- 200 mln di euro sull’energia elettrica
- 300 mln euro sul consumo di gas
- 2,5 miliardi di euro dall’IVA alle accise sui carburanti
----------------------
IL CASO DEI FONDI PENSIONE
Secondo gli studi un lavoratore italiano che va in pensione con 58 anni di età e 35 di contribuzioni matura prestazioni pensionistiche in grado di coprire i successivi 17 anni di vita. In Italia la speranza di vita è però superiore ai 75 anni e ciascun anno di vita in più rappresenta un aggravio per lo Stato che deve garantire il pensionato.
Come contrastare la crescita della spesa per lo Stato?
- Inasprimento dei requisiti anagrafici per l’accesso alla pensione
- Equivalenza fra contributi versati e prestazioni pensionistiche attese (cd. metodo di calcolo contributivo).
Le idee per il completamento della riforma previdenziale nel nostro Paese sono in larga parte orientate verso un ulteriore aumento dell’età pensionabile e verso la modifica degli attuali coefficienti di trasformazione.
Quali saranno le conseguenze di questo percorso riformatore sui giovani?
Non rosee.
- Innanzitutto potranno percepire la pensione ad un’età molto più avanzata dei loro padri.
- Soggetti al sistema di calcolo “contributivo” vedranno ridotto il tasso di sostituzione tra ultims retribuzione percepita e prima pensione ricevuta.
In altri termini: le future generazioni pagheranno gli errori di precedenti gestioni previdenziali infelici e si ritroveranno a dover vivere, ritiratisi dal lavoro, con una pensione che ammonta a meno della metà dell’ultimo stipendio percepito.
---------------------------
PAGHI DUE, PRENDI UNO
L’obbligo di rivolgersi al privato per avere un servizio che dovrebbe essere pubblicamente garantito dal pagamento delle imposte non è cosa rara in Italia.
L’equazione dovrebbe essere immediata, se non stessimo parlando dell’Italia:
più tasse = più servizi o, variando,
più tasse = qualità più elevata dei servizi.
Purtroppo non è sempre così, anzi, in molti casi i servizi, quando previsti, non sono adeguati all’ammontare di risorse che ciascun cittadino trasferisce allo Stato ossia quasi 11.000 € l’anno.
Come possono i cittadini far fronte a servizi carenti?
Rivolgendosi, pagando, ai privati
Si può affermare con ragionevole certezza che in Italia il concetto di sussidiarietà orizzontale è abbastanza forzato e gli incroci tra pubblico e privato penalizzano, anziché aiutare, i contribuenti.
---------------------------
PAGHI DUE, PRENDI UNO
QUALCHE ESEMPIO
1- Il trasporto pubblico
Ciascun cittadino versa 50,41 l’anno per il trasporto pubblico che utilizza molto poco. Gran parte di noi si sposta in auto ad un costo medio di 13,90 € tra carburante ed altro. Spesso decidiamo di evitare il traffico urbano viaggiando in autostrada pagando naturalmente il pedaggio.
Cosa ci spinge a sopportare tutti questi costi ulteriori per spostarci?
Non sempre si tratta di volontà legata a pigrizia o altro. Spesso è la consapevolezza di dover affrontare lunghe attese per usufruire di servizi di qualità largamente inferiore a quella dovuta.
2 – I servizi postali
L’azienda Poste Italiane SpA che si occupa dei servizi postali in Italia è per quasi il 90% in mano pubblica. Questo vuol dire che ciascun cittadino italiano, essendo “proprietario” di parte dell’azienda ha diritto a sfruttarne i servizi.
Che grado di efficienza e qualità offre il servizio pubblico postale?
Nelle valutazioni degli utenti non elevatissimo. I cittadini che intendono effettuare spedizioni sicure e celeri si rivolgono a società private “autotassandosi” quindi e deviando il servizio di Poste Italiane.
Macro Week in Review/Preview July 9, 2011
Last week’s review of the macro market indicators looked for Gold to continue lower with Crude Oil biased to the upside but defined by the range between 88 and 102, I know that is big just stay away from the middle. The US Dollar Index looked headed higher to test the trend break in a bear flag, while US Treasuries continue lower. The Shanghai Composite was headed higher towards a test of the breakdown while Emerging Markets continue higher to resistance. The Volatility Index looked to remain stable allowing a run higher by the Equity Indexes toward previous highs from April.
The week began with Crude Oil and the US Dollar Index acting as the charts suggested, both heading higher. But Gold also moved higher. US Treasuries consolidated and then rose Friday. The Shanghai Composite held higher in a narrow range while the Emerging Markets found resistance and bounced. Volatility remained low and the Equity Index ETF’s SPY, IWM and QQQ moved higher. What does this mean for the coming week? Lets look at some charts.
As always you can see details of individual charts and more on my StockTwits feed and on chartly.)
Gold Weekly, $GC_F
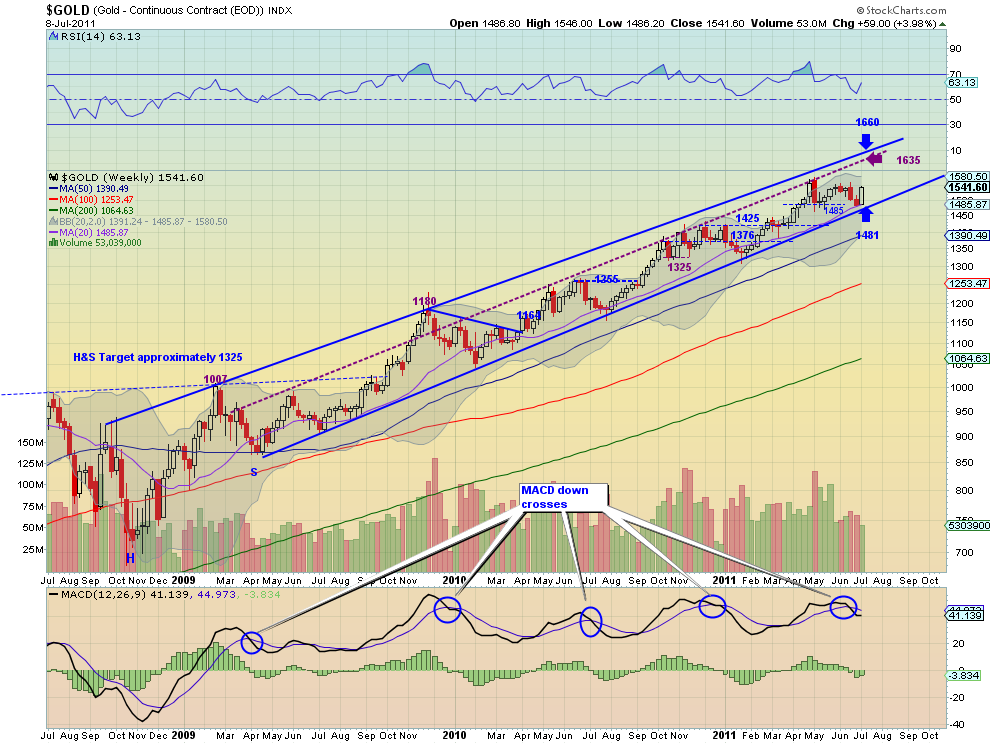
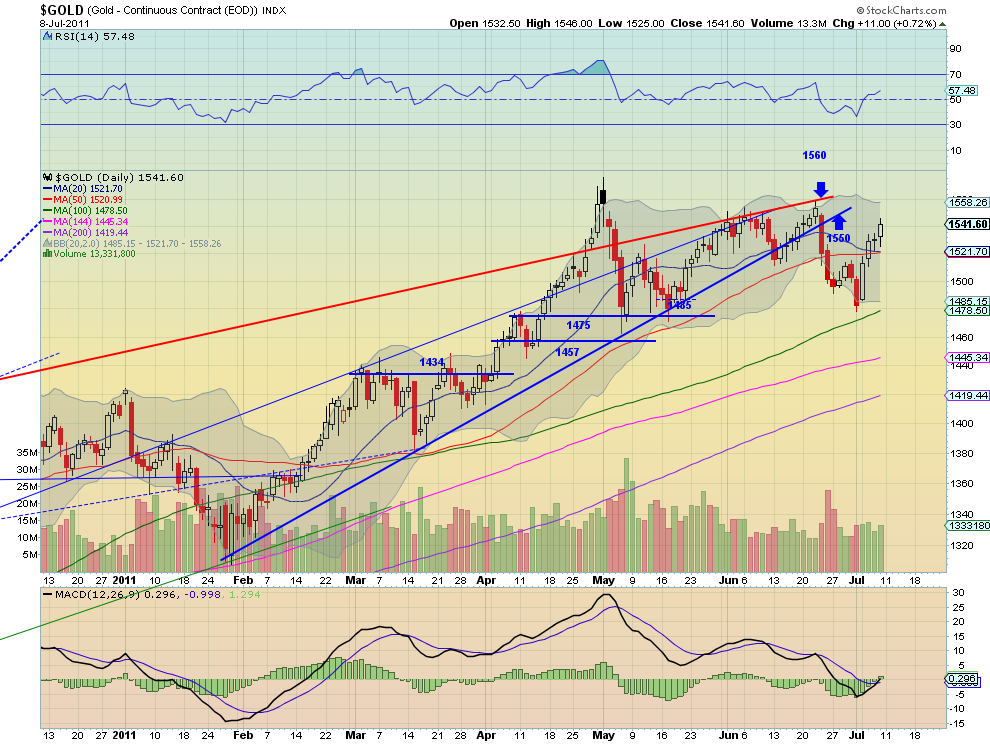
Gold moved higher off of the bottom at 1485 and settled for the week just under resistance at 1550. The daily chart shows the Relative Strength Index (RSI) creeping higher and the Moving Average Convergence Divergence (MACD) crossing up, bullishly. The weekly chart shows the role that the 20 week Simple Moving Average (SMA) played in support launching Gold higher. The RSI is moving steeply higher and the MACD is reversing up towards the zero line. Look for Gold to continue higher next week with a move above 1550 leading to a test of the highs at 1563 and then 1600 in its sights. Any pullback has support at 1516 and then 1500 before the double strong support at 1481-1485.
West Texas Intermediate Crude Weekly, $CL_F
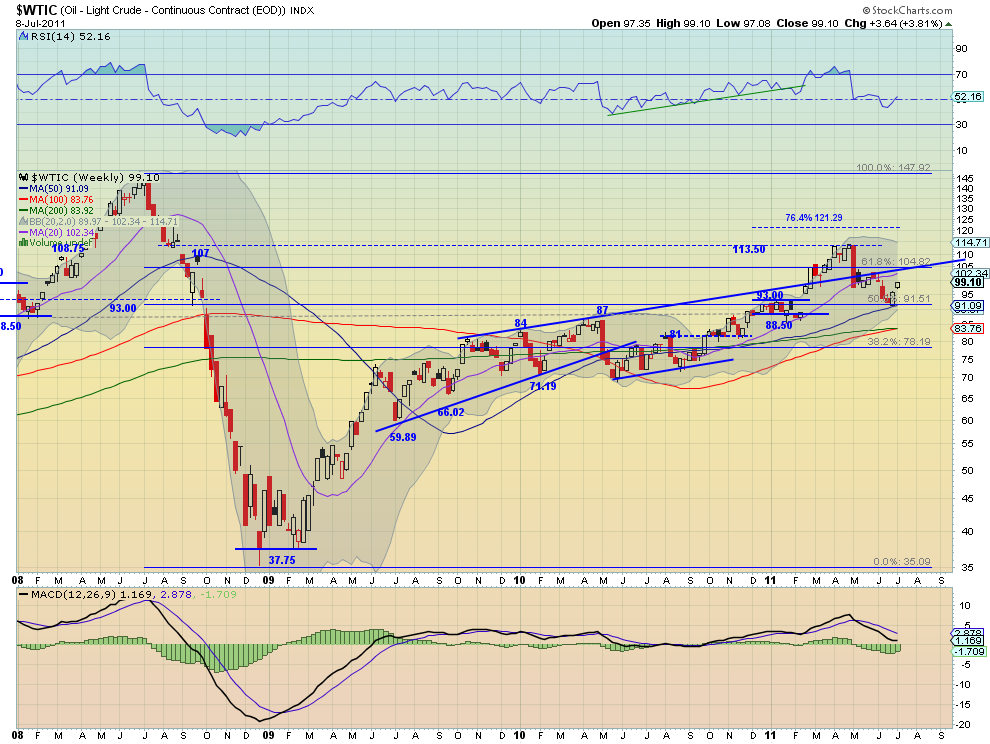
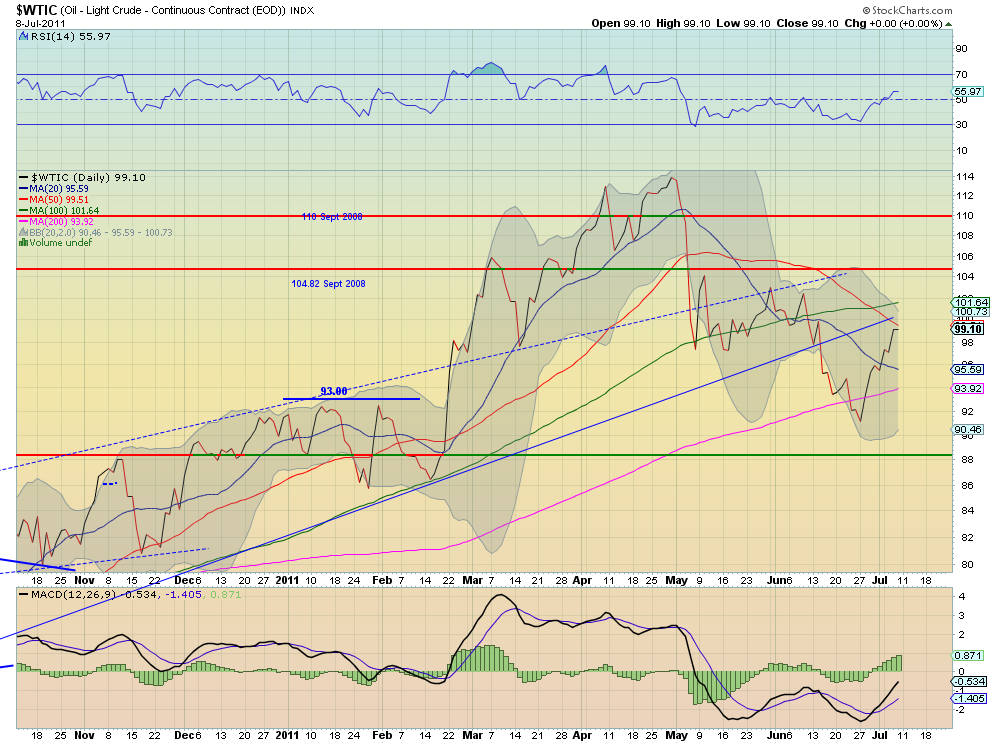
Crude Oil continued its move higher this week and is now approaching the rising trend line at 100 on the daily chart. The RSI is trending higher and the MACD is increasing, supporting more upside. The weekly chart shows crude closing on its highs as it moves towards the intersection of the extended trendline from from 2009 and the 104.82 Fibonacci level. The weekly RSI is moving higher while the MACD is improving towards the flat line. Crude looks to head higher next week and through 100 likely to take a run at 104.82. Any pullback should be contained by support at 93.
US Dollar Index Weekly, $DX_F

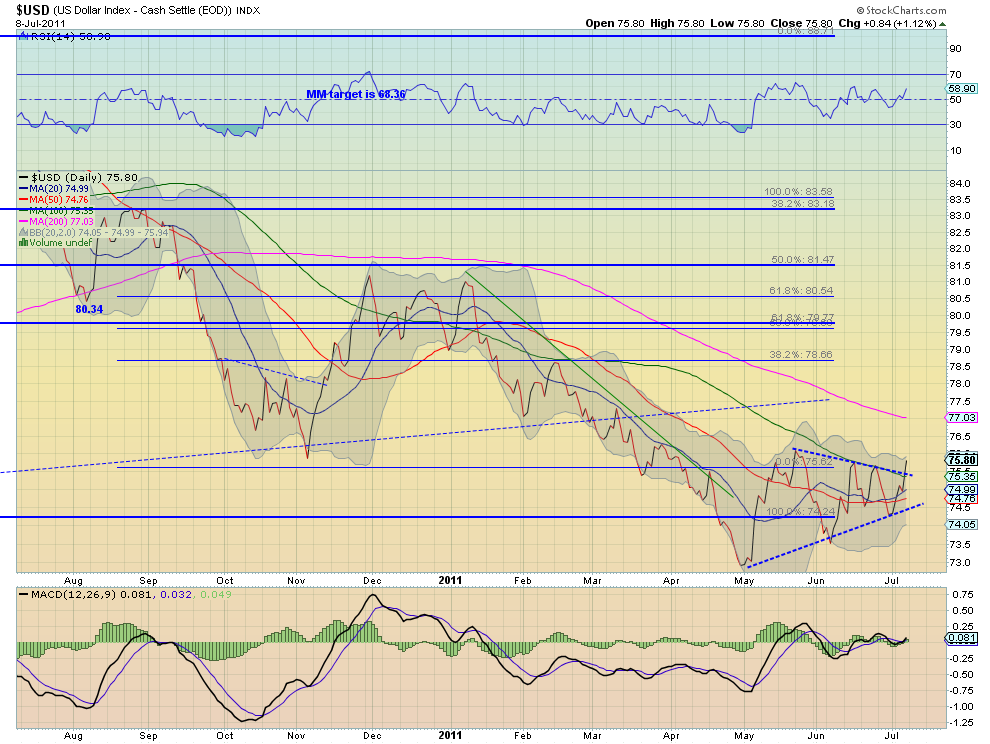
The US Dollar Index is breaking out above a symmetrical triangle on both the daily and weekly timeframe. It has a rising RSI on the daily chart with the MACD very flat, supporting more upside. The weekly chart shows the RSI poking at the mid line and the MACD positive and increasing. It still has work to erase the down trend but a move above 76 would gain some attention. Look for more upside next week with a retest of the multi-year uptrend breakdown at 77.30 still a possibility. Any move below 74.80 will gather steam lower.

iShares Barclays 20+ Yr Treasury Bond Fund Weekly, $TLT
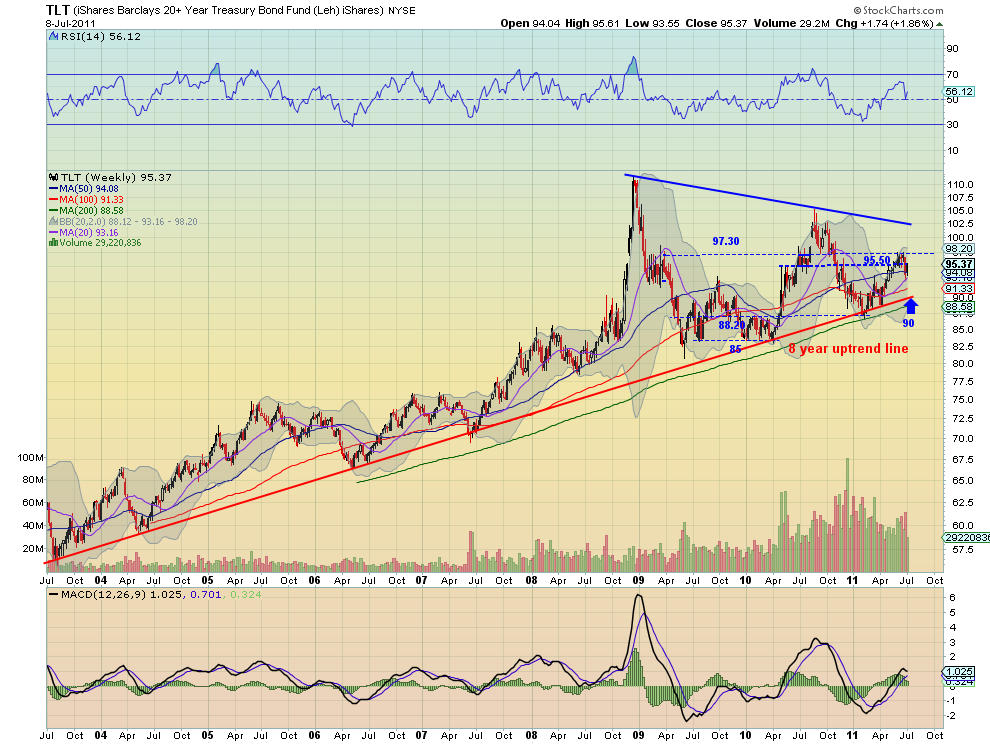
US Treasuries, proxied by the ETF TLT, consolidated testing support just above the 38.2% retracement of the move from August 2010, before moving higher Friday. The daily chart shows that it stopped Friday between the 20 and 50 day SMA. The RSI on the daily chart is moving sharply higher and the MACD is improving. On the weekly chart the RSI bounced hard off of the mid line but the MACD is diverging lower. Not unusual signs in a symmetrical triangle. The center of the triangle is a range between 95.50 and 97.30. Look for the TLT to have a short term bias to the upside but capped at the 97.30 area in the coming week. If it does get over 97.30 then a test of 102.50 is possible. Any move lower looks to find support at 93 and then the 8 year rising trend at 90.

Shanghai Stock Exchange Composite Weekly, $SSEC
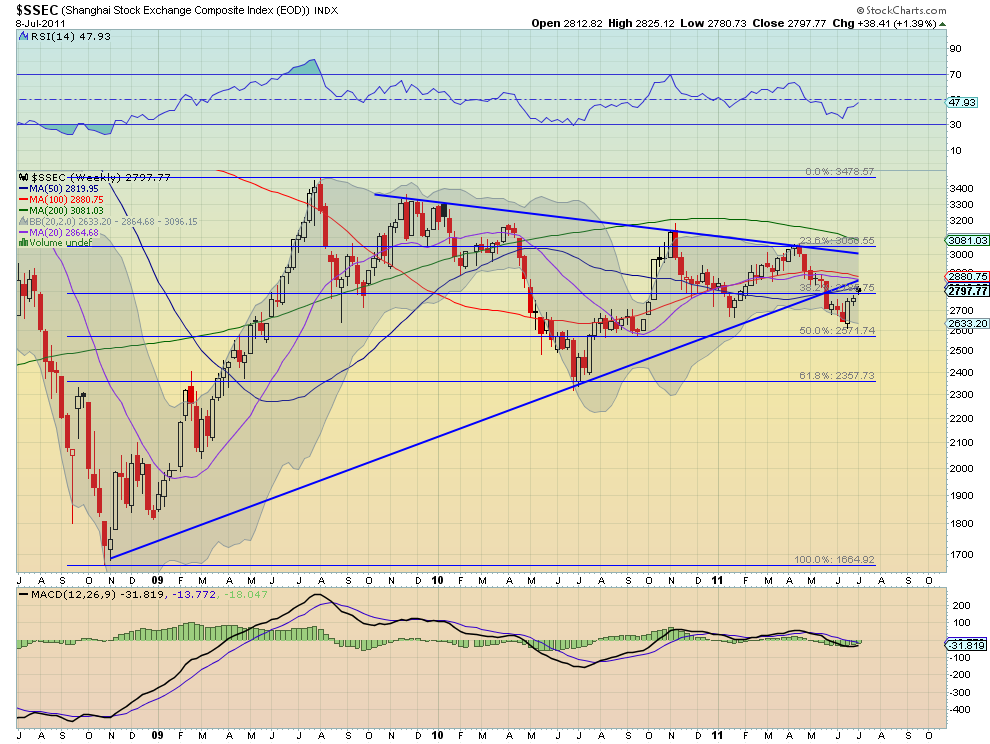
The Shanghai Composite continued in a tightening range this week on a move back toward the symmetrical triangle break down from May. The daily chart shows the RSI and MACD pointing to lower prices as it is in a bull flag near 2800 resistance. The weekly chart has a RSI that is rising and a MACD that is flat but moving back towards positive. The weekly chart takes precedence giving a short term bias for next week to the upside but with resistance very nearby at 2800 and through that the possibility to 2900. Pullbacks should be limited to the 2695-2700 area.
iShares MSCI Emerging Markets Index Weekly, $EEM
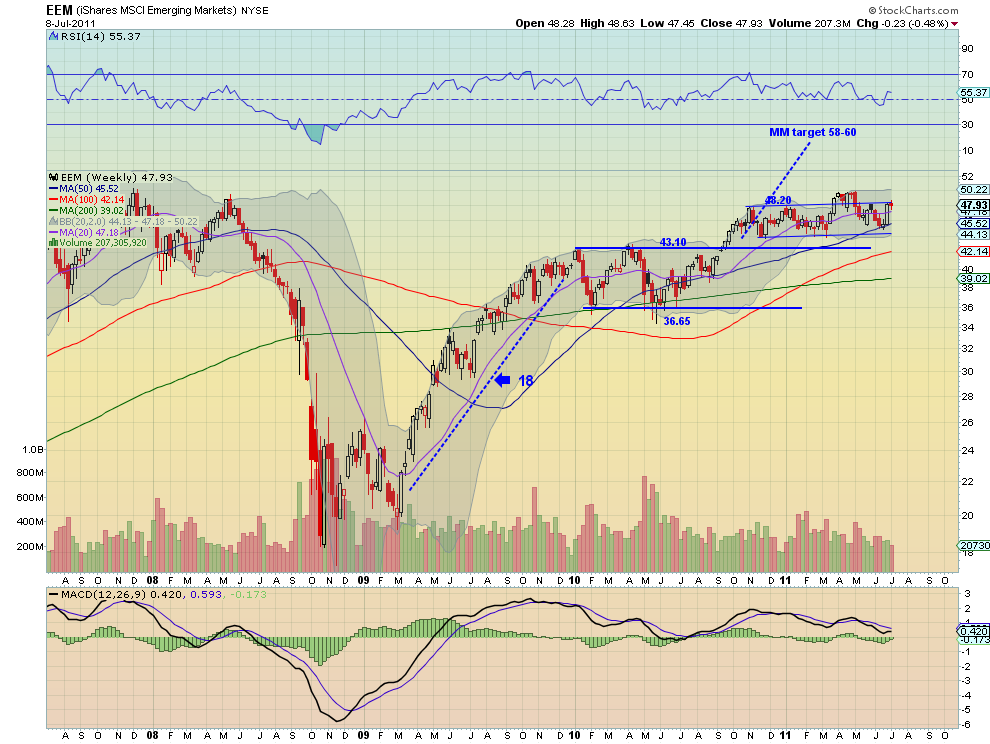
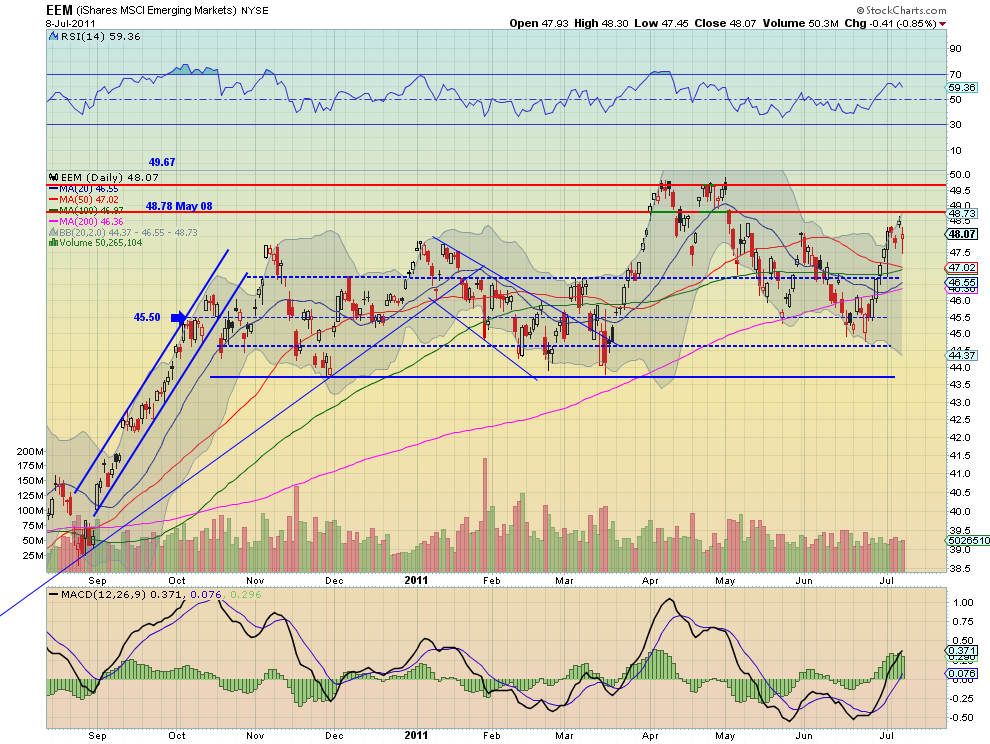
Emerging Markets, as measured by the ETF EEM, consolidated in a wide range this week. The daily chart shows the RSI topping and the MACD waning. The weekly chart shows the RSI leveling as price reaches the top of the channel but with the MACD improving. Again the weekly chart trumps and gives a bias to the upside. Look for a move above 48.78 next week to run to test 50. Failure would lead to pullback to support at 46.70.
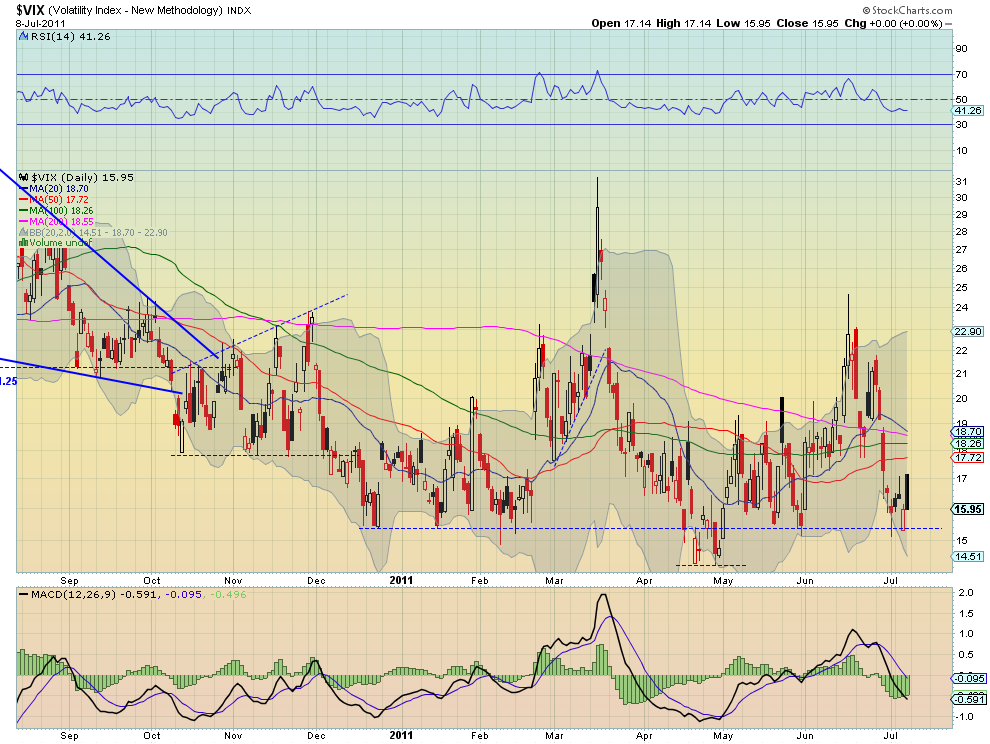
VIX Weekly, $VIX
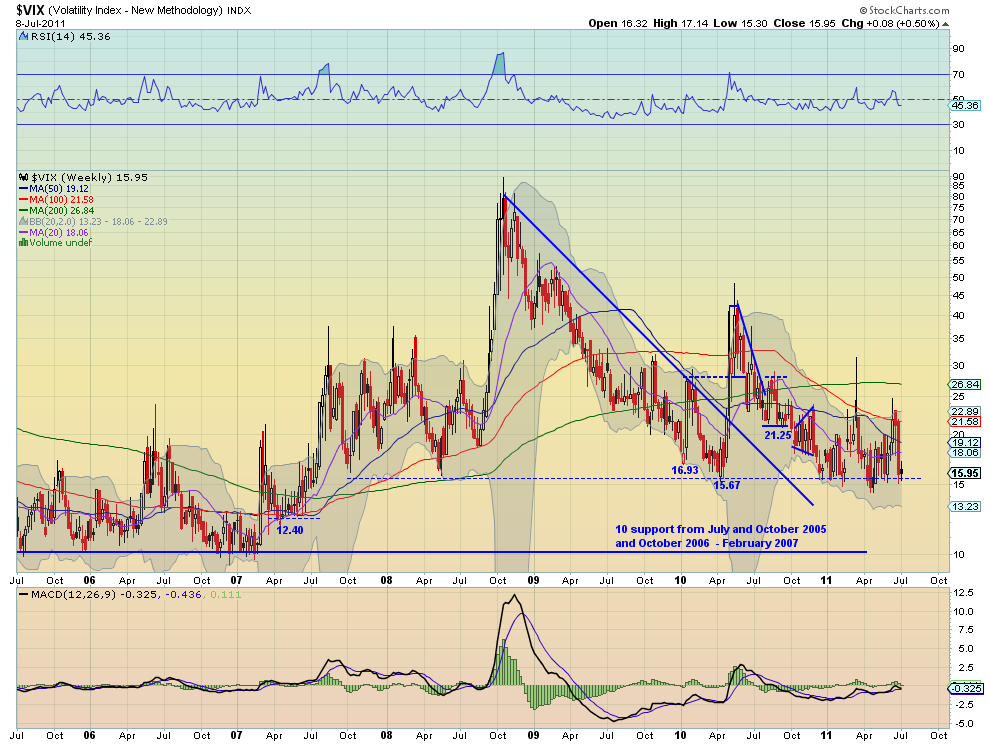
The Volatility Index settled lower for the week in a tighter and lower range finding support at 15.40 and not breaking far above 17. The weekly chart shows the RSI trending lower but but leveling, and the MACD starting to improve. The weekly chart shows support at 15.67 holding and a RSI and MACD that are hovering around the mid line and the zero line. Look for continued subdued volatility in the coming week within a range of 15.4 to 22.
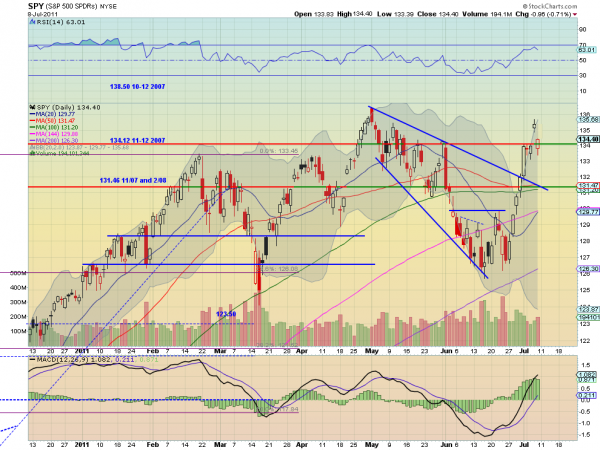
SPY Weekly, $SPY

The SPY settled into a flag higher after pulling back from a gap higher on Thursday. The daily chart shows the RSI curling lower off of the 70 area with a MACD that is leveling and starting to move lower. Both suggest downside to come despite the positive price action. The weekly chart shows a move higher to retest the trend line from the March 2009 lows printing an evening star or spinning top. The shadows are in between. The RSI is moving higher and the MACD is improving towards a potential positive cross. The short term trend remains higher and expect more upside for the coming week with resistance at 135.5 and then 136.50. Any pullback should find some support at 131.46 and below that 130.
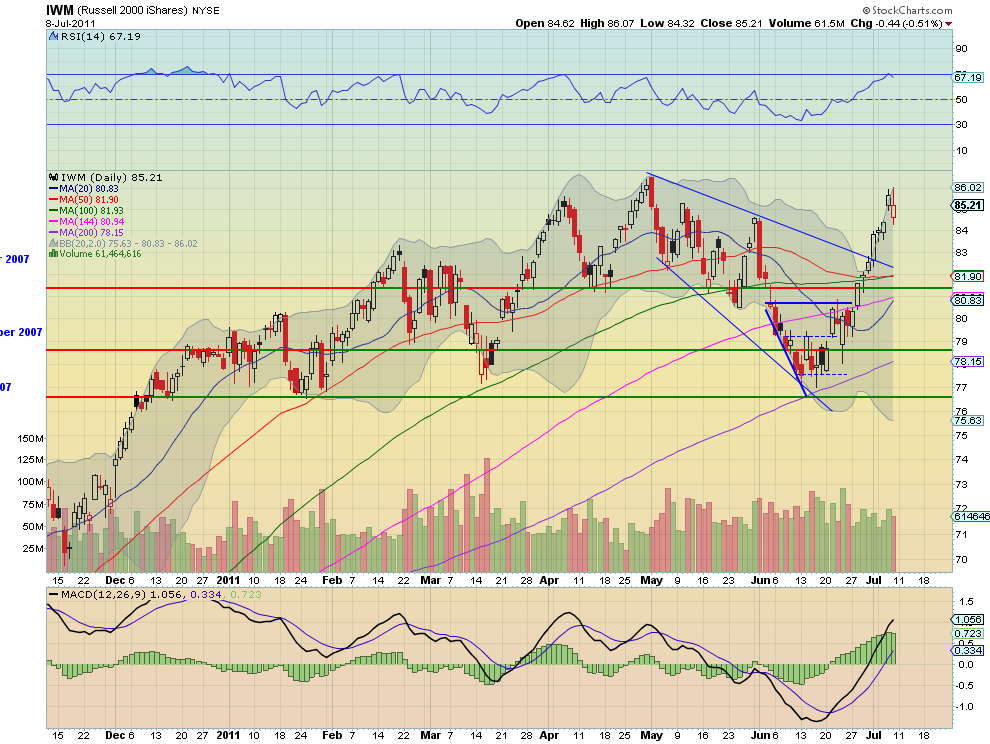
IWM Weekly, $IWM
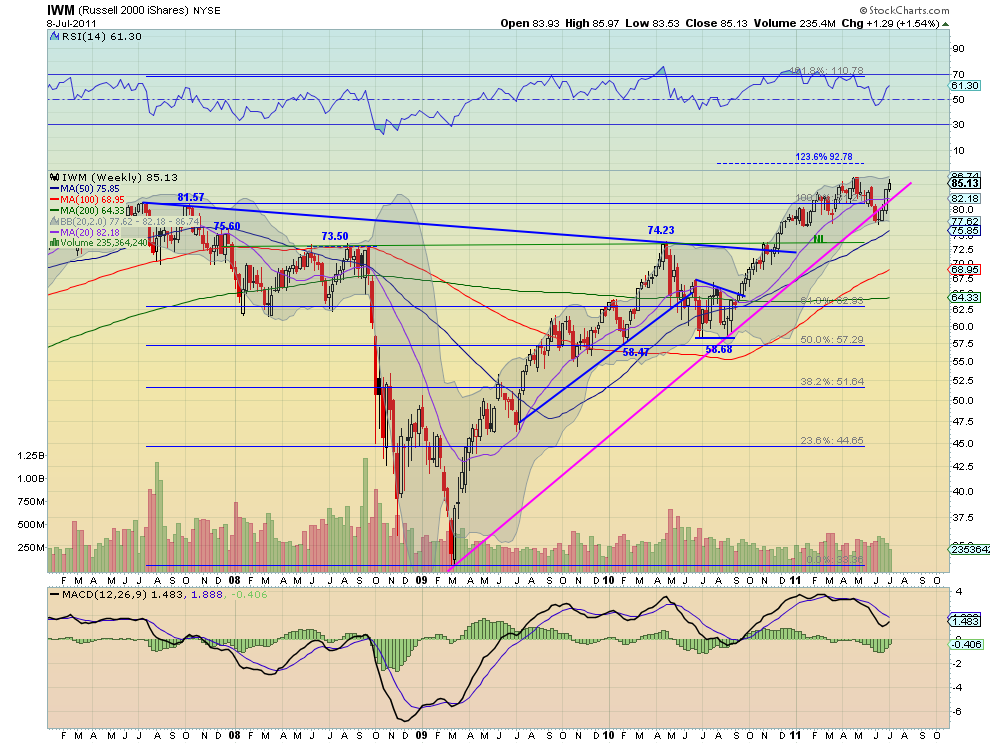
The IWM moved higher but pulled back from a gap higher on Thursday. The daily chart shows the RSI curling lower off of the 70 area with a MACD that is leveling and starting to move lower. Both suggest downside to come despite the positive price action. The weekly chart shows a move higher to retest the previous high but printing an evening star. The RSI is moving higher and the MACD is improving towards a potential positive cross. The short term trend remains higher and expect more upside for the coming week with resistance at 85.60 and then 86.55. Any pullback should find some support at 84.20 and below that 83.50 and 81.57.
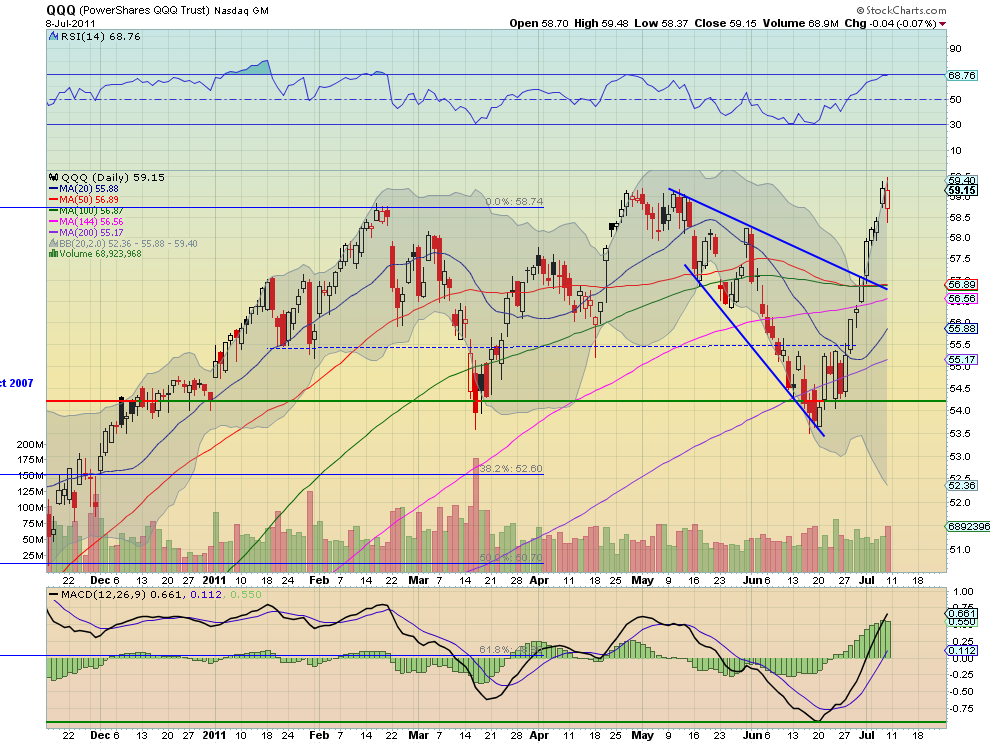
QQQ Weekly, $QQQ
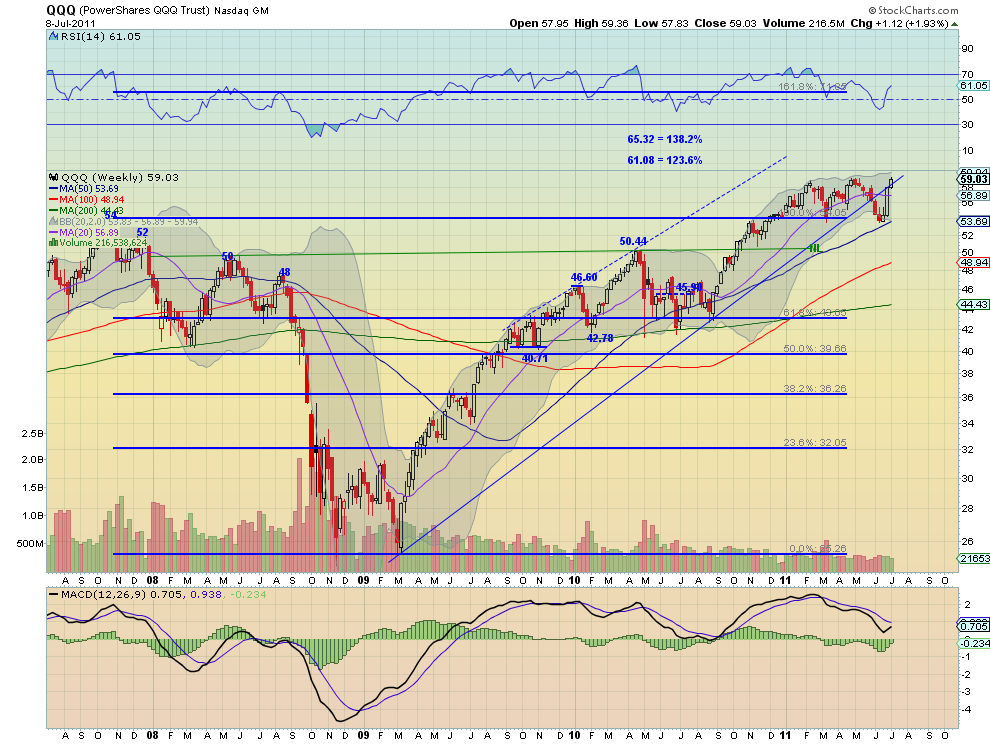
The QQQ moved higher but pulled back from a gap higher on Thursday. The daily chart shows the RSI leveling off of the 70 area with a MACD that is also leveling and starting to move lower. Both suggest downside to come despite the positive price action. The weekly chart shows a move higher above the trend line from the March 2009 lows but printing an evening star. The RSI is moving higher and the MACD is improving towards a potential positive cross. The short term trend remains higher and expect more upside for the coming week with resistance at 59.21 and then 60 and 61.08. Any pullback should find some support at 58 and below that 57.50 and 55.50.
The coming week looks for Gold and Crude Oil to both continue higher. The US Dollar Index and US Treasuries to move higher towards resistance at 77.30 and 97.30 respectively. The Shanghai Composite and Emerging Markets also are biased to the upside, although both have resistance nearby. Volatility looks to remain stable and subdued allowing for the Equity Index ETF’s SPY, IWM and QQQ to continue higher. But each are showing signs of a pullback in the short timeframe that could translate into the weekly timeframe quickly, with Treasuries moving higher as a possible catalyst. Look for upside but keep the stops tight. A reversal could come quickly. Use this information to understand the major trend and how it may be influenced as you prepare for the coming week ahead. Trade’m well.
Etichette:
Analysis Technic,
analysis technic article,
articles,
crude oil,
Currencies,
dollar index,
eMini Nasdaq,
eMini SP,
energy,
financials,
Index,
market articles,
oil
What Happened to the Jobs?
By John Mauldin
So How’s That Stimulus Thing Working Out?


So How’s That Stimulus Thing Working Out?
This Time Is Different
Vancouver, New York, and Maine
>
The US jobs report came out this morning, and it was simply dismal. This week we look at not only the jobs report but also “what-if” proffers for the US and global economies. There’s a lot to cover, so let’s jump in.
First, there were only 18,000 jobs created in June, the lowest since September 2010. While private employment rose by 57,000, government workers dropped by 39,000, continuing a trend as governments at all levels work to cut their budgets. Long-time readers know I think it is important to look at the direction of the revisions, and we got no help. May was revised down by 29,000 jobs and April a further down 15,000.
I saw some headlines and talking heads in the mainstream media saying the poor number was due to “seasonals,” and I just shook my head. If you are that reflexively bullish when presented with what was clearly a bad report, how can you be taken seriously? You know who you are. And then Philippa Dunne of the Liscio Report sent the following note. She is one of the best data mavens there is on jobs and employment.
“After the release, some bulls turned to that old reliable excuse – bad seasonals. According to one analysis making the rounds, had the BLS used last year’s factor – computed, of course, using exactly the same concurrent technique as this year’s factor – the gain would have been 221,000! (Whoever did this made a mistake by comparing the NSA and SA levels for the two months – you have to compare the over-the-month changes.) Still, if you’re going to play this game, you should be consistent, and apply last year’s seasonals to several months, not just one. If you do that, May’s gain of 25,000 would turn into a loss of 19,000, and June’s gain would be a mere 73,000, all total payrolls. In any case, why should you do that? The seasonals are recomputed every month based on recent experience and calendar quirks, and should be more aggressive in a recovery. (Hope we won’t be using the trend set in the depth of the recession as the bar going forward.) Also, there is no adjustment to the headline number – the sectors are adjusted separately (96 different industries at the 3-digit NAICS level, to be precise) and the total is the sum of those components. The whole argument is bogus.”
The household survey was even worse. Total employment fell by 445,000. Full-time employment is down by 0.5% in the last year, while part-time is up 3%. David Rosenberg calls this the just-in-time labor market. The total number of unemployed rose to over 14 million. If you count the discouraged workers not in the official unemployed, the total number rises to 20.6 million, up 483,000 last month. This put the unemployment rate back up to 9.2%.
So How’s That Stimulus Thing Working Out?
We were told that the stimulus would have us down to 6.5% unemployment by now. The team at e21 has the real story:
“Back in January 2009, Christina Romer and Jared Bernstein of the Obama adminstration produced a report estimating future unemployment rates with and without a stimulus plan. Their estimates, which were widely circulated, projected that unemployment would approach 9% without a stimulus, but would never exceed 8% with the plan. The estimates, along with real unemployment rates, are posted below:

If you update the graph for today’s report, you find that there is another red dot higher than the last one. The last three months have seen the unemployment rate rise (chart from e21). They further note:
“For example, there is new research that suggests that the stimulus may actually have resulted in a net loss of jobs. Regardless of the exact number of jobs lost or created, however, the fact that some economists are even arguing that it had a negative impact tells you that the stimulus may very well have been a wash overall.
“Larry Lindsey offered his own review of the stimulus this week, arguing that it failed what’s colloquially known as the Sharp Pencil Test. As he explains, ‘if you sit down and do a back of the envelope calculation of the [stimulus] program’s costs and benefits, there is no way to conjure up numbers that allow it to make sense.’ Here is more on how Lindsey applies this test to the stimulus:
“ ‘[E]ven if you buy the White House’s argument that the $800 billion package created 3 million jobs, that works out to $266,000 per job. Taxing or borrowing $266,000 from the private sector to create a single job is simply not a cost effective way of putting America back to work. The long-term debt burden of that $266,000 swamps any benefit that the single job created might provide.’
“At minimum, the public now deserves a response from policymakers about what they have learned from 2009 and 2010 – about what actually does and does not help get the economy growing and producing more jobs.”
The small businesses that are the real drivers of employment are not participating the way they do in a normal recovery. Bill Dunkelberg, fishing buddy and the chief economist for the National Federation of Independent Business, writes me this afternoon:
“Writing about our current weak economy (Philadelphia Inquirer Currents, June 26), Mark Zandi argued that employment will improve because ‘…U.S. companies are in great financial shape’. Dr. Zandi must be referring to companies like GE which just posted profits of $17 billion (and paid no income taxes) and whose CEO is the head of President Obama’s job creation committee. This is the view in Washington and Wall Street that only thinks in terms of the “biggies” (that make large donations to re-election committees). For perspective, GE employs about 150,000 people in the U.S. Last week, over 400,000 people filed initial claims for unemployment (e.g. lost their jobs). There are 6 million firms in the U.S. that employ 1 or more workers. This includes GE, but 90% of them have fewer than 20 employees. These firms are not ‘in great financial shape’ as Dr. Zandi asserts. In a recent survey of a sample of 350,000 of them, 46% reported that profits were still falling two years into the ‘recovery’ compared to 18% reporting that earnings were improving. Firms like GE might hire more due to their good fortune, but there aren’t many of them and they don’t employ many workers anyway. It’s the small businesses that Treasury Secretary Geithner said must be taxed more to support government that provide the needed jobs, not ‘tax-free’ GE.
Regulations such as the new mandatory sick leave passed by City Council are detrimental to the job creation needed by making labor more expensive to hire, a bad idea.
“Dr. Zandi also suggests that state and local governments be given more funding to prevent the predicted loss of 250,000 public sector jobs over the next 12 months, funded I guess by more debt, since the Federal government is a bit short of cash (like $1.5 trillion in deficit). ‘Ending this job loss would go a long way to lifting the job market,’ he asserts. My math says that would reduce job loss by about 5,000 per week. With monthly job loss over 400,000, this hardly makes a difference. Government employment has become bloated because governments don’t have to worry about profitability. When faced with budget problems, politicians tend to make cuts in services like libraries or police protection that hurt voters to show taxpayers why the government can’t live with less instead of cutting patronage jobs and the like whose efforts would not be missed. Government can’t create jobs, but it can create a lot of policies and taxes that prevent jobs from being created.”
I wrote last year about the studies that show that on a net job-creation basis, large businesses reduced their employment over the last two decades. Of course, there are exceptions; but on average, large businesses are not where you get new jobs.
And many of the jobs we got this last month, as few as they were, were not of the high-paying variety. Leisure and hospitality were up 34,000. The average work week was down, and earnings dropped a penny an hour. After inflation, workers are behind, year over year.
By the way, I get the unemployment thing. Today we found out that my daughter Amanda has lost her job.
Sales at the place she worked were down a lot. Another two of my kids can’t get enough hours. At 17, Trey is looking for a job, but so far no luck. It’s tough out there. Let’s look at a few charts from David Rosenberg. First is the average duration of unemployment, which has risen to an all-time high.

Even worse, 44% of those unemployed have been so for at least six months, again close to an all-time high.

OK, I have to use just one more chart, which shows how bad things really are.

This Time Is Different
I have quoted at length in past letters from Ken Rogoff and Carmen Reinhart’s masterful work, This Time is Different. While the market may have been surprised by such a low jobs number, it is PRECISELY what is typical following a credit crisis, as they demonstrate in their book.
And now the Fed is done with QE2 (except that they will take the mortgage roll-off from their portfolio and use it to buy treasuries), and the fiscal authorities are going to put the brakes on government spending, or at least slow things down.
Everything is very fluid, but the headlines in today’s Wall Street Journal suggest a deal on the order of $4 trillion in on the table. I assume it will be back-loaded, but it is a start. But assume that the first year sees real spending cuts of $200 billion. That is a reduction of 1.5% in GDP. It’s that pesky old equation I keep using:
GDP = C (total consumption) + I (Investments) + G (government Spending) + net exports
Now, the literature suggests that the effect on the economy from a reduction in G should be over within about 4 quarters, on average. But then we reduce “G” again the next year. Maybe not by as much overall, but at least by another $50-100 billion. This is going to put a real headwind in the face of economic growth for years, but we simply have to do it or we become Greece.
The economy will already be slowing down. A recession in 2012 is a real possibility if there is any type of shock coming from Europe, and what will happen there is anyone’s guess. I think most European leaders are basing their thinking more on hope than on reality. When Greece defaults there will be a domino effect; you can count on it. And you could actually see a banking crisis before we get actual sovereign defaults.
Gentle reader, you need to understand that the market does not get it. Neither in Europe nor in the US. When someone says the market has already priced in a default, go back and ask them how well the market priced in a crisis in the spring of 2008. The market doesn’t know jack.
I got a lot of internet buzz from a throwaway line in an interview on CNBC in London. I said that if the market knew what Bernanke and the leadership of the central banks talked about after their third glass of wine, the market would wet its pants. That is not to suggest I don’t think Bernanke or Trichet can hold their liquor. It means that they get the problem more than they let on in public and are simply trying to stem as much damage as they can.
Banking crises are followed by credit crises by 2-3 years. It is getting close to that time. We need 3-3.5% GDP growth in the US to really make a dent in jobs. We are not going to get it. There is nothing we can do other than Muddle Through as best we can. Prepare accordingly.
Vancouver, New York, and Maine
I am home for a few weeks. In late July I head for Vancouver to speak at the Agora Wealth Symposium. Then the next week I go to New York for a few days, before heading up with my youngest son, Trey, to Maine for the annual Shadow Fed fish fest organized by David Kotok. It is one of the highlights of my year. So many friends are there. More on that in coming weeks.
In New York I’ll be meeting with Barry Habib. We will soon be announcing a joint venture that we are both excited about. Barry launched the Mortgage Market Guide and sold it a few years ago and is ready for a new venture. As an aside, Barry is the producer of Rock of Ages, a major Broadway hit that is now being done as a movie with Tom Cruise, Catherine Zeta-Jones, Paul Giamatti, Russell Brand, and a lot of other stars. (Barry, how do I get invited to the set?)
If you want Barry’s take on housing and mortgages, he was on CNBC this morning for an in-depth interview. I am proud to be his friend and look forward to working with him. You can see it at http://video.cnbc.com/gallery/?video=3000031675 .
That’s it for this week. I have to say, this has been one of the roughest weeks emotionally and personally for me in a very long time. Nothing that is world-ending, but sometimes being Dad is tough. This is the first week in many years that I did not get my usual 30-40 hours of reading and research in. I am so far behind, but I will catch up.
And a huge thanks to Louis and Kelli Gave, who let 14 of us invade their vacation lake home in Oklahoma with 6 of my kids and their families and friends. It was a great 4th of July. And to see some of the tornado damage up close was amazing. We are so fragile; we have no idea.
Have a great week. Enjoy your friends and families this summer.
Your thinking more about the important things in life analyst.
Etichette:
articles,
Economy article,
Finance article,
market articles,
Unemployment
Subscribe to:
Comments (Atom)


