Tuesday, March 29, 2011

OIL PREDICTS STOCK MARKET DIP

by McClellan Financial
Crude Oil Leading Indication for Stock Prices

March 25, 2011

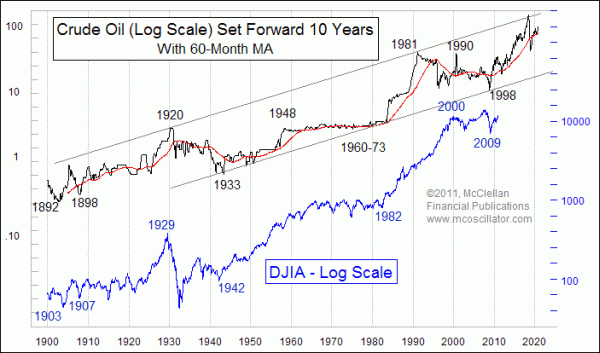
Just over a year ago, I looked at the 10-year leading indication that crude oil prices give for the stock market.  It is time to take another look at that relationship, especially in light of the trouble that it suggests is coming for stock prices.

This week’s chart shows again how the price plot of crude oil prices has done a great job of giving us a macro view of what the trend should be 10 years later for the stock market.  The periods when crude oil prices have moved sideways led to sideways periods for the stock market a decade later.  And the periods when crude oil has trended upward were followed 10 years later by big bull markets in the stock market.

So the fact that crude oil prices have gone from a low of $11/barrel in 1998 to now above $100 is an indication that we should expect a persistent uptrend for stock prices in the decade ahead.  But we should not expect it to be an unbroken uptrend.

When we zoom in closer, we see that oil’s price fluctuations can have important meaning for stock prices about 10 years later.  The timing is not perfect, but the dance steps generally get repeated.
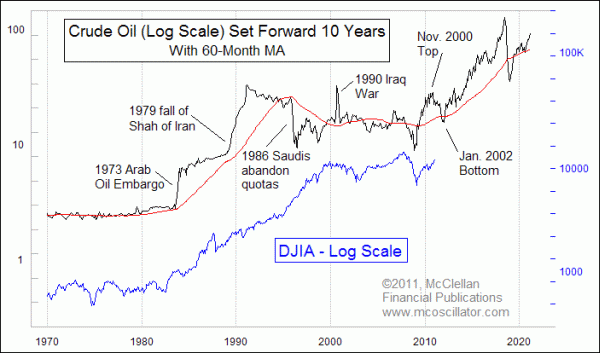
oil's leading indication for stocks since 1970
The one caveat to that principle is that oil price movements that are based on supply and demand forces tend to matter much more than oil price movements brought about by governmental or quasi-governmental forces.  The Arab Oil Embargo in 1973 got the big oil price rise started, but stocks did not match the magnitude of that rise or the additional up leg caused by the Iranian revolution in 1979.  And the oil price crash of 1986 that came about when Saudi Arabia abandoned the production quotas similarly did not bring stock prices down.

The 1990 Iraq invasion of Kuwait caused oil prices to briefly double, but we did not see an exact echo of that spike in the stock market.  When governments put a thumb on the scale and nudge oil prices away from where supply and demand factors would dictate, it does not show up as much 10 years later in the stock market.

Still, the background price pattern movements can clearly be seen as having been repeated in stock prices roughly 10 years afterward.  And now we are into the 10-year echo point of the big oil price decline from Nov. 2000 to January 2002.  So far, the Fed’s POMOs have kept the stock market going higher, so we have not yet seen the echo of that oil price decline being manifested in stock prices.  But given the decades of correlation between stock prices and oil’s leading indication, it is hard to imagine that we will be exempted from seeing some kind of echo of that oil price drop.  When the Fed stops doing POMOs in June, and when the stock market enters the part of the year when seasonality is much weaker, stock prices should finally be allowed to manifest an echo of that 2000-02 oil price decline.

The good news for long term investors is that later this decade we should see stocks echo the big rise in oil prices.  The bad news is that the most likely way for this to happen is not from stocks being worth more, but rather that the dollars needed to buy stocks will be worth a lot less thanks to the Fed inflating the monetary base.  So yes, in the late 2010s, your shares of stock will be worth more dollars.  But those dollars won’t be worth as much.

See the original article >>

ARE STOCKS MORE VOLATILE IN THE LONG-RUN?

by Cullen Roche

Traditional theory has often found that an investor will experience reduced volatility over the long-term.  The implication has led investors to buy into various long-term investment strategies that imply reduced risk.  This study (thanks to Abnormal Returns), however, from Lubos Astor and Robert Stambaugh of the Chicago School and Wharton, finds that stocks are more volatile over the long-term.  While volatility does not necessarily imply risk, the findings are interesting nonetheless.   I’ll expand on the findings in the coming days:
According to conventional wisdom, annualized volatility of stock returns is lower over long horizons than over short horizons, due to mean reversion induced by return predictability. In contrast, we find that stocks are substantially more volatile over long horizons from an investor’s perspective. This perspective recognizes that parameters are uncertain, even with two centuries of data, and that observable predictors imperfectly deliver the conditional expected return. Mean reversion contributes strongly to reducing long-horizon variance, but it is more than offset by various uncertainties faced by the investor, especially uncertainty about the expected return. The same uncertainties reduce desired stock allocations of long-horizon investors contemplating target-date funds.
We use predictive systems and up to 206 years of data to compute long-horizon variance of real stock returns from the perspective of an investor who recognizes that parameters are uncertain and predictors are imperfect. Mean reversion reduces long-horizon variance considerably, but it is more than offset by other effects. As a result, long-horizon variance substantially exceeds short-horizon variance on a per-year basis. A major contributor to higher long-horizon variance is uncertainty about future expected returns, a component of variance that is inherent to return predictability, especially when expected return is persistent. Estimation risk is another important component of predictive variance that is higher at longer horizons. Uncertainty about current expected return, arising from predictor imperfection, also adds considerably to long-horizon variance. Accounting for predictor imperfection is key in reaching the conclusion that stocks are substantially more volatile in the long run. Overall, our results show that long-horizon stock investors face more volatility than short-horizon investors, in contrast to previous research.
In computing predictive variance, we assume that the parameters of the predictive system remain constant over 206 years. Such an assumption, while certainly strong, is motivated by our objective to be conservative in treating parameter uncertainty. This uncertainty, which already contributes substantially to long-horizon variance, would generally be even greater under alternative scenarios in which investors would effectively have less information about the current values of the parameters. There is of course no guarantee that using a longer sample is conservative. In principle, for example, the predictability exhibited in a given shorter sample could be so much higher that both parameter uncertainty as well as long-run predictive variance would be lower. However, when we examine a particularly relevant shorter sample, a quarterly post-war sample spanning 55 years, we find that our main results get even stronger.
Changing the sample is only one of many robustness checks performed in the paper. We have considered a number of different prior distributions and modeling choices, reaching the same conclusion. Nonetheless, we cannot rule out the possibility that our conclusion would be reversed under other priors or modeling choices. In fact, we already know that if expected returns are modeled in a particularly simple way, assuming perfect predictors, then investors who rely on the post-war sample view stocks as less volatile in the long run. By continuity, stocks will also appear less volatile if only a very small degree of predictor imperfection is admitted a priori. Our point is that this traditional conclusion about long-run volatility is reversed in a number of settings that we view as more realistic, even when the degree of predictor imperfection is relatively modest. Our finding that predictive variance of stock returns is higher at long horizons makes stocks less appealing to long-horizon investors than conventional wisdom would suggest. A clear illustration of such long-horizon effects emerges from our analysis of target-date funds.
We demonstrate that a simple specification of the investment objective makes such funds appealing in the absence of parameter uncertainty but less appealing in the presence of that uncertainty. However, one must be cautious in drawing conclusions about the desirability of stocks for long-horizon investors in settings with additional risky assets, such as nominal bonds, additional life-cycle considerations, such as intermediate consumption, and optimal dynamic saving and investment decisions. Investigating asset-allocation decisions in such settings, while allowing the higher long-run stock volatility to enter the problem, is beyond the scope of this study but offers interesting directions for future research.

THE SPECULATIVE PREMIUM IN OIL IS TOO LOW

by Cullen Roche

Interesting findings from Goldman Sachs with regards to oil prices.  This comes from a recent research report from their Commodities Research Team.  In July of 2008 Goldman Sachs famously said the price of oil was not being distorted by speculators.  After a 75% decline in prices they changed their tune and said speculators had in fact distorted prices.  Their retraction said:
“Conversely, speculators bring fundamental views and information to the market, impacting physical supply management and facilitating price discovery. As a result, speculators have a loose relationship with price. In other words, as speculators buy, prices generally tend to rise, and vice versa. Accordingly, speculators also contributed to the extreme price movements over the last two years. For example, new data suggests that speculators increased the price of oil by $9.50/bbl on average during the 2008 run-up. Thus, speculators exacerbated the volatility that was nonetheless rooted in the fundamental imbalance.” (emphasis added)
As I’ve previously stated, I find it hard to believe that there is not a speculative element involved in the price of commodities today.  This is perhaps best seen in “commercial” participants who are now speculating in the markets by hoarding or using various commodities as collateral for financing operations.  Given their 2009 retraction, it’s not surprising to find that Goldman says there is a speculative premium in oil prices currently.  Perhaps more surprising, is their statement that the speculative premium is too small:
“In such an environment, it is not surprising that net speculative long positions in WTI crude oil reached a new record high of 391 million barrels. In comparison, when WTI crude oil prices peaked at over $145/bbl in July 2008, the net speculative long position in the light sweet crude oil contract (future and options) was less than 100 million barrels. We estimate that each million barrels of net speculative length tends to add 8-10 cents to the price of a barrel of crude oil.
Given that net speculative length has been about 100 million barrels higher since the political protests spread from Tunisia and Egypt to Libya (Exhibit 2), this suggests that the oil market has been pricing a $10/bbl risk premium into the price of crude oil due to concerns over potential political contagion to other oil producing states in the MENA region. This is consistent with the fact that Brent crude oil has been trading near$115/bbl in the recent period, $10/bbl above our 3-month target.”
“Crude oil prices fell sharply in a broad liquidation on Tuesday as demand concerns raised by the unfolding events in Japan briefly offset the supply concerns arising from the MENA region. However, net speculative length only declined by 15 million barrels, highlighting the strength of the MENA concerns. Further, as we discuss below, we expect that the increased demand for oil due to the loss of nuclear generation capacity in Japan will far outweigh the demand lost to lower economic activity. More specifically, we estimate that230 thousand b/d of combined residual fuel oil and direct-burn crude oil will be required to offset the nuclear generating capacity lost in Japan. We estimate that to lose a comparable amount of oil demand in Japan would require an 8.0% decline in Japan’s economic activity due to the earthquake and its aftermath.
Consequently, we continue to view a containment of the threat to oil production from the political unrest in the MENA region as the primary downside risk to crude oil prices in the near term, with a downside risk from current prices of near $10/bbl. However, at this time assessing the threat to oil production remains challenging, with the ultimate impact of the initiation of airstrikes this weekend by a coalition including the United States, France, and the United Kingdom enforcing a UN-sanctioned “no fly” zone in Libya still unclear. Further,with reports of protests in Syria and Yemen, hostilities at the Gaza/Israel border, and Saudi troops in Bahrain, the risk of political contagion remains.
These developments suggest that the $10/bbl risk premium may prove too modest, and as the world focuses on MENA and Japan, events continue to unfold elsewhere. This weekend brought reports of a 100 mile long oily sheen spotted on the waters off the US Gulf Coast,20 miles north of the site of last year’s Macondo leak. In the wake of last year’s leak,another leak in the deep water would certainly increase the risk of a reduction in supplies from the US portion of the Gulf of Mexico. Fortunately, the initial tests carried out by the US Coast Guard suggest the “oil sheen” is likely caused by large amounts of sediment, and not fresh oil.
Consequently, the balance of risks to our forecasts remains clearly skewed to the upside,with the primary risk to oil prices over the medium term coming from higher oil prices and their potential to slow the pace of economic recovery.”
See the original article >>

Saturday, March 19, 2011

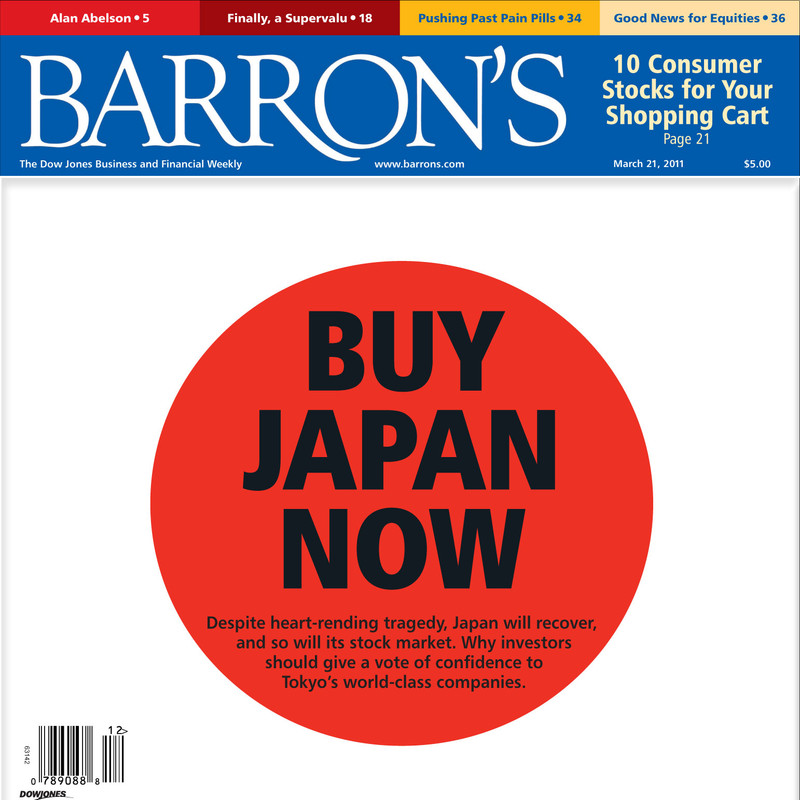
Barron’s: Buy Japan Now

Sugar Turns More Negative After 76.4% Resistance Test


In our last Sugar Update we were looking at potential resistance from a long term Fibonacci level. So far the reaction around this has been negative and now there are further reasons to expect continued weakness.

The Commodity Specialist view

SUGAR 11 - MONTHLY CONTINUATION CHART:
The bull leg that started from a 13.00 2010 low recently saw a test/erosion of the long term 76.4% recovery level.

In the Commodity Specialist Guide we have been awaiting a clear reaction to this, and it has proved negative.

SUGAR 11 - DAILY CHART  MAY-11:
After s/term resistance was found around an old high from Dec a fresh slip has now tested/eroded key, dual, support from the bull channel base and 38.2% 26.00 level.

In the process the neckline of a Head and Shoulders has also been breached, providing an initial bear signal.

Bears may be cautious about chasing the market here, noting a minor Fibo projection at 24.40, but any s/term rally should be temporary at this stage (and probably not deep), ahead of further weakness.
The power should be there to extend to the 61.8% 21.60 area.


Europe's Economic Austerity: a Grimm's Fairy Tale


Conn Hallinan writes: In the Greek town of Aphidal, people have stopped paying road fees. In Athens, bus and metro riders are refusing to cough up the price of a ticket. On Feb. 23, 250,000 Greek protesters jammed the streets outside the nation's parliament.

The Portuguese nominated the protest song "A Luta E' Alegria" (The Struggle is Joy) for the Eurovision song contest and, when judges ignored it, walked out in protest. They also put 300,000 people into the streets of the country's major cities on Mar. 12.

Liverpool bailed from a Conservative-Liberal scheme to supplement government funding with private funding when it found there wasn't any of either, and the British Toilet Association protested the closure of 1,000 public bathrooms across the country.

In ways big and small, Europeans from Greece to Portugal, from Britain to Bavaria are registering their growing anger with the relentless assault inflicted by government-imposed austerity programs.

Wages, working conditions and pensions that unions successfully fought for over the past half century are threatened by the collapse of banking systems caught up in a decade-long orgy of speculation that the average European neither took part in, nor profited from. Even the so-called "well off" workers of Bavaria, Germany's industrial juggernaut, have seen their wages, adjusted for inflation, fall 4.5 percent over the past 10 years.

The narrative emanating from EU headquarters in Brussels is that high wages, early retirement, generous benefits, and a "lack of competition" has led to the current crisis that has several countries on the verge of bankruptcy, including Ireland, Greece, Portugal and Spain. Now, claim the "virtuous countries"—Germany, the Netherlands, and Finland—it is time for these spendthrift wastrels to pay the piper or, as German Chancellor Andrea Merkel says, "do their homework."

It is an interesting story, a sort of Grimm's fairly tale for the 21st century, but it bears about as much resemblance to the cause of the crisis as Cinderella's fairy godmother does to the International Monetary Fund (IMF).

While each country has its own particular conditions, there is a common thread that underlines the current crisis. Starting early in the decade, banks and financial houses flooded real estate markets with money, fueling a speculation explosion that inflated an enormous bubble. In climate and culture, Spain and Ireland may be very different places, but housing prices rocketed 500 percent in both countries.

The money was virtually free, with low interest rates on the bank side, and cozy tax deals cut between speculators and politicians on the other. That kept the cash within a small circle of investors. While Bavarian workers were watching their pay fall, German banks were taking in record profits and shoveling yet more capital into the real estate bubbles in Ireland and Spain. The level of debt eventually approached the grotesque. Ireland's bank debts, if translated into dollars, would be the equal of $10 trillion.

The Wall Street implosion in 2008 sent shock waves around the world and popped bubbles all over Europe. While nations on the periphery of the European Union (EU) tanked first—Iceland, Ireland, Latvia, Romania, Hungry, and Greece, economies at the heart of the EU—Britain, Spain, Italy, and Portugal—were also shaken. According to the Financial Times (FT), total claims by European banks on the Greek, Irish, Italian, Spanish and Portuguese debts alone are $2.4 trillion.

The European Union's (EU) cure for the crisis is a formula with a long and troubled history, and one that has sowed several decades of falling living standards and frozen economies when it was applied to Latin America some 30 years ago. In simple terms, it is austerity, austerity and more austerity until the bank debts are paid off.

There are similarities between the current European crisis and the 1981 Latin American debt crisis. "In both cases debts were issued in a currency over which borrowing countries had no control," says the FT's John Rathbone. For Latin America it was the dollar, for Europe the Euro. Secondly, there was first a period of easy credit, followed by a worldwide recession.

Bailouts were tied to the so-called "Washington Consensus" that demanded privatization, massive cuts in social services, wage reductions, and government austerity. The results were disastrous. As public health programs were eviscerated, diseases like cholera reappeared. As education budgets were slashed, illiteracy increased. And as public works projects vanished, joblessness went up and wages went down.

"It took several years to realize that deflating wages and shrinking economies were inconsistent with being able to fully pay off debts," notes Rathbone. And yet the "virtuous" EU countries are applying almost exactly the same formula to the current debt crisis in Europe.

For instance, the EU and the IMF agreed to bail out Ireland's banks for $114 billion, but only if the Irish cut $4 billion over the next four years, raised payroll taxes 41 percent, cut old age pensions, increased the retirement age, slashed social spending, and privatized many public services. When Ireland recently asked for a reduction in the onerous interest rate for this bailout, the EU agreed to lower it 1 percent and spread out the payments, but only on the condition of yet more austerity measures and an increase in Ireland's corporate tax rate. The newly elected Fine Gael/Labor government refused.

To pay back its own $152 billion bailout, however, the Greek government took the deal. But the price is more austerity and an agreement to sell off almost $70 billion in government properties, including some islands and many of the Olympic games sites.

But the "deal" will hardly repay the debt. Unemployment in Greece is 15 percent, and as high as 35 percent among the young. Wages have fallen 20 percent, pensions have been cut, and rates for public services hiked. Growth is expected to fall 3.4 percent this year, which means that Greece's debt burden is projected to increase from 127 percent of GDP to 160 percent of GDP by 2013. "Your debt will continue to increase as long as your growth rate is below the interest rate you are paying," economist Peter Westaway told the New York Times.

Austerity measures in Portugal and Spain have also cut deeply into the average person's income and made life measurably harder. In Spain, more than one in five workers are unemployed, and consumer spending is sharply off, dropping by a third this past holiday season. Portugal is actually in worse shape. It has one of the slowest economic growth rates in Europe, a dead-in-the-water export industry, and a youth unemployment rate of over 30 percent.

In Britain, the Conservative-Liberal government has cut almost $130 billion from the budget and lobbied for what it calls the "Big Society." The latter is similar to George H.W. Bush's "thousand points of light" and envisions a world in which private industry and volunteerism replaces government-funded programs. The actual result has been the closure of libraries, senior centers, public pools, youth programs, and public toilets. The cutbacks have been most deeply felt in poorer areas of the country—those that traditionally vote Labor, as cynics are wont to point out—but they have also taken a bite out of the Conservative Party's heartland, the Midlands.

Conservative voters have organized demonstrations to save libraries in staid communities like Charlbury and to protest turning public woodlands over to private developers. According to retired financial officer Barbara Allison, there are 54 local voluntary organizations that run programs like meals on wheels in Charlbury. "We're already devoting an awful lot of our time to charity and volunteers," she told the FT. "Am I not doing enough? Is [Conservative Prime Minister] David Cameron going to volunteer?" In any case, as Labor Party leader Ed Milliband points out, how does Cameron expect people "to volunteer at the local library when it is being shut down?"

U.S. Treasury Secretary Timothy Geithner strongly endorsed the Cameron program last month and said that he "did not see much risk" that the cutbacks would impede growth. But even the IMF warns that the formula of treating debt as the central problem in the middle of an economic recession has drawbacks. This past October an IMF study concluded "the idea that fiscal austerity stimulates economic activity in the short term finds little support in the data."

But a massive program of privatization does mean enormous windfall profits for private investors and the banks and financial institutions that finance the purchase of everything from soccer fields to national parks. Those profits, in turn, fuel political machines that use money and media to dominate the narrative that greedy pensioners, lay-about teachers, and free loaders are the problem. And austerity is the solution.

But increasingly people are not buying the message, and from Athens to Wisconsin they are taking their reservations to the streets. The crowd in Charlbury was a modest 200, and the tone polite. In Athens the demonstration drew 250,000 and people chanted "Kleftes," or "thieves." But the message in both places is much the same: we have had enough.

A bus driver in Athens told Australian journalist Kia Mistiles that his wages had been cut from 1800 Euros ($2500) a month to 1200 Euros ($1660). "There are more cuts coming into effect in the next three months, that's why the protests are heating up. I am worried that my wages will be cut to 800 Euros ($1110) a month, and if that happens I don't know how I will survive."

But he has a plan. "The situation is reaching a climax," he told Mistiles, "because working people know that the austerity measures go too far, and with the final rollout, they can't survive. So there is nothing to do but protest," adding, "You wait until next summer. The situation in Greece will explode."
It is unlikely that Greece will be alone.

See the original article >>

U.S. Monetary Policy that Encourages Malinvestment


Thorsten Polleit, of the Frankfurt School of Finance & Management, penned an article in The Free Market newsletter of the Ludwig von Mises Institute titled "The Many Names for Money Creation."

It starts off almost humorous, reading more like an interesting, mood-lightening sidebar to a banner article titled "We're Freaking Doomed (WFD)!" as he notes that the dire economic conditions are such that "euphemisms have risen to great prominence. This holds true in particular for monetary policy experts, who are at great pains to advertise a variety of policy measures as being in the interest of the greater good, because they are supposed to 'fight' the credit crisis."

He then illustrates how the term "unconventional monetary policy" is meant to convey the happy virtues of "courageous and innovative", as opposed to the bad old "conventional" monetary policy, which is now "outdated."

In a similar vein, he notes that "Aggressive monetary policy" is meant to signify "bold and daring action for the greater good," and "quantitative easing" is just a confusing term used to make it difficult for people to see "what such a monetary policy really is - namely, a policy of increasing the money supply (out of thin air), which, in turn, is equal to a monetary policy of inflation."

A policy of inflation! Yikes! What was in that article "We're Freaking Doomed (WFD)!"?

From the perspective of the Austrian school of economics (the only true economic theory!), this is not going to be the ordinary kind of inflation, either, but the really nasty, evil kind, where "monetary policy pushes the market rate of interest below the natural rate of interest (the societal time-preference rate), thereby necessarily causing malinvestment rather than ushering in an economic recovery."

In other words, the Fed and the government are making it worse.

And if you want to know about malinvestment, then ask my boss, who never tires of telling me that I am the only employee, alone, apparently in the whole freaking history of employees, that has a consistent negative value to the company, meaning that the bottom-line of the company would be immediately improved if I was, to coin a rhyme, removed.

So I asked her, "What's with that 'improved if I was removed' stuff?" to which she asked, "What are you talking about? You are the one that said that in the previous paragraph, you moron!" to which I asked, "What?" and then she asked, "What?" and then we just looked at each other, confused as hell.

There was an awkward silence, as I struggled as if I was in some weird parallel universe, since her point was that she is, only now, realizing that I am, as an employee, a huge mal-investment, but I can't be fired since I am too old and too savvy not to sue the hell out of all of them for my termination, even though their case is air-tight and I should have been fired long ago.

And, as I never cease saying, some other, much worse mal-investments, such as the stock market bubbles, and the bond market bubbles, and the derivatives bubbles, and the debt bubbles, and the housing bubbles, and the bubbles in the sheer, staggering size of governments, were NOT my fault, but are all the fault of the Federal Reserve creating the money that made it all possible

Now, as if playing right into my hands, Mr. Polleit writes, "Sooner or later the dependence of the people on government handouts reaches, and then surpasses, a critical level," which I assume we have reached.
The worse news is that he figures that "People will then view a monetary policy of ever-greater increases in the money supply as being more favorable than government defaulting on its debt, which would wipe out any hope of receiving benefits from government in the future."

The terrifying point of all of this is when he writes, ominously, "In other words, a policy of inflation, even hyperinflation, will be seen as the policy of lesser evil." Hyperinflation! Gaaahhh!

Hyperinflation! Immediately, I go into We're Freaking Doomed (WFD) mode, which usually involves a lot of hyperventilating and a feeling of panic until I realize that all I have to do is buy gold and silver to keep what is going to happen to everyone else from happening to me, and make a lot of dollars in the process, which always makes me feel better, leading to euphoria, as in, "Whee! This investing stuff is easy!"

See the original article >>

Gold and Silver Correction Ending


Although gold and silver have yet to show much, if any, upside volatility amidst the Japan crisis, the patterns carved out during the past several sessions strongly suggest corrections are ending and new uplegs about to emerge.

Given the uncertain and chaotic environment in the financial markets, this move could be powerfully higher -- towards $1525 in gold and $40.00 in silver -- against a backdrop of a rising euro/USD (falling US Dollar). ETFs that would be benefit include the SPDR Gold Shares (GLD) and iShares Silver Trust (SLV).


See the original article >>

Time for More QE?


We have heard it all before. The market is going up because of QE2. The Fed has got your back. And yes, from early November to mid- February that is all the market did -- it went up. But a funny thing happened along the way -- just when investors got comfortable with the idea of a sure thing -- somebody or something pulled the rug out from underneath them. And oh my goodness, the SP500 is down a whopping 5% from its highs. Ruin!!

And QE2 still continues. So was the reason the market went up in the first place --i.e., QE2 -- the real reason? Or were gains driven by the usual mis-placed perceptions and psychology? If the market continues lower despite QE2, I guess investors will need to reassess their notion about QE2 and possibly QE3.

So how good has QE2 been? Looking at a daily chart of the QQQQ (figure 1), we note that yesterday's lows were in right at the November breakout point that lead to 55 day speculative rip higher that was fueled by never ending QE2 and Fed support for the market. Our virtuous cycle isn't virtuous at all as stock prices are nearly back to the levels when the asset purchase program started.
Figure 1. QQQQ/ daily 


So I guess QE2 hasn't been that good. Stocks haven't gone anywhere. Yields aren't lower. The housing market isn't better. The labor market isn't better. Inflationary pressures are starting to percolate under the surface.

Ahh, but in bureaucratic speak we can only imagine how terrible things would really be if we didn't have QE2. Thus we can spin QE2 as an unqualified success.

And so what is our response to all the recent ills afflicting this market? Of course, more intervention.

This is all you hear these days in response to a lower market or market that isn't doing what the "authorities" want it to do: intervention. The Yen is up (and not doing what we want it to do), so let's intervene. The markets are off their highs, so the G7 should discuss ways to prop up the markets. Stocks are opening lower because of the problems in Japan, and one well known TV commentator pondered if the Fed should signal its intention to intervene and support the markets if needed. And on and on.

Where is the free market? And shame on those who call themselves capitalists yet expect continued intervention.

And remember, the SP500 is only off its highs by about 5%. I cannot wait to hear the clamor if the markets slip another 5%.

Japanese Banking Crisis is Inevitable Despite G7 Currency Market Intervention


Keith Fitz-Gerald writes: The United States and Canada today (Friday) joined other Group of Seven (G-7) nations to intervene as a means of weakening the Japanese yen in an effort to help Japan deal with last week's catastrophic earthquake and tsunami.

This G-7 intervention is a substantial development, although there are precious few details, since none of the world's central bankers (a list that includes the U.S. Federal Reserve) have commented on exactly what "intervention" entails.
Nor have they identified what currencies will be involved.

I believe the G-7 leaders are underestimating the implications of their actions. For starters, there will be Japanese banking failures - caused by the simple fact that huge numbers of people who lost everything and weren't insured (and whose places of employment may have been washed away, as well) won't be able to pay their mortgages, their credit card bills, or their car payments.

There will also be a group of folks who simply won't pay - with a backdrop of uncertainty of this magnitude, they either want, or need, to hold onto every single yen they can in order to survive. I cannot fault them one bit.

Such realities almost certainly will result in Japanese banks writing down or writing off segments of their loan portfolios, either this year or next (at the very latest).

In other words, I'm predicting a Japanese banking crisis - something the central bankers aren't even contemplating right now.

I also believe the very fact that the G-7 had to step in (presumably because the Japanese government, with debt already at 225% of gross domestic product (GDP) before the earthquake, couldn't pull it off alone) means things are much worse (in terms of the world's financial system) than we are being led to believe.

The bottom line: Japan's financial system may crash when the capital inflows that everybody (including the G-7) is now counting on stop - as they ultimately have to. History shows that interventions can only last for so long.

Doubling losses in the Japanese markets from here is not inconceivable and investors must be prepared for that possibility.

Needless to say, that kind of scenario has major implications for global markets, including our own - the most likely of which is a dawning realization that central bankers cannot manipulate currencies and economies the way you turn a thermostat up or down to control the temperature in your home.

By intervening repeatedly - as they have throughout our own financial crisis, throughout the European Union's banking disaster, and now in post-quake Japan - those central bankers are solving short-term problems, to be sure.

However, by removing risk and failure from the marketplace, they are also perpetuating the illusion that they are in control.

If there is ever a situation where I hope I am wrong, this is it.

Here's the rub ... I do not believe that politicians anywhere in the world understand this, which is why their collective strategy of postponement is being conducted in the hope that time will cure all and eventually bail them out.

The only effective discipline will be defaults, as lenders are held accountable for the speculative madness they have engendered. And the only question is when.

In the meantime, there are plenty of opportunities for those investors willing to take a hardnosed look at the world today ... warts and all.

What the Jump in Global Markets Volatility Means?


After the earthquake and Tsunami wreaked horrendous damage in Japan and was blamed for huge drops in equity and other markets, extreme volatility was the best description of most global markets for this last week. The media even blamed the nuclear threat in Japan for the fall in the Dow Jones in the U.S. Clearly, this was not the case, but the extreme nature of the volatility has raised large questions as to what really is going on globally. To see why there is such high volatility over global markets we have to stand back so as to see the full picture.

The U.S. economic scene

Putting the Japanese tragedy to one side and looking at it simply as part of the trigger to the volatility, we have to look at the situation in the U.S. financial markets. Inflation, from food and energy, has risen sharply all over the world. Yes, there is a need to tackle it, but the tools required for the task work in healthy economic climates only.

The U.S. recovery is limping along at best. Housing starts for February dropped 22.5% against a rise of 18% in the previous month, undermining confidence that was in the recovery picking up momentum. So the Fed was right to hold interest rates at their lows and indicate they are continuing to use Q.E. There is a need to combat inflation with higher interest rates but not to combat food and energy inflation. In themselves this type of inflation reduces funds available for spending in other areas and would not be affected by higher rates. So, real interest rates drop further into negative territory, while growth is further undermined. In turn, such a picture points to overvaluations in equity markets. There is every reason to believe that the best current investment is cash in one form or another. With the bond markets overpriced and the prospect of further quantitative easing possible after June to prevent any threat of deflation as growth stumbles even more, the buying power of the dollar, both locally and internationally, is set to decline further. This seems also to be the future of the dollar exchange rate.

At the moment markets are tipping over into negative territory and providing an underlying reason why markets are now vulnerable to heavy volatility.

With the wide ability, at low cost, to leverage investor positions the system of 'stop losses', so important for limiting losses are also volatility precipitants. With a proliferation of day traders in most markets from equity to currencies and beyond, any market condition that produces uncertainty or fear, will become volatile quicker and deeper than were such leverage not so freely available.

In an investment climate that is essentially parochial in the States confidence in the system is higher than in nations who have a less uncomplicated past. In these countries you will find far less confidence in financial systems or in the governments of those nations, so volatility may be sharp but more easily reversed when the emotions drain away.

The state of the developed world

Since the start of the developed world's financial crisis in 2007 we have seen a deepening and widening of the maladies of the financial system there. As with the degeneration of a healthy man into sickness and weakness, the emotions claim a growing percentage of his mind and the vigorous health of the man sinks into declining confidence and fears of what lies ahead. The Eurozone debt crisis, the coming debt crises within the U.S. states and government, the limpness of the economic recovery are similar in nature to that ailing man. That's where we are today.

In fact, the way fear and volatility washed over the developed world's markets on the news of the Japanese woes was symptomatic of the condition of the developed world. That condition will remain even as Japan recovers into the growth of its ravaged areas. The indebtedness of Japan before the crisis and its growing debt afterwards will weaken the Yen promote Japanese exports and produce a level of growth not seen in the developed world for some years now.

Looking ahead to the rest of 2011 and into 2012, we expect the condition of the developed world to ensure that the new crises that are certain to arise will barge into one another making them worse still. The market reactions will continue to reflect the sort of volatility we have seen in the last week. Where real cause for weakness is found we have no doubt that markets will continue to overreact and possibly that overreaction will cause fundamental damage in itself.

We are in a financial winter of a destructive nature. Unfortunately the systems of the developed world are not designed or inclined to the deep reformation needed to bring an economic health, vigor and stability needed to put the developed world onto a long lasting growth path that we all had hoped for.

See the original article >>

Welcome to Volatility


Traditionally, futures volatility is tied to the growing season, at least in the grains. When things are in the bin or the bag, say November to February, price volatility has typically been at the lowest levels of the year. It picks up during the growing season. If that is the case this year, things are going to get REALLY crazy. Implied volatility in corn peaked at 45% this past week, the highest reading since last October. In March of 2010, it was only around 31%. Cotton implied volatility has been around 60% since mid-February, so corn is still comparatively quiet compared to what COULD happen. Past performance is, of course, not necessarily indicative of future results.
 
Corn prices were 19 cents per bushel higher on Friday night than they were the previous Friday. That would have surprised a lot of folks if you told them you expected that outcome on Tuesday. Low prices cure low prices, and some buyers just couldn’t wait any longer to take advantage of the drop since the beginning of the month. South Korea came in, there were rumors of Chinese buying interest, and the USDA confirmed stronger than expected sales were made in the week ending March 4 at 1.337 MMT (52.6 million bushels) of combined old and new crop sales. A private forecasting firm on Friday projected 2011 corn plantings in the US at 91.758 million acres, regarded as a neutral number.  
 
The soybean complex was mixed. While energy was still a popular topic, it was of the nuclear persuasion. Crude oil kept hanging around $100, but that wasn’t enough to get soy oil higher for the week. Soy meal rallied, pulled higher by corn and the other feed grains. Weekly export sales for soybeans were disappointing, but some firms lowered their projected Brazilian production to 69-70 MMT due to quality problems caused by ongoing heavy rains. China announced the third increase since January 1 in the bank reserve requirements, in another attempt to slow inflation. That didn’t appear to have any impact on the soybean market there, or here. A private forecasting firm estimated soybean acreage this spring will be only 75.269 million bushels. Futures prices did not appear to react to the news, probably because it has been assumed that corn picked up intentions at the expense of beans based on the $6.01 per bushel revenue insurance guarantee price.
 
Wheat futures saw the steep slide grind to a halt and a little bit of a bounce unfold. Prices were up anywhere from .59% to 2.46%. KC was in the bullish lead, thanks to ongoing crop problems in TX and OK that will likely mean some wheat being ripped up and replaced with cotton or milo. HRW wheat also has been in demand for export. Gains were slowed a little by Japan worries, with the MOA buying only about a third of its normal weekly tender, and all of that coming from Canada.
 
Cotton futures continued to be plagued by limit moves almost day, in both directions. Despite the increase in allowable daily moves to 700 points per day, the market appeared to want to be even more volatile. Prices lost 2.8% for the week, but that camouflaged a couple limit up days at the end of the week in the front month futures. Weekly export sales were larger than expected on Thursday morning, which helped boost prices. Dryness continues to plague a swath of the southern cotton belt.
 
Here are the Friday night closes for the past four weeks, along with the net change for this week vs. the previous week:
 
 
Commodity


Weekly
Weekly
Month
02/25/11
03/04/11
03/11/11
03/18/11
Change
% Change
May
Corn
$7.22
$7.28
$6.64
$6.84
0.19
2.90%
May
CBOT Wheat
$8.11
$8.32
$7.19
$7.23
0.04
0.59%
May
KCBT Wheat
$8.99
$9.29
$8.23
$8.43
0.20
2.46%
May
MGEX Wheat
$9.29
$9.65
$8.59
$8.68
0.09
1.05%
May
Soybeans
$13.75
$14.14
$13.35
$13.63
0.28
2.10%
May
Soybean Meal
$364.70
$369.70
$350.00
$367.90
17.90
5.11%
May
Soybean Oil
$57.58
$59.48
$55.90
$55.77
0.13
0.23%
Apr
Live Cattle
$114.10
$114.05
$117.13
$111.65
5.47
4.67%
Mar
Feeder Cattle
$129.83
$129.95
$131.55
$128.00
3.55
2.70%
April
Lean Hogs
$90.20
$88.48
$88.15
$88.33
0.17
0.20%
May
Cotton
$184.23
$212.80
$204.94
$199.12
5.82
2.84%
May
Oats
$3.79
$3.90
$3.51
$3.52
0.02
0.43%
May
Rice
$14.31
$14.19
$13.01
$13.64
0.63
4.80%
 
Cattle futures were the biggest loser, sinking 4.67% for the week. Cash cattle prices surged to $118 the previous week from $114, an unusually large jump. They went back where they came from this past week, taking futures with them, and then some. Heavy speculative selling took the spot April $2 past the cash market, trying to anticipate further weakness next week. The wholesale market was up more than 5% for the week, but still comfortably below the 2003 peak. The Friday afternoon Cattle on Feed report was neutral, with March 1 numbers 105% of year ago. While that is yet another month of expansion, it matched the average trade guess exactly. Marketings were on the high side of guesses, while placements were also a little larger.
 
Hog futures eked out a 17 cent gain for the week. Japan’s woes translated into opportunity, with losses of refrigeration and disruptions of slaughter and feeding programs there. They were thought to want more packaged pork products for immediate shipment. On a Thursday/Thursday basis, the pork cutout value was up 1%, or about 9.4 cents per pound. That is a reflection of wholesale demand vs. supply. The preliminary estimate for weekly pork production was down 0.7% from the prior week, but production since January 1 is still about 0.8% larger.
 
Market Watch:  Spring has sprung, or at least it will officially be Spring when traders get back to work on Sunday evening. They will initially be reacting to Friday’s Cattle on Feed report. Livestock reports will be featured this week, with the monthly Cold Storage report due out on Tuesday afternoon, and the quarterly USDA Hogs & Pigs report coming out on Friday afternoon. The Census Crush report will be on Thursday morning, along with Census Cotton Consumption and USDA weekly Export Sales. Friday will also mark the last trading day for April grain options.

See the original article >>

Follow Us