by John Mauldin
I am on yet another plane and writing, and I’ll finish this letter in Phoenix. As I start, I am not sure of a theme for this week’s letter, so (with a tip of the hat to my friend Burton Malkiel, who I will see at Rob Arnott’s conference in a few months), today we do a Random Walk Around the Frontlines, surveying what’s going on in the world. We’ll start with the Fed and interest rates, look at inflation, and see how far we get. And I might get a little controversial, but long-time readers know that is not all that unusual.
But first, I want you to mark your calendars for April 28-30, when I will host, along with my partners at Altegris Investments, what I think will be the single best investment conference of the year. It will be the 8th annual Strategic Investment Conference in La Jolla. Let me give you the Killer’s Row line-up of speakers, in alphabetical order. Martin Barnes (Bank Credit Analyst), Marc Faber, Niall Ferguson (author and Harvard Professor), George Friedman of Stratfor, Louis-Vincent Gave (of GaveKal), Neil Howe (the Fourth Turning), Paul McCulley (if he ever surfaces from his fishing vacation), David Rosenberg, Dr. Gary Shilling, Jon Sundt (of Altegris), and of course, your humble analyst. I mean, really. Most conferences have one or two top-tier headliners. We have nothing but the best. These guys are all great speakers, but getting them on panels together? Way cool. Plus some of the best hedge fund managers (personal opinion) show up to give you their thoughts. And maybe a surprise last-minute guest or two. If this conference lineup were a baseball team, they would sweep the World Series. Oh, and the best part? Your fellow conference attendees. The interaction among them is what truly makes this conference the best.
We (well actually, Altegris) will soon start sending out invitations, but you can register today at
http://hedge-fund-conference.com/2011/invitation.aspx?ref=mauldin. Sadly, the conference is limited to accredited investors with a net worth of more than $2 million, as there are funds presenting that require that minimum (and some even more). Those are the rules we have to live with, whether I like them nor not (I don’t, as long-time readers know). But we follow them religiously.
Every year the conference sells out. Every year some of you wait to the last minute, thinking we can “always take one more.” We can’t. There is a limit to the space. If you have attended in the past, call your Altegris representative and make sure you get on the list. Do not procrastinate.
Now more than ever you need to consider the place for alternative investing in your portfolio. I work with partners around the world for both accredited and non-accredited investors. If you would like to know more, then go to
www.johnmauldin.com and click on The Mauldin Circle, register there, and someone will call you. Seriously, the teams at Altegris (for US accredited investors), CMG (for those with net worth less than $2 million in the US), ARP (Europe), and others have some very innovative and interesting funds and managers on their platforms that really deserve a look. Even if you can’t make the conference, your portfolio will thank you for finding some alternative investments that make sense in these times. Now, to the letter.
An Improving Economy
The US economy continues to improve in fits and starts. While industrial production was down 0.1% in January, much of it was weather-related, and December was revised up to a healthy 1.2%. Production surveys indicate that production is likely to continue its upward trend.
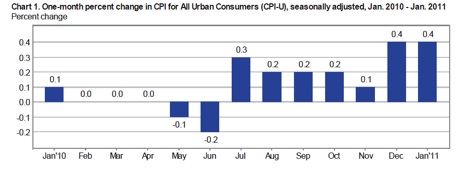
Inflation is turning back up. The ECRI Future Inflation Gauge has been up for three straight months and is starting to show that worries about deflation, absent a shock to the economy, are going away. Core inflation is still up only 1% from a year ago, while overall inflation is up 1.6%.
But I want you to note the chart below from the recent BLS release. Notice that inflation for the last six months has risen rather smartly. And for the last three months inflation on an annualized basis is running over 3%, if I did the math correctly.
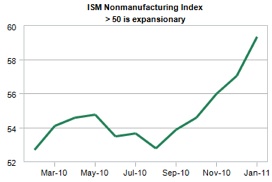
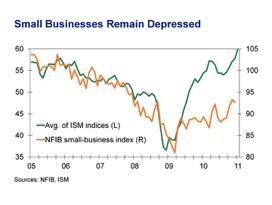
The ISM numbers came out for January and they were robust. The number was back above 60 for the manufacturing portion, which is quite healthy. And the service sector showed a very respectable 59.4.
So, what’s not to like? Economy.com compared the ISM numbers with the National Federation of Independent Businesses small-business index; and small businesses, the driver of growth in jobs, just haven’t responded in the same fashion as their larger brothers.
But Where Are the Jobs?
And that lack of optimism is showing up in very weak job growth. While January’s abysmal number is likely due to weather and we should see a much better number for February, it is still not getting us the jobs we need. With governments cutting back on employees, it is likely we will need to see as many as 125-150,000 jobs a month just to keep up with population growth.
Ben Bernanke spun the recent drop in the unemployment number like this:
“Following the loss of about 8-3/4 million jobs from 2008 through 2009, private-sector employment expanded by a little more than 1 million in 2010. However, this gain was barely sufficient to accommodate the inflow of recent graduates and other new entrants to the labor force and, therefore, not enough to significantly erode the wide margin of slack that remains in our labor market. Notable declines in the unemployment rate in December and January, together with improvement in indicators of job openings and firms’ hiring plans, do provide some grounds for optimism on the employment front. Even so, with output growth likely to be moderate for a while and with employers reportedly still reluctant to add to their payrolls, it will be several years before the unemployment rate has returned to a more normal level. Until we see a sustained period of stronger job creation, we cannot consider the recovery to be truly established.” (Hat tip: David Kotok)
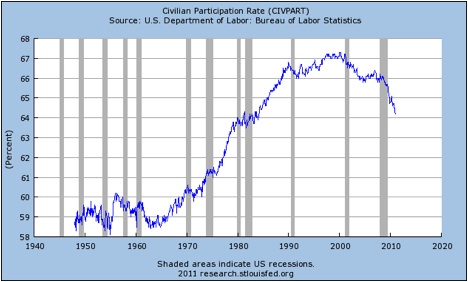
The recent drop in the unemployment rate was not due to those million new jobs he referenced above, however. It was entirely due to rather dramatic drops in what is known as the participation rate. At the risk of repeating myself, if you have not looked for a job in the last four weeks you are not considered unemployed. You are not “participating” in the labor market. Look at the next chart and notice the significant drop since the onset of the recession.
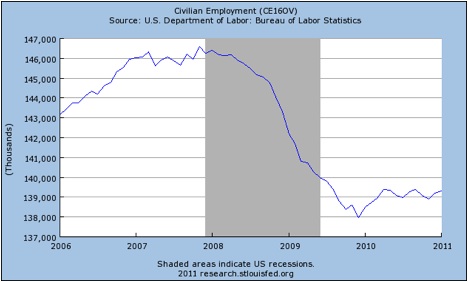
That takes us to the next chart, which shows total civilian employment. Note that the total number of jobs, since we began to create jobs in late 2009, has risen by about a million and then gone sideways for the last six months or so.
It was not job creation that lowered the unemployment rate. It was people being so discouraged about the prospect of finding a job that they stopped looking. When and if we do see job creation, those people are going to decide to look for jobs again. And that means we could see a positive jobs report for months on end and not really attack the unemployment rate. It is a false measure in the current economic environment. The real measure is the one in the last chart, the total number of jobs.
Time for the Fed to Declare Victory and Go Home
The Fed has a dual mandate from Congress. One is to promote stable prices and the other is to foster employment. However, the Fed is in a tough situation right now. Unemployment in today’s economy is structural in nature, it is not cyclical. It is going to be a long time before we get back to 6%
unemployment. If we could create 6 million jobs over the next four years, that would just about do it. But for that to happen, we need to see a string of solid job reports, better than we have had the last nine months.
As noted at the beginning of the letter, the economic data is improving. Normally that would signal the Fed to start raising rates. But look at the last sentence of the Bernanke quote:
“Until we see a sustained period of stronger job creation, we cannot consider the recovery to be truly established.”
There you have it. Bernanke tells us that rates are going to be low until we see stronger job creation. But with QE2 and rising inflation, there is the risk that the Fed’s two mandates may come into conflict.
It takes at least 12 months (or longer) for monetary policy to work its way into the economy. The current small rise in inflation is not due to QE2. That will show up later. It appears to me the deflation war, at least for the time being, is won (the next recession will bring that worry back). But now, it is time for the adults at the FOMC to stand up and say stop the printing presses.
I remember going to my Dad on a few occasions and asking for permission to do something he wasn’t happy about. He would look at me and say, “Son, not no, but hell no!”
I hope there are members of the FOMC who will vote “hell no” at the next Fed meeting. Further, if we leave rates too low for too long, what will the Fed do when this business cycle comes to its end, as they always do? We need to put some bullets back into the Fed arsenal. It is time to start thinking about raising rates.
This will help savers who are reaching for yield. “Junk” bonds are now at an all-time low of 6.84%. Less than 2 years ago it was north of 20%. Talk about a run! Why? It is yet another aspect of the Fed maintaining rates at too low a level, as the Boomer generation is trying to get as much as it can out of its savings, and the charts on high-yield funds show them going from the lower left to the upper right in quite a sporting fashion. As Rosie noted this morning, they were trading at only 55 cents on the dollar in early 2009. Now there is a 4-cent premium. Is there some more capital appreciation left in this run? Maybe. But the big move has been made.
We as a nation need to understand that the problems we face are not ones that can be dealt with by business as usual. Keynesian stimulus is precisely the wrong medicine. The problem is one of too much debt. We were promised by Bernanke in 2002 that if the Fed moved out the yield curve, long rates would come down. The opposite has happened. Since the beginning of QE2 mortgage rates have risen by 1%. The yield on the ten-year bond is up over 1% since the announcement of QE2.
It’s time for the Fed to declare victory and go home.
Home, Fed Friday, and Tokyo
I fly back to Dallas this afternoon after a speech, and I am ready to be home for a week. Really ready. Next Saturday I fly to Tokyo for a speech on Monday, coming back Tuesday. We will see what the jet lag does, as the jet lag coming back from Thailand has just been brutal.
Reservations are now open for the second “America: Boom or Bankruptcy?” event on March 3rd at the Dallas Lincoln Centre Hotel, from 10:30 am to 2:00 pm. It is called “Fed Friday,” and I spoke last year. It was quite fun. The 2010 event sold out.
“Committed in-person speakers include budget expert David Walker, former Comptroller of the United States, international economic commentator John Mauldin, and other outstanding speakers. The conference theme this year is ‘Is Private Sector Growth Finally Responding to Stimulus?’ The speakers will discuss QEII impact on the stock and commodities markets, taxes, growth, debt, deficits, demographics and other issues. As before, the panel discussion at the end of the conference promises to be quite lively.” You can register at
www.fedfriday.com
It is time to hit the send button. I need to get ready for my speech, as I finish this letter up on Saturday morning. I was just too tired to finish last night, which is very unusual for me. Hopefully I get back on schedule next Friday. Have a great week.
Your got to get back into the gym analyst,


