Monday, April 7, 2014

Control your risk with simple and winning rules – SuperStocks trading signals for 8 April

   
Super Stocks Trading Signals Report

Latest Free Trading Alerts for 8 April Download Historical Results
Open position value at 7 April $ 4,070.70 2014 P/L   +3.66%
   

Mixed long/short open position
Today UTX entry new Short positions  
We stopped DIS at breakeven
3 Open Positions   
1 Long   
2 Short     
2 with Stop Loss at Breakeven

In true signal service, attachments reports are sent to customers also via email, in the evening after the markets close. Those who wish to receive them during the demo, please send me their email address.


I simulated 25% margining and modified initial  capital to $ 500K


1296672115_Stocks
Download Super Stocks Tading Signals for 8 April

1296672488_Chart_4
Download Super Stocks Evening Comment for 8 April-+

   
We are happy to offer free signal service for Super Stocks until the end of March Please send me your email address so I can invite you on my server to do the demo. Mail me to take the offer and start the free service until the end of March michele.giardina@quantusnews.com


Material in this post does not constitute investment advice or a recommendation and do not constitute solicitation to public savings. Operate with any financial instrument is safe, even higher if working on derivatives. Be sure to operate only with capital that you can lose. Past performance of the methods described on this blog do not constitute any guarantee for future earnings. The reader should be held responsible for the risks of their investments and for making use of the information contained in the pages of this blog. Trading Weeks should not be considered in any way responsible for any financial losses suffered by the user of the information contained on this blog.


Rising Interest Rate Realities

By: Michael_Pento

The entire global economy now clings precariously to one crucial phenomenon. That is, how much longer can the central banks of the developed world artificially suppress interest rates at near zero percent?
The violently-negative market reaction to Janet Yellen's comments during her first press conference was a clear indication of how vulnerable the stock market is to the eventual reality of rising interest rates. All Ms. Yellen did was remind investors that the Fed Funds Rate would have to be moved up from zero percent -- probably beginning in the middle of next year. That was enough to send the major averages cascading downward faster than you could say the words "flash trading."

In typical fashion, a cacophony of Wall Street Cheerleaders were quick to dismiss the negative market reaction by claiming investors misunderstood what the new Chairperson meant to say; or that the rookie Fed Head simply misspoke. And, more importantly, these bubble-apologists also were quick to make the case that even once the Fed eventually gets around to raising interest rates, it will merely be a sign of economic health -- a move that the equity market should fully embrace.
The reality is that rising interest rates will soon arrive, either courtesy of the Fed or through free market forces. And a rising cost of money never bodes well for the stock market or the economy. This fact will be especially true this time around because growth -- or the lack thereof -- won't be the salient issue; but rather it will be the attempt to end the Fed's massive manipulation of rates. The removal of the Fed's all-encompassing and price-indifferent bid for Treasury debt will place tremendous upside pressure on rates. And even if interest rates do not increase, the outcome for investors will be equally devastating -- I'll explain the simple reason behind that in a minute.
But first let's see if rising interest rates are really all that good for equities, as Wall Street so desperately wants investors to think.
The 10 Year Note is Spain was trading at the 4% level during October of 2010, while the benchmark IBEX 35 was trading at 10,900. Yields then surged to 7.7% by August of 2012. Not because the ECB raised interest rates, but because the free market deemed its sovereign debt to have come under significant duress. The IBEX tumbled 35% to 7,040 in less than two years.
It was much the same story In the United States. Interest rates went through a secular uptrend throughout the 70's and into the early 80's. This time it was an outbreak of inflation that caused yields to rise. In March of 1971 the Ten Year Treasury had a yield of 5.5%, while the S&P 500's value was 100. By January 1982 the benchmark yield soared to 14.8% and the S&P 500 traded at just 115. During those 11 years the market increased by a total of only 15%, even though consumer price inflation skyrocketed 135%! This means in real terms investors in U.S. stocks lost over 50% of their purchasing power.
Staying in the U.S., rising rates in 1987 didn't bode well for the market either. The Ten-Year Note started off in January at 7.01%, and jumped to 10.23% the month before the Dow crashed 22.6% on October 19th 1987.
It is true that there are brief periods when stocks rise at the onset of rising rates. However, the reasons why interest rates increase in a significant and protracted manner are because of rising inflation and/or burgeoning debt levels -- and that is never healthy for equity values or economic growth.
What will happen to our debt-laden economy once interest rates normalize? Municipalities will come under great stress, as they try to manage soaring debt service payments from a tax base that is quickly eroding. Real estate flippers will be dumping their investment properties, as home prices begin to tumble once again. Equity market investors will sell shares, as the record amount of margin debt is forced to be liquidated. All forms of adjustable rate consumer debt will come under duress, severely hampering discretionary consumption. Banks' capital will be greatly eroded as their loans, MBS and Treasury holdings go underwater -- vastly curtailing the amount of new credit available to the economy. The Fed will be deemed insolvent as its meager capital quickly vanishes. Interest payments on Federal debt will soar, causing annual deficits to skyrocket as a percentage of the economy. And, the over $100 trillion market for interest rate derivatives will go bust. This will be the result of creating an economy that is completely addicted to debt, asset bubbles, ZIRP and QE for 7 years.
In essence, the entire economy will collapse...perhaps this is the real reason why the Fed found it expedient to completely remove the numerical unemployment rate target for when it would begin rising rates. Let's be clear; the Fed is ending QE not because the economy has reached the inflation and unemployment goals it set out to achieve, but rather from fear of the monstrous size of the balance it has created.
But what if interest rates don't rise as a result of the Fed's exit from QE? If interest rates stay at these record-low levels it will be because the private market supplanted all of the Fed's purchases at these ridiculously-low yields. The only reason why that would occur is if the tremendous deflationary forces unleashed in the wake of the Fed's absence from its support of money supply growth causes equity and real estate prices to tumble, bringing the economy along for the ride.
In either case the outcome for investors will be shocking. Market participants should prepare now for the failed exit of QE. On the other side of this imminent revelation will be unsurpassed volatility between inflationary and deflationary forces, which will dwarf those experienced during the credit crisis. Because of the unprecedented and unsustainable amount of debt outstanding, central banks now face only two choices: stop printing money and allow a devastating deflationary cycle to pop the asset bubbles that exist in equities and real estate; or continue expanding the money supply until hyperinflation eradicates the middle class and the economy.
Therefore, our Investment outlook remains very cautious. It should be noted that the S&P 500 is up just 2%, and we are in April. That paltry return is not worth the risk of being anywhere close to fully invested. In fact, I believe a trap lies in waiting for long-only investors. An anemic global economy, a record amount of margin debt and the Fed's tapering of asset purchases will cause a sharp selloff very soon. To be specific sometime between now and before summer gets going. We will use that opportunity to get back into the market at much lower prices.

See the original article >>

More bad news from U.S. stocks

By Nick Gentle and Stephen Kirkland,

U.S. stocks fell, as the Nasdaq 100 Index extended a two-month low and consumer shares sank a third day. European equities fell from a six-year high, while Spanish and Italian bonds retreated.

The Standard & Poor’s 500 Index lost 0.5 percent at 10:31 a.m. in New York. The Nasdaq 100 fell 0.4 percent after a 2.7 percent slide on April 4. The Stoxx Europe 600 Index fell 1.2 percent, the most in a month, and the MSCI All-Country World Index slipped 0.6 percent. The yield on Spain’s 10-year bond rose three basis points to 3.18 percent. Treasuries advanced to the highest level in more than a week.

The Nasdaq Composite Index of technology stocks slid the most in two months on April 4 amid concern valuations on the world’s best-performing industry have advanced too far. Federal Reserve Bank of St. Louis President James Bullard will speak today after a lower-than-estimated U.S. payrolls number last week. Bonds fell after European Central Bank Governing Council member Ewald Nowotny said there’s no immediate need for further action on new stimulus.

“The question today is will investors see this as opportunity to buy the dip, or do they stay on the sidelines and wait to see earnings strength in the first quarter?” Kate Warne, a St. Louis-based investment strategist at Edward Jones & Co., which manages $787 billion, said by phone. “The fundamentals remain pretty good, but sentiment can change quickly, as we saw on Friday.”

Consumer Rout

Consumer stocks fell 1.1 percent today, the most among the 10 main S&P 500 groups, after dropping 1.7 percent on April 4. The industry has lost 5.1 percent since a record close on March 6.

Alcoa Inc., the largest U.S. aluminum producer, unofficially kicks off the U.S. quarterly earnings season when it releases financial results after the close of trading tomorrow. JPMorgan Chase & Co. and Wells Fargo & Co. are also among the S&P 500-listed companies reporting this week.

Profit for members of the gauge probably climbed 1 percent in the period, analysts now forecast, after anticipating a 6.6 percent rise in January. Sales rose 2.9 percent on average, according to estimates compiled by Bloomberg.

Technology shares have been hit as traders dump the biggest winners of the bull market amid concern valuations have advanced too far.

The Nasdaq Composite Index, which slid the most in two months on April 4, trades at 31.8 times reported earnings of the companies in the index. That’s almost twice the ratio for the S&P 500, which trades at 17 times earnings.

Technology Options

The selling in the Nasdaq 100 Index has sent anxiety among options traders to the highest levels since the flash crash four years ago. More than 1 million bearish options on an exchange- traded fund tracking the index of technology stocks changed hands that day for the most trading in puts since May 7, 2010, the day after $862 billion was erased from the value of U.S. equities in a matter of minutes.

With Twitter Inc. down 32 percent this year, biotechnology shares closing in on a bear market and high-frequency traders getting pilloried, U.S. investors are returning to industrials. An ETF tracking S&P 500 airlines, trucking companies and machinery makers rallied 1.6 percent last week and saw the value of its assets increase by the most ever, data compiled by Bloomberg show.

Mark Mobius, who oversees about $50 billion at Templeton Emerging Markets Group, said he’s buying technology stocks after a global rout left companies such as Tencent Holdings Ltd. trading at “reasonable” valuations.

Good Correction

“If you look at Tencent for example, it’s come down about 20 percent and that’s a pretty good correction,” Mobius, whose Templeton Asian Growth Fund outperformed 88 percent of peers this year, said in an interview in Bloomberg’s Hong Kong office, declining to name specific stocks he’s buying.

Tencent fell 4.5 percent at the close in Hong Kong today, extending its drop from a March 6 record to 21 percent.

European technology shares also slumped. A gauge of technology stocks in the Stoxx 500 lost 1.7 percent, the biggest decline among 19 industry groups, with ARM Holdings Plc falling 2.3 percent and Nokia Oyj sliding 3.1 percent.

Mallinckrodt Plc agreed to buy Questcor Pharmaceuticals Inc. for $5.6 billion in cash and stock to add treatments for autoimmune and inflammatory diseases. Mallinckrodt will pay will $86.08 a share for Anaheim, California-based Questcor, the companies said today. Questcor jumped 31 percent to $88.74 in pre-market trading and Mallinckrodt climbed 7.6 percent.

European Stocks

Altice SA jumped 12 percent, while Bouygues SA slumped 5.4 percent, after Vivendi SA agreed to sell its phone unit SFR to Altice in a deal valued at more than 17 billion euros ($23.3 billion), rebuffing Bouygues’s sweetened offer.

“European markets are following the negative close in the U.S.,” said Benno Galliker, a trader at Luzerner Kantonalbank AG in Lucerne, Switzerland. “The favorites of the past few months, such as technology and biotechnology stocks, seem to be losing some of the glamor.”

The ruble weakened 1.1 percent against the dollar, the biggest decline among 24 emerging markets, and Russia’s Micex Index dropped 3.1 percent in Moscow, the most in a month on a closing basis. The yield on Ukraine’s 2023 bond rose 56 basis points to 9.24 percent and the nation’s benchmark stock gauge dropped 3.5 percent.

Protesters with Russian flags stormed administration offices in the cities of Donetsk and Luhansk, calling for a boycott of the May 25 presidential election. A group temporarily seized offices in Kharkiv before the building was freed. Russian forces shot a Ukrainian military officer to death in Crimea, according to the Kiev-based Defense Ministry.

The yield on 10-year Italian securities increased two basis points to 3.19 percent, after falling to a record-low 3.14 percent. The yield on equivalent-maturity German bunds was at 1.54 percent.

Yields on Treasury 10-year notes fell two basis points to 2.70 percent after the rate dropped eight basis points on April 4.

The euro strengthened 0.3 percent to $1.3744. The yen was little changed at 103.22 per dollar. The Japanese currency was at 141.70 yen per euro.

See the original article >>

A Staggered Start

by Marketanthropology

Our newest normal is off to another solid start this week with emerging market equities (EEM) treading water (~ 0.15%) against the downside performance of the SPX (~ -1.0%). Greasing the differentials in the system is the breakdown in 10-year yields over the past three sessions, which we have speculated would further expedite the continued shift this year away from the domestic equity markets and into bonds. 
Over the past few weeks we have pointed out that the banks (BKX) looked particularly susceptible to a move lower in long-term yields as the carry spread they have benefited from over the past two years becomes squeezed. Although commodities and precious metals are off to a tepid start this week, we expect they will continue to benefit from the character shift in the market as we anticipate the US dollar to roll-over with long-term yields and outperformance by the SPX this time around the block.
Unlike the upside pivots last summer which was first led by emerging markets, then precious metals and eventually the broader commodity complex, the baton relay has been passed this time around the track in the more traditional fashion we feel is representative of a broader cyclical pivot and not another false start. Like the banks in the equity markets, we follow precious metals very closely because of their tendencies to lead large moves in the commodity and currency markets.  

See the original article >>

Flash Boys or Macbeth: Choose Shakespeare!

By Gary DeWaal

I broke my habit this week of reading only softcover editions, and read the hardcover version of Michael Lewis’ “Flash Boys: A Wall Street Revolt”. It seemed the least I could do given all the hubbub in the media about this publication.

As I have mentioned before, one of my co-majors in college was English literature, and I certainly applaud Mr. Lewis for his writing style. He is a gifted author, and is able to leave you hanging after most sentences, only too eager to pounce onto the next.

That being said, I found Mr. Lewis’ non-fiction account of high frequency trading more like a novel than the factual account it purports to be. Many times, Mr. Lewis takes the mundane and ordinary but through exhilarating manipulation of language makes it seem illegal. In other circumstances, Mr. Lewis spends pages upon pages attacking something only to insert a single sentence or phrase actually exonerating the practice he just mightily condemned. But the brief sentence or phrase is buried and boring, and not written nearly as excitedly as his other prose.

For example, Mr. Lewis’ novel, I mean study, begins with an account of the secretive acquisition of property by a company known as Spread Networks, and the installation through sometimes impervious rock of a near straight fiber optic cable from Chicago to northern New Jersey. Clearly Mr. Lewis’ colorful description of these efforts is meant to cast aspersion on the purpose of this project, which is to offer high speed traders a quicker way to route their orders between a data center that hosts the Chicago Mercantile Exchange and one next to NASDAQ’s stock exchange in Carteret, NJ. Just read two sentences:

“[The initial investors] named the company “Spread Networks,” though they disguised the construction behind shell companies with dull names like Northeastern ITS and Job 8. [One investor’s] son… came on board – to cut, as quietly as possible the four hundred or so deals they needed to cut with townships and counties in order to be able to tunnel through them.”

However, buying land quietly in small parcels using many dummy companies is not illegal, and in fact is a smart tactic in order not to drive up the price of property unfavorably. Just ask Walt Disney. Disney used many shell companies (many with mysterious names such as M.T. Lott Real Estate Investments, the Latin American Development and Management Corporation and the Reedy Creek Ranch Corporation) to acquire almost 28,000 acres of land near Orlando, Florida that ultimately became home to Disneyworld. Nefarious? Well maybe because of the high price of an admission ticket these days and the very salty popcorn that is served on Main Street USA; but I think most kids and their parents don’t think so.

Another example: Mr. Lewis spends the first 96 pages excoriating the practices of high speed traders, then casually has one of the heroes of his story (John Schwall, a Wall Street technology insider whose “father had been a firefighter…like his father before him”) ask the question, “[h]ow was it legal for a handful of insiders to operate at faster speeds than the rest of the market and in effect, steal from investors.” Wait, this is a book about folks who have done nothing more than take advantage of market opportunities in a legal way? The problem is that by dramatically juxtaposing the word “steal” — which most folks think of as illegal — next to the word “legal,” it is easy to conclude that something is terribly amiss.

Others have written on both sides of the debate regarding high speed trading far more eloquently than I can and debates about good and bad liquidity will go on for a long time. But to me, since the day I began to be involved with the markets professionally as a trial attorney for the Commodity Futures Trading Commission in 1982, it was apparent that some persons had an edge when they traded, either because they were exchange members or had access to the latest technology, and that other persons who did not share that edge were envious (including me).  Every year, some folks clamored to acquire and use the latest, newest technologies while others decried progress or were frustrated because they did not possess such new advanced means (e.g., remember the outcry when some floor members wanted to use headsets or handheld computers).

This is not to suggest that some high frequency traders, like other traders, may not seek to bend rules illegally or engage in practices that cause real market harm (although, as Mr. Lewis acknowledges, the 2010 “Flash Crash” was precipitated by a mutual fund, not a high speed trading outfit).

This is not also to suggest that some market practices should be reviewed to understand their implications (e.g., make taker practices and rebates to promote market liquidity) and whether there have been unintended detrimental consequences to well-intended regulation (e.g., Securities and Exchange Commission Regulation NMS).

But in and of itself, the fact that some traders have been smart enough to exploit technology and take advantage of legal situations created by regulation is not a problem let alone a crime. And as Mr. Lewis also points out, some folks, like the new exchange IEX, can endeavor to fix perceived problems for their own commercial benefit. This is what capitalism is all about. Carpe diem!

Again, Mr. Lewis’ book is exceptionally well written and engaging, and if you like innuendo and suspense, it’s for you. However, once you begin to deconstruct his tale, you will come away thinking that, ultimately, Mr. Lewis’ story “…is full of sound and fury. Signifying nothing.” However, in my view, Shakespeare’s drama Macbeth, which contains this famous soliloquy, is far more compelling! Better to spend your money on a paperback of that — even an electronic version!

This commentary was part of Gary DeWaal’s “Bridging the Week” newsletter. Click here for complete newsletter.

See the original article >>

Pork to Rise in Japan as Deadly Virus Hits Largest Producers

By: Bloomberg

The most deadly outbreak of a hog virus in 18 years in Japan is raising pork prices and may boost imports from the biggest buyer, supporting a record rally in Chicago.

The Agriculture Ministry has discovered 186,825 cases of porcine epidemic diarrhea in 251 farms in 19 prefectures since it confirmed the latest outbreak of the contagious disease in October. As many as 39,285 pigs have died, the highest number of fatalities since 1996, Tomoyuki Takeshita at the ministry’s animal health division, said today.

The U.S., Canada, South Korea and Taiwan have also reported outbreaks. More than 5,000 cases have been reported in the U.S., according to the National Animal Health Laboratory Network. American pork production may drop by the most in three decades this year, Rabobank International estimates. Futures climbed 49 percent last quarter, the biggest rally in 15 years, as the virus threatened U.S. production.

"The disease will start having an impact on pork supply from around June as it spread to Kagoshima and Miyazaki prefectures in December, and pigs become ready for slaughter after six months," said Akio Tamai, a pork and beef markets researcher at Agriculture & Livestock Industries Corp. in Tokyo.

Hog futures for June settlement gained 0.2 percent to $1.208 a pound at 9:50 a.m. on the Chicago Mercantile Exchange. Prices reached a record $1.33425 March 18. The virus has increased costs for hog-farm operators such as Smithfield Foods Inc. and Maschhoffs LCC.

Wholesale prices of pork carcasses traded on markets across Japan jumped 17 percent to 484 yen a kilogram ($2.13 a pound) on average in February from a year earlier, data compiled by the ministry showed. Prices in Tokyo gained 2.2 percent to 519 yen a kilogram on average on April 4 from a day earlier.

Meat Packers

Prices in Japan will probably extend gains for the next six months, boosting costs for meat processors including Nippon Meat Packers Inc., as the piglet-killing illness shows no signs of abating and will worsen a seasonal decrease in supply during summer, according to Agriculture & Livestock Industries Corp.

Kagoshima is Japan’s biggest pork-producing prefecture, representing 14 percent of the total Japanese herd. Miyazaki is the second-largest producer with 8.7 percent share, according to the ministry.

The first case in the current outbreak was found in the southern island of Okinawa on Oct. 1. Kagoshima has confirmed 153,000 cases of the disease, or 82 percent of the total.

Pork Imports

"Japanese demand may shift to imported meat because of an outbreak of the disease," said Makiko Tsugata, an analyst at Market Risk Advisory Co., a researcher in Tokyo.

Japan is the world’s largest importer of pork, buying 1.24 million tons last year, representing 18 percent of global purchases, according to the U.S. Department of Agriculture. The U.S. is the biggest exporter with 2.29 million tons in 2013.

The ministry called an emergency meeting of prefectural officials in charge of animal health and disease control on April 2 as the number of infected farms jumped in March. The virus may be spread by people amid transportation of feed, or by animals during their shipments to meat markets, Takeshita said.

The ministry expects 4.1 million pigs will be shipped from farms across Japan for slaughter for meat in the three months through June 30, down 1 percent from a year earlier. The disease may reduce actual shipments by about 1 percent, Tamai said.

See the original article >>

Why Surging Profits Aren't Leading To CapEx And Jobs

by Lance Roberts

This morning I got a call to do a VERY early interview with CNBC Worldwide Exchange to discuss domestic employment and the string of "good" employment reports as of late.

There are a couple of very important points to be made here with regards to employment data as it is reported.  First, there is no real value in discussing one month's worth of employment.  Whether we created 3,000 or 300,000 jobs is irrelevant if it is not put into context. Secondly, how we count, or should I say don't count, who is employed or not is also a very important issue. Just because we choose to exclude a certain group of people from the employment, does not mean that they are no longer relevant to the overall economic discussion.

Therefore, let's put the recent employment reports, as reported the Bureau of Labor Statistics, into some form of context.  The first chart below shows the net monthly increase in jobs on a seasonally adjusted basis.

Employment-Avg-Mthly-Increase-040314

As you will see the economy has created roughly 204,000 jobs per month, each month, since the beginning of 2011. This looks "good" and is certainly an argument for the economic "bulls." However, let's add some context to this discussion.

Employment is a function of demand by customers on businesses. As opposed to many economists and politicians, businesses do not hire employees to be "good samaritans." While such a utopian concept is fine in theory, the reality is that businesses operate from a "profit motive." Given that sales revenue has only grown by 4.3% a year since 2009, the aggregate demand on businesses has not been sufficient enough to expand employment dramatically.

The immediate rebuttal to that statement is always, "yes, but look at corporate profits at all time highs." Corporate profits are another issue that is VERY misleading when taken out of context. Let me give you a very simplistic example to illustrate my point.

Company XYZ sells a gadget for $1.  The costs for manufacturing that gadget, all in, is $0.90 leaving a cash profit of $0.10.  This is what the company now has "in the bank" from which to operate on.

This is crucially important to understand. Companies operate from a cash basis. There are plenty of cases where "profitable" companies have gone out of business due to lack of operating capital from which to function.

However, companies report profits, generally speaking, on an accrual basis. This allows for equal comparisons between companies on an operating basis as well as increase tax efficiencies, etc. Let's restructure our example:

Company XYZ sells a gadget for $1 less expenses of $0.90. However, after amortization, one time writeoffs, depreciation, stock buybacks and other accounting manipulations, the net profit rises to $0.30 on an accrual basis.

We can see this in "real time" by looking at the difference between sales (revenue) growth and operating profits on a per share basis for the S&P 500. (January, 2009 - December, 2013)

Accounting-Magic-040314

Despite surging corporate profitability on an accrual basis, real consumer demand (as measured by what happens at the top of the income statement) is what drives the need for increased employment and capital expenditures. As I discussed recently in "It's Impossible To Replay The 90's" the consumer has likely reached "peak consumption."

It was the 'borrowing and spending like mad' that provided a false sense of economic prosperity. The problem with this is clearly shown in the chart below.

PCE-GDP-032414

In 1980, household credit market debt stood at $1.3 Trillion.  To move consumption, as a percent of the economy, from 61% to 67% by the year 2000 it required an increase of $5.6 Trillion in debt.

Since 2000, consumption has increased by just 1% over the last 13 years. That increase in consumption required an additional increase $6.1 Trillion in personal debt. 

The importance of that statement should not be dismissed. It has required more debt to increase consumption by 1% of the economy since 2000, than it did to increase it by 6% from 1980-2000.

The problem is quite clear. With the consumer heavily leveraged, the inability to "spend and borrow" is reducing aggregate demand.  As stated, the current level of aggregate demand simply isn't strong enough to offset the rising costs of taxes, benefits and healthcare (a significant consideration due to the onset of the Affordable Care Act) associated with hiring full-time employees. Therefore, businesses initially opt for cost efficient productivity increases, and only hire as necessary to meet marginal increases in customer demand which as come from population growth.

As the number of people in the economy expand, they demand more in the form of services. This leads to incremental increases in the need for waiters, airline attendants, bartenders, hospitality staff, etc. This is why the bulk of hiring continues to be primarily focused in these areas. (Unfortunately, these are also the lower wage paying jobs.)

We can see this clearly shown in the chart below which shows is simply the number of "full time jobs" as reported by the BLS as a percentage of the working age population.

Employment-FullTime-Population-040314

The next chart vividly shows that employment has been driven by the marginal increases in demand caused by population growth.

Employment-BLS-Population-040314

Personally, I like to view economic data on an annualized basis. When viewing a singular data point there is no relevancy as to what has occurred previously. However, analyzing the annualized changes reveals the underlying "trend" giving context to the current data. When it comes to economic data, what we really want to know is whether the economy is getting stronger or not.  The next chart tells the story of the relationship between the consumer, employment and business investment.

PCE-FixedInvestiment-Employment-040314

When the data is viewed from this perspective the integral relationship between the consumer and businesses is made quite clear. Employment and fixed investment both "react" to changes in personal consumption expenditures.  This is why the calls for a surge in corporate fixed investment is likely not to materialize anytime soon to any great degree.

With wages stagnant, social benefits comprising the largest share of disposable personal incomes on record and consumer indebtedness on the rise - there is precious little ability for "Main Street" to significantly expand consumption.  While many blame the record low levels of labor force participation on the wave of retirees, the reality is that with nearly 80% of Americans living paycheck to paycheck many of these individuals are not actually retiring. As I stated previously, just because we no longer count millions of working age individuals, it does not make them any less relevant to the overarching discussion of why we continue to struggle with the slowest rate of economic growth in history.

While there is much focus being placed on corporate profitability as a reason to push stock prices higher, there is a finite capability for companies to continue manufacturing bottom line earnings without significant increases at the topline.  As previously discussed:

Corporations continue to push the boundaries of wage and employment suppression, productivity increases and accounting gimmickry to support elevated profit margins. All of these functions are finite in nature, and despite much hope to the contrary, the current set of fundamental variables are more usually witnessed at the end of cyclical expansions rather than the beginning.

Corporate-ProfitMargins-SP500-033114

What we find is that peaks in corporate profits margins have historically corresponded, not surprisingly, with peaks in equity markets. Since the media, analysts and managers push the "stocks are cheap" meme using linear extrapolation of earnings, it is the eventual reversion in earnings that lead to market corrections as expectations and reality collide.

There is one last point to be made.  Currently, there is a majority of analysts, and economists, "hoping" that businesses will suddenly step to the fore and begin a "spending rampage" to boost economic growth. While anecdotal evidence suggests this will not be the case, even if it comes to pass there is likely to be disappointment. Never in history has a segement that comprises 17% of GDP been able to pick up the slack for a segment that comprises 68%. It is function of math that will likely lead to eventual disappointment.

See the original article >>

Mega, Mega Phone pattern…This is not your fathers pattern here!

by Chris Kimble

CLICK ON CHART TO ENLARGE

From the late 1960's until the early 1980's, the Dow looked to create a large mega phone pattern. As it was attempting to break from the top of this pattern, fundamental valuations were low on a historical basis.

The Dow since 2000, looks to be making another large mega phone pattern. The fundamental valuations currently, as the Dow is attempting to breakout, are a little different than in 1982, highlighted in the chart above! Q- ratio now at the same levels as were hit in 1929, 1966 and 2007!

IMHO, this is not your Fathers Mega Phone pattern! Another long lasting bull market about to take place on a breakout of this mega phone pattern? Sure could, yet it doesn't have valuations on its side! Stay tuned....

See the original article >>

Chinese Market to Lead Continued Strong Global Demand for Beef

By: News Release

Rabobank has published a new report on the global beef industry, forecasting continued strong market fundamentals and continued strong global demand led by the Chinese market.

In the report, Rabobank’s Food & Agribusiness Research team says that beef market fundamentals remain positive, with prices driven up across the globe in Q1 2014 by firm demand as well as further tightening supply due to drought-induced herd retention in the U.S. and adverse weather conditions in Brazil and Australia – the three main beef exporters. Combined with fluctuating exchange rates, these events have impacted competitive positions in export markets, with Brazil and Australia gaining export share in Q1 at the expense of the U.S..

The bank says that, on the demand side, beef demand growth will continue to come mainly from China. Although 2014 imports in China are not expected to reach the growth levels experienced in 2013, they will grow as Chinese farmers take little interest in government-supported production expansion and strong profits, and the market opening for Australian chilled fresh beef products. Chinese market opening to Brazilian beef may happen imminently.

"Prospects for the global beef industry remains positive in Q2, with further possible upside due to continuing pressured beef supply and scarce supply of competing proteins which will continue to impact competitive positions," explained Rabobank analyst Albert Vernooij. "Brazilian cattle prices and exports have surged to record levels, and Australian droughts have encouraged historically high slaughter levels to meet global demand."

Regional Outlooks

U.S.: Volatility was the biggest factor impacting the U.S. cattle complex in Q1 2014. The impact on the hog market due to the rapid spread of PEDv will be the wildcard in the coming months. The shortage in hog slaughter could have a significant impact on total meat supplies, strengthening beef demand during the spring grilling season and into summer.

Australia: Poor climate conditions are keeping slaughter levels historically high, but strong international demand has supported record boxed beef exports in Q1. The latest seasonal outlook predicts a drier-than-normal period for Queensland and northern NSW and a continued high flow of cattle to markets is expected.

Brazil: Expected continued strong demand, both domestic and export, will result in firm cattle prices in Q2 2014 and likely beyond, even in periods of strong supply. Domestic demand is likely to increase on the back of the World Cup and presidential elections, while exports will be driven by the continued depreciation of the U.S. dollar.

New Zealand: Export prospects are positive with strong demand likely from the U.S. and China. However, the relatively high New Zealand dollar continues to put downward pressure on returns, eroding international competitiveness.

Canada: The long and extreme winter has been taxing, forcing increased feed usage. This escalation, in conjunction with cattle shipments to the U.S., means Canada is rapidly going through their available cattle supply with limited interest in herd expansion.

Argentina: Exports are expected to remain low as government limitations on export markets continue, with the aim of keeping domestic meat prices low.

China: Ongoing shortages in the domestic market will continue to support rising imports of frozen beef, with Australia remaining the biggest supplier accounting for 53% of total import volume in 2013.

Mexico: Mexico’s beef sector will continue operating under tight margins into Q2 2014 as beef and cattle prices remain high and lackluster consumption continues.

EU: With EU markets more or less in equilibrium, beef prices are expected to hold firm at their current levels. Supply of cattle will remain stable while import growth will continue its steady increase of about 10%.

See the original article >>

S&P's vicious sell-off

By Erik Tatje

E-mini S&P 500 (CME:ES14)

Following an early morning rally that produced new all-time highs in the S&P 500 on Friday, the market sold off viciously, giving back all of the weeks’ previous gains. Currently, prices are probing for support around the 1855.50 pivot on the chart. Despite the intermediate bias that still remains in play, near-term momentum in the S&P has reversed course and will remain bearish until price can gather itself again.

Look for the 1855.50 pivot to offer potential support to price, followed by 1842.00 and 1837.50. The RSI has reverted back to the 20 pivot, indicating that the S&P 500 may be in the process of transitioning lower. If this is the case, corrective rallies in this market could top out around the 60 reading on the RSI, highlighting the near-term bearish momentum in the marketplace. Traders should keep an eye on the 1823.25 level as well as the previously mentioned support pivots. A confirmed breakdown below the 1823.25 pivot would signal a new low in the S&P 500 and could alter the intermediate-term directional bias in the U.S. Dollar Index.

E-mini S&P 500, 30-minute Bar Chart (e-Signal)

U.S Dollar Index (NYBOT:DXH14)

The USD closed out last week on a strong note and looks to capitalize on the positive momentum heading into this week’s trading. Price recently rejected from the previous peak on 2/27 around the 80.70 pivot on the chart. However, the recent rejection doesn’t seem to have threatened the underlying bullish sentiment as the higher low, higher high structure remains unchanged. Traders should monitor the area around 80.416 as this could provide significant support to price and potentially offer bullish traders a valid entry level. Any sustained weakness below this area on the chart could dip as far as 80.123 – 80.160 before finding additional support on the chart. The directional bias in the U.S. Dollar Index will likely remain positive so long as price can avoid falling below 80.055 and the probabilities appear to favor the long side of this market.


U.S. Dollar Index, 30-minute Bar Chart (e-Signal)

Gold (COMEX:GCK14)

With stocks pulling back sharply into the close on Friday, gold received a temporary pause from the selling pressure which has governed price action over the past month. At this point, there is no reason to believe that the recent strength in gold is anything more than a corrective rally; however, if prices can hold above the 1300.0 pivot on the chart, there could still be some additional upside potential in the gold. In the event that gold continues higher, traders should key in on the 1315 – 1317 Fibonacci Confluence Zone as this area will likely provide significant resistance to any strength in price. Until price can produce a relatively higher high above the previously mentioned area on the chart, the directional bias in the Gold will continue to favor the bear campaign.

Gold 30-minute, Bar Chart (e-Signal)

See the original article >>

Risk premium vs. growth

By Phil Flynn

As the stock market failed on Friday after a spike after the jobs report, oil(NYMEX:CLM14) went higher. The reason was clear. No one wanted to be short over the weekend with rising political and rightly so. Today we see oil pulling back adjusting to the falling stock market because even though we had some disturbing geo-political events over the weekend, traders can act to hedge themselves more quickly in the event there is a major headline and there were a multitude of headlines that could impact oil prices going forward. Not to mention wheat prices.

Russian backed protests in eastern Ukraine and the death of one Ukrainian soldier is raising fears that Vladimir Putin will again be on the move. The protestors are calling for canceling the presidential election in favor of a referendum on becoming part of Russia.

We also are seeing increased tension between Japan and North Korea. The National Post reported that U.S. Defense Secretary Chuck Hagel delivered a two-pronged warning to Asia Pacific nations Sunday, announcing that the U.S. will send two additional ballistic missile destroyers to Japan to counter the North Korean threat, and saying China must better respect its neighbors.

Reuter’s news is reporting that the navies of Iran and Pakistan plan to hold joint military exercises in the eastern part of the Strait of Hormuz on Tuesday, Iran's state news agency said on Sunday. Several Pakistani naval vessels, including a warship and a submarine, docked at the Iranian port of Bandar Abbas on Saturday, the IRNA news agency said, citing an Iranian Navy statement. Iran's state news agency said the joint naval exercises were aimed at promoting military cooperation between Tehran and Islamabad but gave no details of the plans.

Yet with all these worries oil is down mainly because risks were priced in on Friday and so far there has been no disruption to supply fears that Russia would turn off the spigot at least until this point has not happened.

RBOB(NYMEX:RBM14) prices seem to be gaining on the Ultra-Low sulfur diesel. The USA Today reports that gasoline prices are making their annual spring climb. The average U.S. price of a gallon of gasoline has risen 5¢ the past two weeks. The Lundberg Survey of fuel prices released Sunday says the price of a gallon of regular is $3.61, the highest price in Lundberg's twice-monthly surveys since late July 2013.  The price is 4¢ below its year-ago point but 44¢ higher than 2013's low.

Californians saw some especially painful spikes this weekend. Drivers there are averaging $4.04 a gallon after a 35¢ jump in wholesale prices since mid-March -- prices could hit up to $4.25 within days. Tarnishing pump prices in the Golden State: lower supplies and rising crude costs. Not to mention Ethanol, blended into gasoline, is also up nearly 60% year-to-date on higher corn and rail shipping costs.

Natural gas(NYMEX:NGK14) prices are consolidating. While short term thinkers point to moderation temperatures big picture this market is a price spike waiting to happen. The natural gas market needs record production when many producers say they are cutting back. Rig counts are falling not rising. Prices will have to rise to get producers moving. Buy calls!

Gold(COMEX:GCM14) and silver(COMEX:SIM14) prices also have been riding the geopolitical risk roller coaster as well as trying to time the Federal Reserve. On Friday the government showed that U.S. nonfarm payrolls increased by 192,000 jobs last month, slightly below economists' estimate and well as the whisper number and in a zone where it was not strong enough to worry about raising rates or a slowdown in tapering.  So gold rode the risk trade rising mainly on fear. Gold Core reported that “Gold surged 1.3% on Friday - its biggest percentage increase since March 12. Gold is not far from a one-week high of $1,306.50 hit in the previous session. Gold Core said that Iraq's central bank said on Friday its gold reserves had reached 90 tons, after buying 60 ton over the past two months to support the Iraqi dinar.  They point out that Federal Reserve Chair Janet Yellen said last week that slack in labor markets showed accommodative policies will still be needed for some time which is also bullish for gold.

Gold Core also said, “UK government now has powers to raid bank accounts and confiscate deposits. On Saturday the Financial Times covered the story and the fact that the hitherto unnoticed measures are now facing scrutiny and a backlash. “George Osborne is facing a backlash over plans to give HM Revenue & Customs unprecedented powers to dip into taxpayers’ bank accounts to seize unpaid tax debts,” according to the FT. MPs, banks and charities want robust safeguards over powers that will allow the Revenue to order banks to pay outstanding debts from taxpayers’ bank accounts, following fears that the measure could be used inappropriately and cause hardship. Andrew Tyrin, who chairs the Treasury select committee, said the MPs intended to hold further hearings into the new powers, which he said could set a worrying precedent. Many banks want judicial oversight to apply to the new powers, as they worry about being caught between irate customers and the tax authorities. “HMRC doesn’t have the best record of getting things right,” a banking source told the FT.

The idea was previously floated in a 2007 consultation, but it was dropped after widespread criticism over the adequacy of the safeguards, the possibility of creating hardship and the risk of HMRC error.

Grain prices may move today export inspections as well as our first crop progress report. Soybean stockpiles have been tight so it will be interesting to see it the demand stays strong, Farmers are opting to plant less corn. Yet with winter hanging on iota will be interesting to see just how much planting will get done but more than likely it will be below the five-year average.

Weather in Brazil gave coffee(NYBOT:KCK14) a boost as dry weather is reducing the crop prospects again. Bloomberg reports that Coffee shipments from India, Asia's third-largest grower, are poised to fall this year as a rally in global prices deters buyers from Italy to Russia and after unseasonal rains cut output for the first time in six years. Exports may decline as much as 10% from 312,756 tons in 2013, said Ramesh Rajah, president of the Coffee Exporters Association of India. The harvest probably dropped below 300,000 tons in the 12 months started Oct. 1 from a record 318,200 tons a year earlier.

ETF Trends reports that the iPath Dow Jones-UBS Coffee Total Return Sub-Index ETN (NYSEArca: JO) jumped 7.3% Friday while the iPath Pure Beta Coffee ETN (NYSEArca: CAFÉ) surged 6.4%. Coffee has been the best performing asset year-to-date, with JO up 58.5% and CAFE up 53.9%.

See the original article >>

Gold & silver; Where is the Chinese demand?

By Andy Farida

Chinese Whispers on a potential strong demand from mainland China, but that demands remain elusive and countered with further selling. Technically, the yellow metal is oversold but with prices will remain weak if there is no spark of buying frenzy. It remains doubtful if there are any demands that could bump the price of gold higher. Shorting the yellow metal seems to be the better option as traders look into the next quarter with rising interest rate from central banks. Continued straining of monetary policy will play a key role in the demand to buy gold as an inflation hedge. However, concern remains on deflationary pressures that are building up in Europe. For all we know, the turbulent Japanese economy could play a nasty part to destabilise the global economy should Abenomics failed to raise that inflation rate.

Gold Technical Outlook, Weekly Chart

The next solid support on gold should it break $ 1,266 will be $ 1,244 area. Failure to hold that will indicate further selling and a return to $ 1,180. Unless it can break above the downtrend line, our current projection remains to the lower end of $ 1,100. The current price at $ 1,285 needs to build a few more layers of support and only a retest of $ 1,276 will give the bulls some confidence. Another retest at lower numbers, $ 1,277 or $ 1,266 may be the opportunity for bargain hunters to enter the market. Further buying at $ 1,295 will then allow the bulls to break higher to retest $ 1,330 area.

Resistance: $ 1,300, $ 1,329.50, $ 1,355 Support: $ 1,244, $ 1,266, $ 1,278

Traders Notes: Buy on support at $ 1,271 stop at $ 1,261 target $ 1,292

Short Term (1 – 3 weeks), Bearish $ 1,255; Medium Term (1 – 3 months), Bearish $ 1,200; Long Term (6- 12 months), Target $ 1,550.

Silver

Silver is building some solid support at $ 19.55 to $ 19.75 area. A sudden surge in demand could see prices rising higher and retest several key resistances. However, prices will remain capped in this downtrend line but we see higher prices in the next few weeks once the moving average crossed higher. Prices need to dictate this pace first as we have seen in many occasions.

Resistance: $ 20.09, $ 20.50, $ 21.48 Support: $ 19.50, $ 19.67, $ 19.77

Traders Notes: Should the price stabilise and found support at $ 19.50, buy with a stop loss of $ 0.30 to target the downtrend line at $ 21.40.

Short Term (1 – 3 weeks), Flat; Medium Term (1 – 3 months), Flat; Long Term (6 – 12 months), Bullish – a potential bull run?

Silver Technical Outlook, Weekly Chart

See the original article >>

The lost generation: what is true about the myth…

By Mark Esposito & Terence Tse

If we were to believe the forecasts from the European Commission, unemployment in the Eurozone appears to have started – at long last – showing signs of small but fragile recovery. However, that does not mean we can rest on our laurels as the economic outlook in the near term remains rather bleak. We can still expect a bumpy ride lying ahead through peaks and troughs, crashes and reboots. This ride is likely to be especially harsh for the growing army of jobless youths.

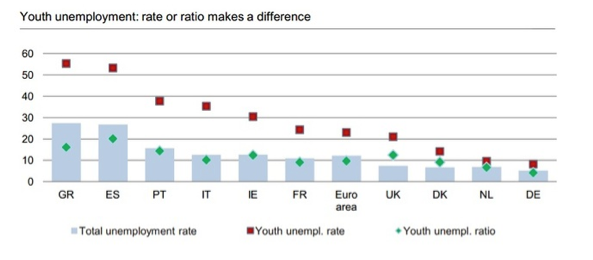
Unlike past economic crises, the burden left by the most recent one has not been shared proportionally among workers of different generations. Those aged between 15 and 24 are paying a high price, if not the highest in the aftermath of the crisis. The issue of youth unemployment used to only haunt weaker economies, such as those of southern Europe. For instance, both Greece and Spain have hit 50% in recent years. However, the current crisis has even brought the issue to those countries that are supposedly the richest and economically most robust: the US youth unemployment rate is some 16%, while in the UK and France, it is 20% and 25%, respectively. Even worse is that the youth unemployment issue has been deteriorating over time. While youth unemployment often refers to the number of those who are jobless, many of those who are lucky enough to be in employment are actually holding on to short-term and temporary contracts. Very often they have no choice because they have been locked out of the job market where permanent positions, occupied by the older generations, are protected by rigid labor market regulations.
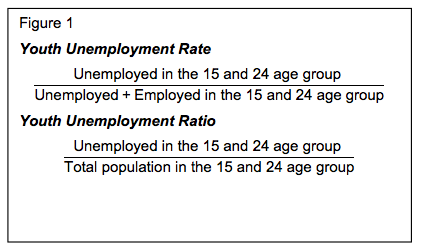
It is therefore not a surprise that some describe the youth as “a lost generation”.  At the same time, one should note that there are two ways to measure youth unemployment. First, the youth unemployment rate is simply the number of unemployed in the 15-24 age group divided by the total number of both the employed and the unemployed in the same age group (see figure 1). An important yet oft-neglected issue with this measurement is this: given that not every young person is in the labor market, the youth unemployment rate does not reflect the proportion of all young adults who are jobless. Those who are still in education, for instance, are therefore not included. In other words, a 25 % youth unemployment rate does not mean that “1 out of 4 young persons is unemployed” – it only means that 25% of those currently in the labor market is not employed. Yet, such interpretations of youth unemployment rates are frequently used as headlines, perhaps because they seem more newsworthy. Screen Shot 2014-04-07 at 15.45.54

It is in this context that some argue that the youth unemployment ratio is a better measure. This ratio refers to the number of unemployed in the age group of 15 and 24 divided by the total population in this age group. Hence, this takes into account those who are still at school. Using this measure, the numbers look far less alarming. If we were to compare youth unemployment rate and ratio (figure 2), we could notice that in some economies – especially those in southern Europe – the youth unemployment situation is difficult but not necessarily disastrous. This leads us to believe that if we were to make more and better use of the unemployment ratio and focus less on rate, we would probably avoid many of those stark and dispiriting comparisons between the north and south of Europe. This, in turn, may result in creating less of a political impasse over the idea of a two-speed recovery in Europe.

Screen Shot 2014-04-07 at 15.34.43

Source: Deutsche Bank/Eurostat

However, debating the merits of rate vs ratio may be beside the point. For instance, neither take into account those employed in the informal economy, which is estimated to be 10-30% of total EU GDP. Another element that is missed out is the fact that many youths are only employed in jobs that offer little or no prospects for career development.

What is also a very real problem is that if young people are the source of innovation, and that innovation is the basis of lifting a country’s competitiveness, the employment situation of younger generations may well be undermining our own economic strength. Indeed, it is highly probable that the lack of opportunities for young people to excel and put their talent to good use have led to the long-observed gradual deterioration of competitiveness in the Eurozone. In short, youth unemployment is not just about more and more young people experiencing socio-economic deprivation, it is also about the dropping standard of living for all of us.

Some may argue that the older generations may be able to drive innovation. However, we think this is unlikely to be the case.  While young people struggle to break into the job market, senior workers often struggle to re-join the workforce. Those in the middle, by contrast, are the most privileged and advantaged. They are more likely to have jobs in general and hold most of the wealth in the economy. This makes it easy to forget that they also bear most of the burden for funding social welfare. Compounded by weak economies, they may become more reluctant to take new entrepreneurial risk. This, in turn, effectively lowers our chances of producing innovations. Stifled labor mobility would thus indirectly hurt our ability to innovate.

At the same time, the vastly different benefits in terms of income stability, mobility and pay enjoyed by the different generations is likely to increase demands on welfare systems, while producing greater social exclusion and less harmony within the society.

What lies ahead

The need for action is clear. Continuing down the current road would only make us all worse off; making our economies vulnerable to any unexpected external shock. The challenge is complex and requires efforts on several fronts. First, we believe that it is paramount to integrate those who have been economically marginalized to achieve long-term economic benefits and sustained competitiveness. It is paramount for governments and businesses to make better use of the talent of young people. This in turn should allow more innovation to emerge, which creates economic benefits and increases competitiveness.

European institutions need to coordinate efforts to come up with a realistic set Europe wide measures. Surely, Europe has been doing this, as this is the raison d’être of the EU. The problem is that, more often than not, EU-wide policies end up either adding red tape or being inconsistent with national regulations.

National governments need to deal with the youth unemployment issue proactively rather than coming up with half-hearted measures that are more designed to win votes than to produce demonstrable change. Just because most votes come from older generations with jobs does not mean that we can neglect the need of the disenchanted youth, many of whom have lost faith in their governments and societies. The best starting points would be to rethink existing labor market policies and contractual terms.

Individual citizens and communities need to accept that other forms of education are equally useful. We can no longer pretend that university degrees are the only means to employment. It is important to recognize the importance of – as well as the pragmatic nature of vocational education.

A great deal of thinking, efforts, courage and money would be needed to accomplish such changes. However, if done well, this represents an opportunity to redesign our economies and societies for the better.

See the original article >>

CEO Of Liechtenstein Bank Frick Murdered

by Tyler Durden

Over the weekend the world was gripped by the drama surrounding the mysterious murder-homicide of the former CEO of Dutch bank ABN Amro and members of his family, and whether there is more foul play than meets the eye. However, that is nothing compared to what just happened in the tiny, and all too quiet Principality of Lichtenstein, where moments ago the CEO of local financial institution Bank Frick & Co. AG, Juergen Frick, was shot dead in the underground garage of the bank located in the city of Balzers.


Based on preliminary reports, the murder is the result of a disgruntled fund manager, Juergen Germann, who had previously been embroiled in a "bitter dispute" with the government and the bank. Bloomberg has more:

A 48-year-old man was shot dead in the underground garage of a financial institution in Balzers at 7:30 a.m. local time, the principality’s police said on its website. The suspect, Juergen Hermann, fled the scene in a Smart car with Liechtenstein number plates, according to police. Neither the victim nor the institution were identified in the statement.

The deceased was Juergen Frick, CEO of Bank Frick & Co. AG, Switzerland’s Radio 1 said in an e-mailed statement, citing employees of the bank. Calls to Bank Frick were answered by a voice-mail message saying the company is closed because of “a death.” It gave no further details.

Hermann is a fund manager who has been embroiled in a dispute with the Liechtenstein government and Bank Frick for many years, Switzerland’s Radio 1 said.

The Liechtenstein government and the country’s Financial Market Authority “illegally destroyed my investment company Hermann Finance and its funds, depriving me of my livelihood,” according to a website registered under the name Juergen Hermann of Hermann Finance AG.

He has filed lawsuits seeking recovery of 200 million Swiss francs ($225 million) from the government and 33 million francs from Bank Frick, according to the website. The lender “illegally enriched itself,” among other alleged crimes, it said.

A representative of Hermann’s lawyer declined to comment when reached by telephone. A call to Hermann Finance’s office was answered by an employee of a law firm who said his company isn’t related to Hermann Finance.

The narrative against the "publicly hostile" alleged shooter has already been flushed out.

Hermann has been “publicly hostile” to the country’s Financial Market Authority and some of its employees, forcing it to take security measures in consultation with the police, FMA spokesman Beat Krieger said in an e-mail today.

The escape vehicle was later found in the village of Ruggell, 25 kilometers (16 miles) north of Balzers, police said.

“The area is being searched by police with dogs and helicopters,” the 120-member police force said. Zurich police are helping to document the crime scene, spokesman Mario Cortesi said.

Here is the update form the local police station:

On Monday morning, it came in Balzers a homicide, the suspect is currently volatile.

Against 07.30 clock in an underground garage of a financial institution is a homicide in which a 48-year-old man was shot occurred. When volatile suspects are Jürgen Hermann from the Moors. He is armed and dangerous, according to police reports, the investigation of the National Police is in full swing.

Notes on a possible whereabouts of the suspects are requested immediately to the police landing +423 / 236 71 11. Upon encountering the suspect, it is important to exercise extreme caution.

Below is the profile of the murdered CEO, still on the bank's website:

As CEO Jürgen Frick is closely involved in all business activities of the bank with a special focus lying on client advisory, financing and financial product development. As well he supervises all real estate development projects of the Bank.

Jürgen is also Chairman of the Board at Crystal Fund Management AG, a subsidiary of Bank Frick & Co.

As for the bank itself:

Bank Frick is active in modern wealth management and provides a range of advisory services. As well it specializes in fund development and fund administration.

Our Bank entertains close ties to an efficient network of fiduciaries, insurers, tax experts, investment funds and law firms around the world.

We are completely independent. Our advice and our services cater exclusively to the individual needs and requirements of our clients.

Combinvest Establishment serves as holding for all bank shares. Family Frick is the majority stake holder.

After a successful career in international banking and fiduciary services, Kuno Frick senior founded in December 1998 Bank Frick & Co. AG. Due to his wide experience and excellent connections, Bank Frick proved an immediate success.

Since then, the bank’s assets under management have risen steadily. New business segments are continuously being added to the bank’s service portfolio, while existing ones are constantly being refined.

In autumn 2011, Bank Frick’s international presence was significantly enhanced with the opening of Bank Frick UK Branch in Mayfair, London.

Up until now it was mostly banker suicides. With the first open bank CEO murder, one wonders if there will be a change in the pattern.

See the original article >>

Investors Will Escape from this! Which direction???

by Chris Kimble

CLICK ON CHART TO ENLARGE

This 5-pack of chart focuses on key U.S. stock index's and how each of them are facing key long-term lines at the exact same time and a couple of them are facing Fibonacci extension levels too. If one breaks out will all breakout? If one breaks down will others break down too?

In time, investors "will escape" from these line...which direction is the key!

CLICK ON CHART TO ENLARGE

I shared the above chart one month ago today, reflecting that the Dow was facing some long-term lines with average valuations 66% above long-term averages. Since this chart was produced Bio Tech & Social media darlings have had a rough 30 days, with many of them off 20% and more!

From a Power of the Pattern perspective, IMHO, when technical analysis and valuations line up in rare form, it increases the potential we are near important emotional price points  in the market.

The markets will "Escape" from these price points and valuations, you get to pick the direction...Break Out or Break Down???

See the original article >>

Are We Heading For Another 1987-Style Crash?

by The Phoenix

The big story developing in the US markets regards the sudden crackdown by regulators, most notably the SEC and Justice Department, on High Frequency Trading or HFT.

For well over five years now, certain trading firms have been using high-speed computers to front-run orders from other investors.

In simple terms, the market exchanges, like the NYSE, would let these firms (for a price of course) see when someone put in a market order to buy or sell shares on the market.

The trading firm would then use super fast computer programs to buy or sell shares in front of that order, before turning around and selling the shares to the investor at a slightly higher price. The trading program may only make a $0.01 profit by doing this, but because they were doing it millions of times a day, they were making billions of Dollars per year.

At one point, this practice accounted for as much as 70% of all market volume. Put another way, 70% of all shares being traded on the market were not from investors actually placing buy and sell orders, but from computers front-running investors and each other.

These firms argued that they were providing liquidity to the markets (an outright lie). The reality is that they spent millions of dollars lobbying in Washington DC to make sure that the regulators didn’t crack down on them.

However, it would appear that things have finally hit a boiling point with author Michael Lewis publishing a book exposing HFT as the immoral and illegal activity it is.

Between this, and a number of high profile media appearances, Lewis has finally raised public awareness on the issue of HFT. And the public is not happy about it As a result both the SEC and Justice Department have opened investigations.

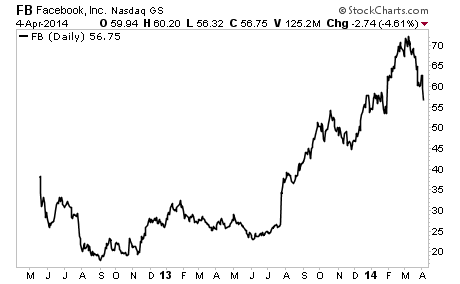
As far as stocks are concerned, we’ve seen a sharp drop in the companies that were highly favored by HFT firms.

Amazon, an HFT favorite, has imploded from its highs.

The same goes for Facebook:

This was always the problem with HFT: that these firms were pushing prices higher, through artificial pressure, not real buying power. Now that they’re moving out of the market, we’re seeing the consequences of this.

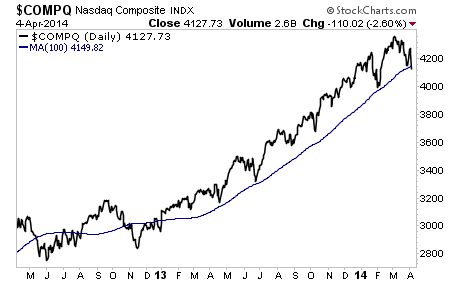
Indeed, the sharp drop in those companies favored by HFT firms predicted the recent collapse in the NASDAQ index as a whole:

Today, the NASDAQ is resting on its 100-day moving average. As you can see in the above chart, this line has help during every correction since 2013.

IF we see a breakdown here (meaning this line doesn’t hold), then the HFT crackdown could become a very serious issue for the markets. With these programs dominating trading so much, removing them from the market will have serious consequences for prices.

The whole situation is very reminiscent of the computer trading, which led to the 1987 Crash.

See the original article >>

Chinese Gold Demand Renewed Estimates

By: Alasdair_Macleod

Geopolitical and market background
I have been revisiting estimates of the quantities of gold being absorbed by China, and yet again I have had to revise them upwards. Analysis of the detail discovered in historic information in the context of China’s gold strategy has allowed me for the first time to make reasonable estimates of vaulted gold, comprised of gold accounts at commercial banks, mine output and scrap. There is also compelling evidence mine output and scrap are being accumulated by the government in its own vaults, and not being delivered to satisfy public demand.

The impact of these revelations on estimates of total identified demand and the drain on bullion stocks from outside China is likely to be dramatic, but confirms what some of us have suspected but been unable to prove. Western analysts have always lagged in their understanding of Chinese demand and there is now evidence China is deliberately concealing the scale of it from us. Instead, China is happy to let us accept the lower estimates of western analysts, which by identifying gold demand from the retail end of the supply chain give significantly lower figures.
Before 2012 the Shanghai Gold Exchange was keen to advertise its ambitions to become a major gold trading hub. This is no longer the case.  The last SGE Annual Report in English was for 2010, and the last Gold Market Report was for 2011. 2013 was a watershed year. Following the Cyprus debacle, western central banks, seemingly unaware of latent Chinese demand embarked on a policy of supplying large quantities of bullion to break the bull market and suppress the price. The resulting expansion in both global and Chinese demand was so rapid that analysts in western capital markets have been caught unawares.
I started following China’s gold strategy over two years ago and was more or less on my own, having been tipped off by a contact that the Chinese government had already accumulated large amounts of gold before actively promoting gold ownership for private individuals. I took the view that the Chinese government acted for good reasons and that it is a mistake to ignore their actions, particularly when gold is involved.
Since then, Koos Jansen of ingoldwetrust.ch has taken a specialised interest in the SGE and Hong Kong’s trade statistics, and his dedication to the issue has helped spread interest and knowledge in the subject. He has been particularly successful in broadcasting market statistics published in Chinese to a western audience, overcoming the lack of information available in English.  I believe that China is well on the way to having gained control of the international gold market, thanks to western central banks suppression of the gold price, which accelerated last year. The basic reasons behind China’s policy are entirely logical:

·       China knew at the outset that gold is the west’s weak spot, with actual monetary reserves massively overstated. For all I know their intelligence services may have had an accurate assessment of how much gold there is left in western vaults, and if they had not, their allies, the Russians, probably did. Representatives of the People’s Bank of China will have attended meetings at the Bank for International Settlements where these issues are presumably openly discussed by central bankers.

·       China has significant currency surpluses under US control. By controlling the gold market China can flip value from US Treasuries into gold as and when it wishes. This gives China ultimate financial leverage over the west if required.

·       By encouraging its population to invest in gold China reduces the need to acquire dollars to control the renminbi/dollar rate. Put another way, gold purchases by the public have helped absorb her trade surplus. Furthermore gold ownership insulates her middle classes from external currency instability which has become an increasing concern since the Lehman crisis.
For its geopolitical strategy to work China must accumulate large quantities of bullion. To this end China has encouraged mine production, making the country the largest producer in the world. It must also have control over the global market for physical gold, and by rapidly developing the SGE and its sister the Shanghai Gold Futures Exchange the groundwork has been completed. If western markets, starved of physical metal, are forced at a future date to declare force majeure when settlements fail, the SGE and SGFE will be in a position to become the world’s market for gold. Interestingly, Arab holders have recently been recasting some of their old gold holdings from the LBMA’s 400 ounce 995 standard into the Chinese one kilo 9999 standard, which insures them against this potential risk.
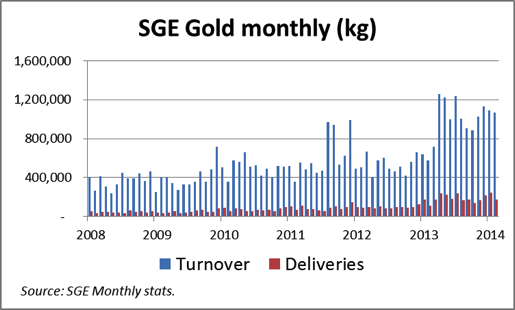
China appears in a few years to have achieved dominance of the physical gold market. Since January 2008 turnover on the SGE has increased from a quarterly average of 362 tonnes per month to 1,100 tonnes, and deliveries from 44 tonnes per month to 212 tonnes. It is noticeable how activity increased rapidly from April 2013, in the wake of the dramatic fall in the gold price. From January 2008, the SGE has delivered from its vaults into public hands a total of 6,776 tonnes. This is illustrated in the chart below.  

This is only part of the story, the part that is in the public domain. In addition there is gold imported through Hong Kong and fabricated for the Chinese retail market bypassing the SGE, changes of stock levels within the SGE’s network of vaults, the destination of domestic mine output and scrap,  government purchases of gold in London and elsewhere, and purchases stored abroad by the wealthy. Furthermore the Chinese diaspora throughout South East Asia competes with China for global gold stocks, and its demand is in addition to that of China’s Mainland and Hong Kong.    
The Shanghai Gold Exchange (SGE)
The SGE, which is the government-owned and controlled gold exchange monopoly, runs a vaulting system with which westerners will be familiar. Gold in the vaults is fungible, but when it leaves the SGE’s vaults it is no longer so, and in order to re-enter them it is treated as scrap and recast. In 2011 there were 49 vaults in the SGE’s system, and bars and ingots are supplied to SGE specifications by a number of foreign and Chinese refiners. Besides commercial banks, SGE members include refiners, jewellery manufacturers, mines, and investment companies. The SGE’s 2010 Annual Report, the last published in English, states there were 25 commercial banks included in 163 members of the exchange, 6,751 institutional clients accounting for 81% of gold traded, and 1,778,500 clients of the commercial banks with gold accounts. The 2011 Gold Report, the most recent available, stated that the number of commercial bank members had increased to 29 with 2,353,600 clients, and given the rapid expansion of demand since, the number of gold account holders is likely to be considerably greater today.
About 75% of the SGE’s gold turnover is for forward settlement and the balance is for spot delivery. Standard bars are Au99.95 3 kilos (roughly 100 ounces), Au99.99 1 kilo, Au100g and Au50g. The institutional standard has become Au99.99 1 kilo bars, most of which are sourced from Swiss refiners, with the old Au99.95 standard less than 15% of turnover today compared with 65% five years ago. The smaller 100g and 50g bars are generally for retail demand and a very small proportion of the total traded. Public demand for smaller bars is satisfied mainly through branded products provided by commercial banks and other retail entities instead of from SGE-authorised refiners.
Overall volumes on the SGE are a tiny fraction of those recorded in London, and the market is relatively illiquid, so much so that opportunities for price arbitrage are often apparent rather than real. The obvious difference between the two markets is the large amounts of gold delivered to China’s public. This has fuelled the rapid growth of the Chinese market leading to a parallel increase in vaulted bullion stocks, which for 2013 is likely to have been substantial.
By way of contrast the LBMA is not a regulated market but is overseen by the Bank of England, while the SGE is both controlled and regulated by the People’s Bank of China. The PBOC is also a member of both its own exchange and of the LBMA, and deals actively in non-monetary gold. While the LBMA is at arm’s length from the BoE, the SGE is effectively a department of the PBOC. This allows the Chinese government to control the gold market for its own strategic objectives.
Quantifying demand
Identifiable demand is the sum of deliveries to the public withdrawn from SGE vaults, plus the residual gold left in Hong Kong, being the net balance between imports and exports. To this total must be added an estimate of changes in vaulted bullion stocks.  
SGE gold deliveries
Gold deliveries from SGE vaults to the general public are listed both weekly and monthly in Chinese. The following chart shows how they have grown on a monthly basis.   

See the original article >>

Follow Us