Monday, December 9, 2013

Buy Low And Sell High? Our Super Commodity System Do This For You

The system allows to take position on the market well in advance of traditional methods and greatly benefit the investor in the subsequent management of the open positions. Super Commodity works with simple and effective rules and with fixed and not optimized parameters.

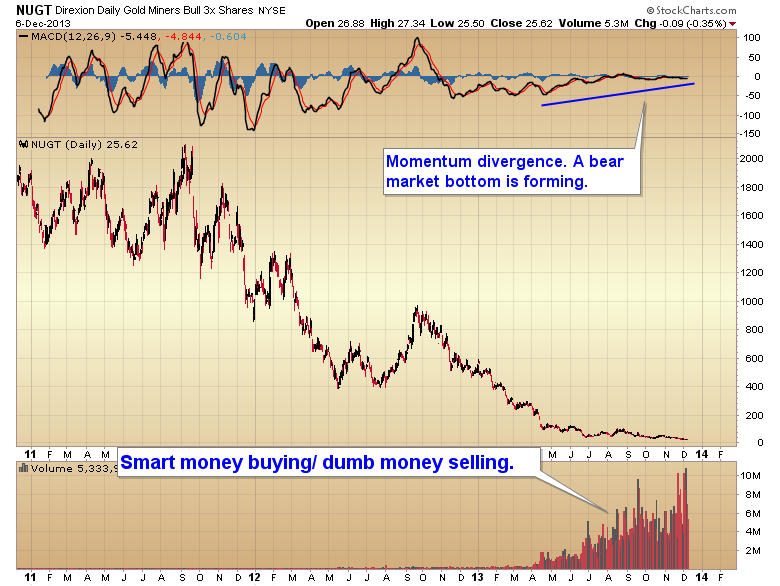
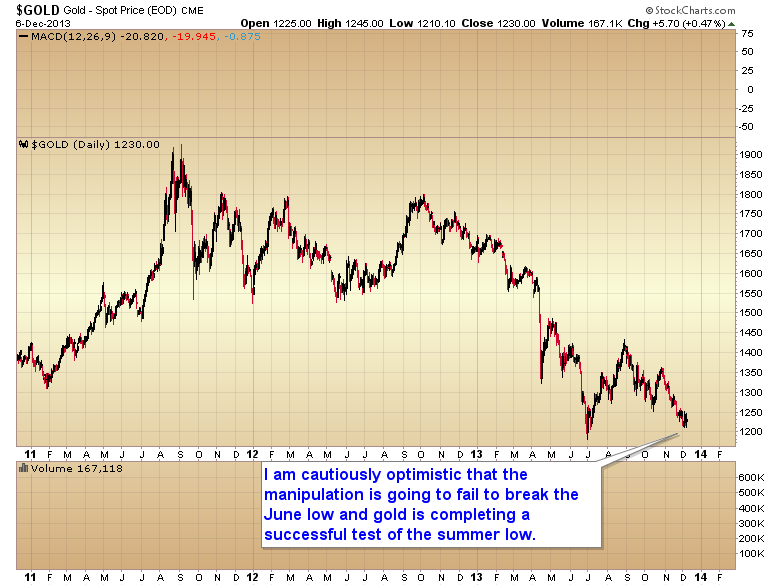
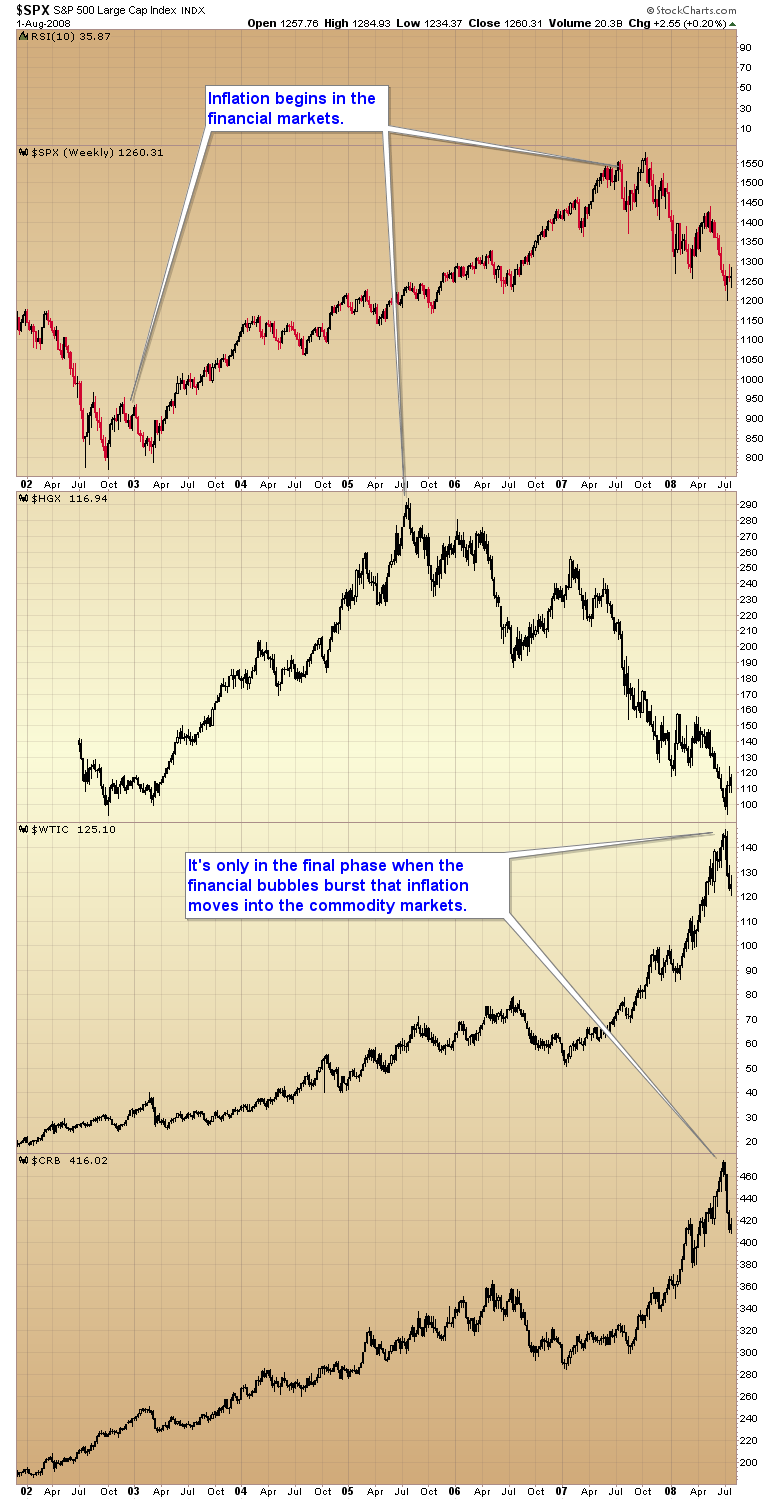
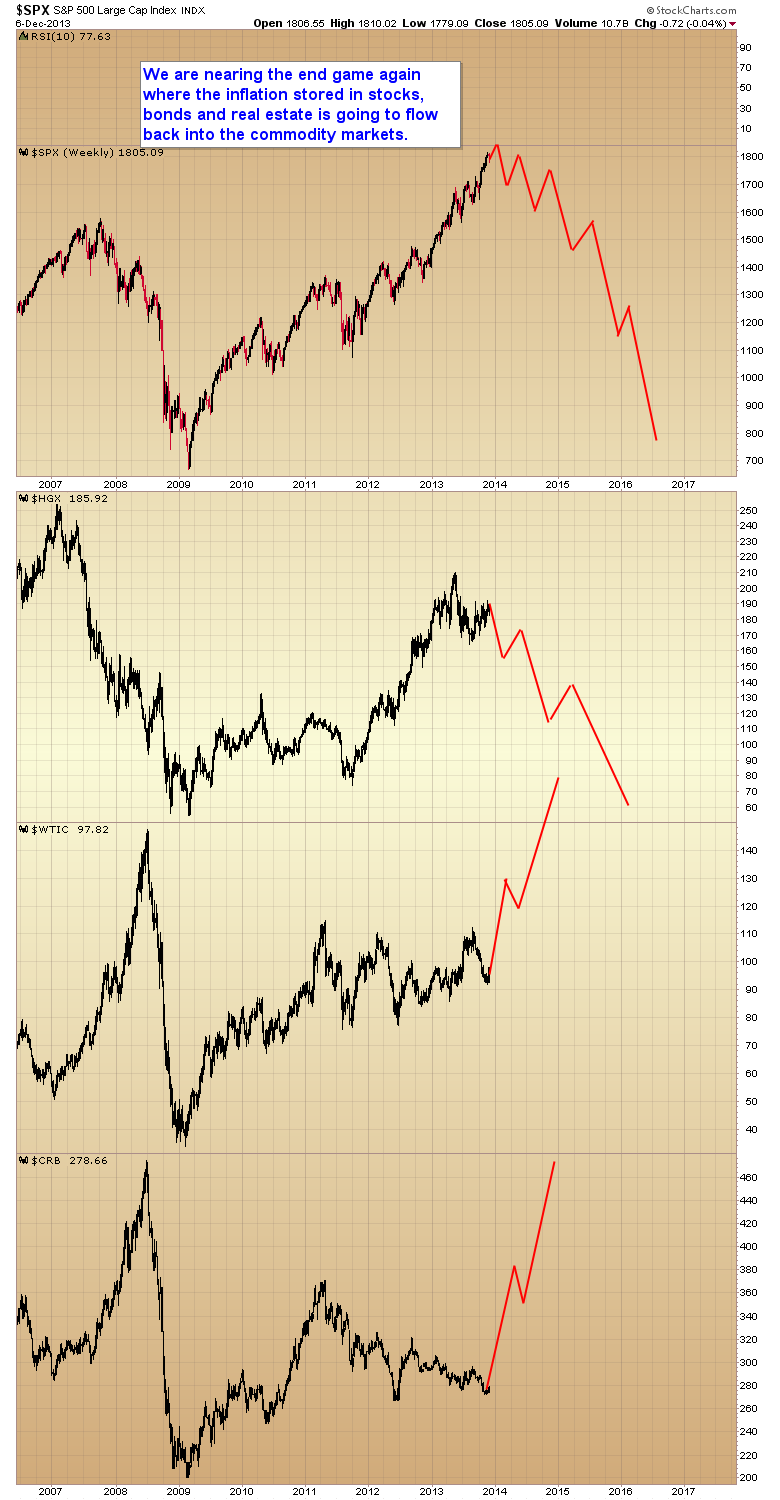
Test and evaluate for free our Super Commodity system


Top 10 rules of portfolio diversification
If there is one thing the 2008 financial meltdown taught us, it is the value of a properly diversified portfolio. The second thing is that if you think you are diversified, you may need to check again. At the time, many thought they were, only to see losses across the board as assets that previously were uncorrelated moved together and sunk many a portfolio.
Today, figuring out what constitutes a diversified portfolio and, more importantly, how to actually assemble one can be a difficult and at times frustrating ordeal; every analyst and investment advisor has a different idea. To help you navigate these treacherous waters, we offer the following 10 rules of portfolio diversification.

1. Start with the end in mind. A diversified portfolio is not a one-size-fits-all product. Instead, it should be personalized, focusing on your personal long-term investment goals while considering your current personal circumstances. According to Michael Loewengart, senior investment strategist at E*TRADE Capital Management, your personal circumstances should take into account your current financial situation, expected future expenses and how far away from retirement you are. "The goal of asset allocation is to make sure the level of volatility in your portfolio is in line with your goals, personal circumstances and tolerance for risk," he says. Additionally, consider your temperament. If high-risk assets make you overly stressed, perhaps it would be better to stick with comparably low-risk alternatives.
2. Aim to reduce overall risk. Portfolio diversification has two goals, this being the first and what most people associate with diversification. If you have multiple assets in your portfolio, even if one is not doing well, you have others that are outperforming. As such, this reduces the overall volatility of the portfolio. "[Diversification] reduces your risk. Instead of being stuck in just one sector that may not do well at times, a diversified portfolio can sustain you and keep you in business," Michael Clarke, CEO of Clarke Capital Management, says.
3. Aim to enhance overall returns. Being able to capitalize in markets that are outperforming and adding to your bottom-line is the second goal of a diverse portfolio. Not only does owning a range of assets protect you in the event that one does poorly, but it positions you to take advantage of ones that perform exemplarily. "We try to have a finger in each of the different sectors because in our experience usually something is working and that one may save the bill," says Clarke.

4. Invest in multiple asset classes. Traditionally, a portfolio was considered diverse if it had a mixture of equities and bonds. As investors are becoming more sophisticated, other assets such as commodities, real estate and foreign currencies are receiving more attention. In order to reduce risk and enhance returns, investments in numerous asset classes help keep correlations among assets in check. Each class has its own drivers and its own speed bumps. Taken together, they help smooth out the ride.

5. Invest in multiple sectors within the asset classes. Just as investing in multiple asset classes reduces risk and enhances returns, so too does investing in multiple sectors within those asset classes. Just including equities, bonds and commodities is not enough as equities have sectors reaching from healthcare to industrial metals, bonds have a variety of maturations and commodities include energies, metals and foods. "You want to be allocated amongst the various market sectors and industries. Across asset classes, you want to have further diversification into the different segments," Loewengart says.

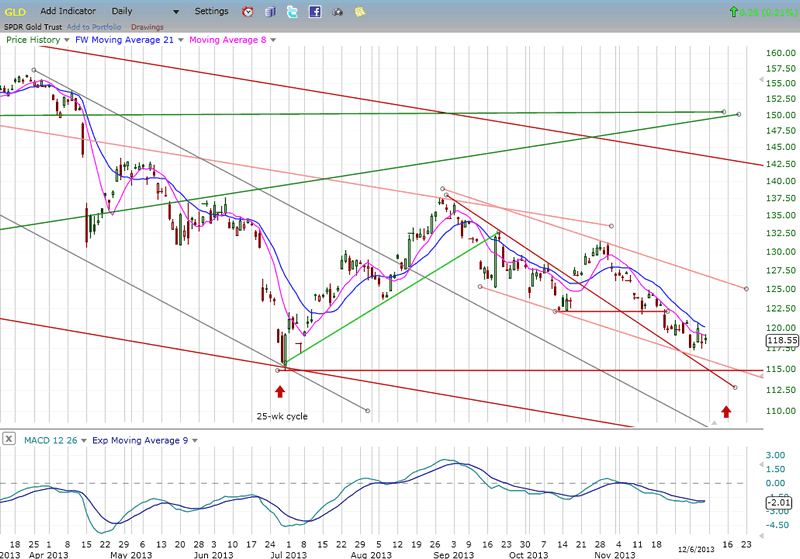
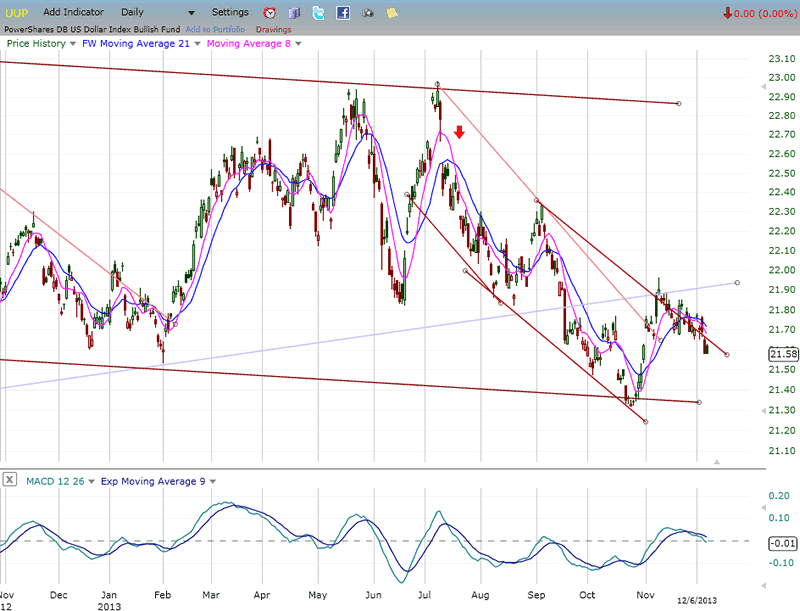
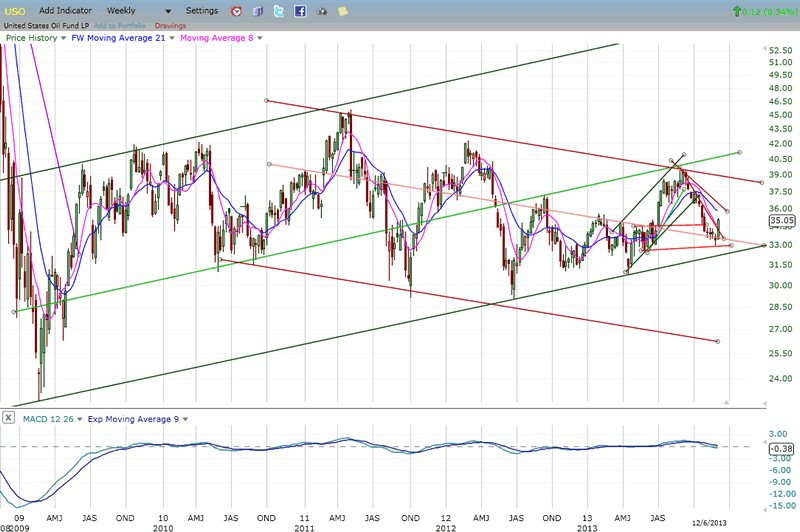
6. Own assets that do well in bull, bear and sideways markets. This point really stresses the need for owning a diverse array of assets. You do not want to place all your eggs in a basket that does well when the stock market is moving up, because that also means your portfolio will do very poorly when that bull market turns into a bear. Instead, it usually is advisable to own assets with a negative correlation in which one asset moves higher while the other moves lower. Examples of this relationship include the U.S. dollar and crude oil as well as stocks and bonds. It is often true that in times of crisis all correlations go to 1.0, but some strategies are more resistant to this. It is wise to look broadly at how various assets perform in different environments.
Commodity Trading Advisor Salem Abraham pointed out following 2008 that nearly all asset classes were long the economy. Managed futures, which are diversified in their own right through being long or short disparate sectors like agriculture, metals, energies, interest rates and currencies, also perform well in periods of high dislocation. Other diversified asset classes had the same negative response to the economic crisis but managed futures did well by taking advantage of fat tail events rather than being punished by them.
7. Have a disciplined plan for portfolio rebalancing. If you have constructed your portfolio properly, it is to be expected that some assets will outperform others and over time begin constituting a larger percentage of your portfolio. That is the time to rebalance and bring your investments back in check with one another. "If you have a disciplined plan for rebalancing in place, then you can capitalize on the different movements that will take place from the different assets in your portfolio," Loewengart says.
He explains that that discipline will enable you to automatically sell out of your outperforming assets and buy into those underperforming. Consequently, you will naturally be selling high and buying low.

8. No "borrowing" among classes except during rebalancing. Trading can become emotional and that can cloud your judgment. It may seem like a good idea to abandon an investment decision that is not immediately paying off or to bolster ones that are doing well. Proceed with caution, because that is a move that catches many investors. The reason for having a rebalancing plan is to remove that emotional element. "When you look at your portfolio, rebalancing with a stated framework is going to give you the discipline that many investors inherently lack," Loewengart says. That discipline helps you do the things that you may not want to do, but are in your best interest.

9. Backtest your portfolio, but consider current market conditions. Backtesting can help you see correlations that exist in your portfolio and can allow you to see how it would stack up in various market conditions. There is a reason, though, that investment advisors are required to say, "Past performance is not indicative of future results." Also, remember there will be periods in the past in which your portfolio would not have fared well.
Past events can provide a framework, but also consider current market conditions to better position your portfolio for future events. We can learn a lot from the past, but current events are shaping
tomorrow’s markets.

10. Test asset correlations periodically. If there is one thing we can count on in the markets, it’s that they will never stay exactly the same. What was negatively correlated one year can move lock-step the next. Consequently, it is not enough to simply rebalance from time to time; you also need to test the asset correlations in your portfolio periodically to see if anything has changed. As markets change, you need to make informed decisions as to how you need to alter your portfolio to counter those changes. You can’t expect your portfolio allocation decisions to be a one-and-done event; as markets change, so to must your portfolio.

These rules leave a lot to personal judgment and that is the key to success. One additional item to point out is that any allocation to a less liquid asset should calculate that liquidity risk in addition to other risks to achieve the proper allocation.
Your portfolio should fit your needs. Unfortunately in the past not all potential asset classes were available to retail investors. Today, thanks to innovative exchange-traded funds (ETFs) and mutual fund structures, nearly every investor can access commodities, currencies, short and leveraged strategies as well as active strategies including managed futures. Now everyone truly can be diversified.

Should You Still Use Commodity to Diversify Investment Portfolio?
A new study from the Bank of International Settlements (BIS) raises doubts about the value of commodities as a tool for enhancing portfolio diversification. The paper’s smoking gun, so to speak, is that “the correlation between commodity and equity returns has substantially increased after the onset of the recent financial crisis.” Some pundits interpret the study as a rationale for avoiding commodities entirely for asset allocation purposes. But that’s too extreme.
In fact, this BIS paper, although worth a careful read, isn’t telling us anything new. That said, it’s a useful reminder for what should have been obvious all along, namely: there are no silver bullets that will lead you, in one fell swoop, to the promised land of portfolio design. The idea that adding commodities (or any other asset class or trading strategy) to an existing portfolio will somehow transform it into a marvel of financial design is doomed to failure. Progress in the art/science of asset allocation arrives incrementally, if at all, once you move beyond the easy and obvious decision to hold a broad mix of the major asset classes.
Correlations are a key factor in the design and management of asset allocation, but they’re not the only factor. And even if we can find assets and strategies with reliably low/negative correlations with, say, equities, that alone isn’t enough, as I discussed last week. You also need to consider other factors, starting with expected return. It may be tempting to focus on one pair of assets and consider how the trailing correlation stacks up today. But that’s hardly the last word on making intelligent decisions on how to build a diversified portfolio.
Perhaps the first rule is to be realistic, which means recognizing that expected correlations, returns and volatility are in constant flux—and not necessarily in our favor, at least not all of the time. Bill Bernstein’s recent e-book (Skating Where the Puck Was: The Correlation Game in a Flat World), which I briefly reviewed a few months ago, warns that the increasing globalization of markets makes it ever more difficult to earn a risk premium at a given level of risk. As “new” asset classes and strategies become popular and accessible, the risk-return profile that looks so attractive on a trailing basis will likely become less so in the future, Bernstein explains. That’s old news, but it’s forever relevant.
As more investors pile into commodities, REITs, hedge funds, and other formerly obscure corners, the historical diversification benefits will likely fade. Granted, the outlook for expected diversification benefits fluctuates through time, and so what looks unattractive today may look considerably more compelling tomorrow (and vice versa). But as a general proposition, it’s reasonable to assume that correlations generally will inch closer to 1.0. That doesn’t mean that diversifying across asset classes is destined to become worthless, but the expected payoff is likely to dim with the passage of time.
The good news is that this future isn't a total loss because holding a broad set of asset classes is only half the battle. Your investment results also rely heavily on how and when you rebalance the mix. Even in a world where correlations are higher and expected returns are lower, there’s going to be a lot of short-term variation on these fronts. In other words, price volatility will remain high, which opens the door (at least in theory) for earning a respectable risk premium.
Still, it’s wise to manage expectations along with assets. Consider how correlations have evolved. To be precise, consider how correlations of risk premia among asset classes compare on a rolling three-year basis over the last 10 years relative to the Global Market Index (GMI), an unmanaged market-weighted portfolio of all the major asset classes. As you can see in the chart below, correlations generally have increased. If you were only looking at this risk metric in isolation, in terms of history, you might ignore the asset classes that are near 1.0 readings, which is to say those with relatively high correlations vis-a-vis GMI. But by that reasoning, you’d ignore foreign stocks from a US-investor perspective, which is almost certainly a mistake as a strategic decision.

Nonetheless, diversifying into foreign equities looks less attractive today compared with, say, 2005. Maybe that inspires a lower allocation. Then again, if there’s a new round of volatility, the opportunity linked with diversifying into foreign markets may look stronger.
The expected advantages (and risk) with rebalancing, in other words, are constantly in flux. The lesson is that looking in the rear-view mirror at correlations, returns, volatility, etc., is only the beginning—not the end—of your analytical travels.
Sure, correlations generally are apt to be higher, which means that it’s going to be somewhat tougher to earn the same return at a comparable level of risk relative to the past. But that doesn’t mean we should abandon certain asset classes. It does mean that we’ll have to work harder to generate the same results.
That’s hardly a new development. In fact, it’s been true all along. As investing becomes increasingly competitive, and more asset classes and strategies become securitized, expected risk premia will likely slide. But what’s true across the sweep of time isn’t necessarily true in every shorter-run period. The combination of asset allocation and rebalancing is still a powerful mix—far more so than either one is by itself. And that’s not likely to change, even in a world of higher correlations.

Soft commodities 'better bet than grains' for 2014

by Agrimoney.com

Soft commodities look a better bet for gains than grains in 2014, with cocoa to hit three-year highs, Commerzbank said, forecasting a waning performance by livestock futures.

Among the main grains and oilseed contracts, only Chicago corn will managed headway next year, boosted by the prospect of a drop in US sowings next year, as weak prices prompt farmers to seek alternative crops.

"Assuming normal weather conditions, the relative availability of corn will probably decline compared with wheat in 2014-15, leading to a narrowing of the price difference between corn and wheat," the bank said.

"We also expect corn to recover in absolute terms, even if the high prices of 2011 and 2012 are likely to remain a long way off."

'Structurally driven deficits'

However, soft commodities, which have generally reported losses this year, will see price rises, especially cocoa, which in London will rise to £1,850 a tonne by the end of the year.

That would be the highest prices since September 2011, and is set to be followed by further gains in 2015, reflecting expectations voiced by the International Cocoa Organization of "structurally driven deficits".

Commerzbank also quoted a caution by Olam International, the agricultural commodities trader, that prices will "have to rise again strongly, despite the increases of recent months, in order to sustainably attract investment to the cocoa sectors of the key cocoa-producing countries".

The bank added: "Given market deficits and the need to invest in the cocoa sector to keep pace with rising demand in the mid-term, we believe cocoa prices will continue to rise."

'Scrimping on fertilizer'

Sugar prices will recover a little too, averaging 19.5 cents a pound in the last quarter of next year, given that they have already falling below production costs in many countries, implying a disincentive for output ahead.

And arabica coffee futures will recover to end the year at 110 cents a pound, reviving further in 2015 too, although only after hitting 100 cents a pound as an average for the April-to-June quarter.

"As a minimum, the current low price phase will lead to lower yields in the medium term due to scrimping on fertilizer and crop protection," the bank said.

The "more diminished outlook" for production from 2015-16 "should allow prices to rise slowly, so that after an intermittent low during the Brazilian harvest in 2014 we expect the price of coffee to recover".

'Optimistic regarding supply'

But cotton prices are seen falling to 70 cents a pound for the first time since 2012, pressed by the likelihood that China will revamp its generous state support regime which has been a big prop to values domestically and abroad.

And among grains, for wheat, the prospect of a rise in area, and another strong harvest, will keep pressure on prices, which should average $6.50 a bushel in Chicago and E190 a tonne in Paris in the last quarter of 2014.

"We are optimistic regarding the supply in 2014, which should be reflected in falling prices, particularly in the second half of 2014," Commerzbank said.

For soybeans, the bank saw a fall to $11.50 a bushel, a price last seen in January last year, as relatively high current values encourage production.

"Against the backdrop of expectations of a global surplus in 2013-14 and a positive outlook for the 2014 US harvest, a feeling of scarcity is unlikely to become established on the soybean market in the foreseeable future."

The bank forecast livestock finishing next year a little below current levels, at 83 cents a pound for lean hogs and 132 cents a pound for live cattle.

See the original article >>

Relentless Stocks Bull Market Continues

By: Tony_Caldaro

After making a new all time high last Friday the market traded lower all week. Then Friday’s Payrolls report was released and the market nearly managed to get back the entire loss in just one day. For the week the SPX/DOW were -0.2%, the NDX/NAZ were +0.3%, and the DJ World index lost 0.9%. Economic reports for the week were overwhelmingly positive. On the uptick: ISM manufacturing, construction spending, auto sales, the ADP, new home sales, Q3 GDP, monthly Payrolls, personal spending, the PCE, consumer sentiment, consumer credit, the M1-multiplier, the monetary base, the WLEI; plus weekly jobless claims, the unemployment rate and the trade deficit all improved. On the downtick: ISM services, factory orders, personal income and investor sentiment. Next week we get a look at retail sales, inventories and the PPI. Best to your week.

LONG TERM: bull market

Relentless isn’t it. The Cycle wave [1] bull market, now in its 56th month, has exceeded our bull market high projection by about 3%. We have been expecting this bull market to unfold in five Primary waves, and it is still in Primary wave III. Primary waves I and II ended in 2011. Primary III has been underway since then. Primary I took 26 months to unfold, and Primary III is now in its 26th month. Primary I rose a bit more than 700 SPX points, and Primary III is currently a bit more than 700 SPX points as well. How is that for symmetry.

There are differences however. Primary I had only one subdividing Major wave, while Primary III already has had two. The fifth wave of Primary I was quite short at 120+ SPX points. Primary III’s fifth wave is already nearly 200 SPX points. On the surface it would appear Primary III has the potential to extend in time and price.

MEDIUM TERM: uptrend

Last Friday the market hit an all time high early, and then had its first significant pullback since that rally from SPX 1777 began. There was also an abundance of negative divergences, from short term to medium and long term. This week the market did sell off, declining to SPX 1779 by midday Wednesday. This resolved most of the short term negatives.

We have been counting the current uptrend since the late August low at SPX 1627. The market first rose in five waves to SPX 1730, then pulled back to 1646. It rose in another five waves to SPX 1775, then pulled back to 1746. And finally another five wave rally to SPX 1814, then a pullback to 1779 this week. We mention this pattern because there has not been one overlap of any of the waves yet. In example: SPX 1746 bottomed above 1730, and SPX 1779 just bottomed above 1775. You can see this on the daily chart above, but it is clearer on the hourly chart below. What this means is that until there is an overlap we can not be certain that an uptrend has ended. Until SPX 1775 is overlapped this uptrend can extend yet again. Medium term support remains at the 1779 and 1699 pivots, with resistance at the 1828 and 1841 pivots.

SHORT TERM

Currently we have a tentative green v/i label at the SPX 1814 high. The ‘v’ suggests a potential Intermediate wave v high, ending Major wave 5 and Primary III. The ‘i’ suggests an Intermediate wave i high, with Intermediate waves ii-iii-iv and v to follow before ending Major 5. Until SPX 1775 is overlapped there is the potential for other counts as well. The overall bias appears to be bullish until SPX 1775 is overlapped.

Short term support is at the 1779 pivot and SPX 1746, with resistance at SPX 1810, SPX 1818 and the 1828 pivot. Short term momentum ended the week overbought. The short term OEW charts are positive with the reversal level SPX 1797. Best to your trading!

FOREIGN MARKETS

The Asian markets were mostly lower on the week for a net loss of 1.3%. Fifty percent are in confirmed downtrends.

The European markets were all lower on the week for a net loss of 3.1%. Seventy-five percent are in confirmed downtrends.

The Commodity equity group were all lower on the week for a net loss of 1.5%. All three indices are in confirmed downtrends.

The DJ World index is still uptrending but lost 0.9% on the week. Currently 65% of the world’s indices are in confirmed downtrends.

COMMODITIES

Bonds continue to downtrend losing 0.8% on the week.

Crude is uptrending again and gained 5.4% on the week.

Gold remains in a downtrend losing 1.7% on the week.

The USD is downtrending again losing 0.5% on the week.

NEXT WEEK

Tuesday: Wholesale inventories. Wednesday: Treasury budget. Thursday: weekly Jobless claims, Retail sales, Export/Import prices and Business inventories. Friday: the PPI. The FED has nothing scheduled until the FOMC meeting on the 17th and 18th. Best to your week and Holiday season.

See the original article >>

Did a “Bearish Candlestick Reversal” pattern just happen in S&P 500?

by Chris Kimble

CLICK ON CHART TO ENLARGE

In the world of candlestick charting, "Doji Star" patterns can often reflect important turning points in prices. If you are unfamiliar with this pattern (see more info here)

The above chart highlights that important weekly doji star patterns took place in 2008 & 2011, prior to declines most would have liked to have avoided if long at the time!

Two weeks ago the S&P 500 on a weekly basis might have created a Doji star pattern at an Fibonacci 161% extension and rising channel resistance line at (1) in the chart above. These patterns can take a while to play out,  wanted to give you a heads up to the potential key candlestick pattern.

As the sign in the above chart says...Please Stand By!

See the original article >>

Crude Oil in All Time Frames

by Tom Aspray

The impressive stock market gains on Friday helped to erase most of the losses from early in the week and turned the short-term momentum back to positive. Still it is not enough to indicate that stocks have begun a major new uptrend as the negative divergences discussed on Friday still need to be resolved.

It was a much different week for crude oil as it closed higher each day, closing the weekly with sharp gains. Since the late August high of $104.94, the January crude oil contract had dropped almost 15% into the late November lows of $91.77. The severity of the decline on the daily charts might have convinced many that the major trend was down.

This reinforces the need to examine all time frames to get a more accurate picture of a market’s direction. This is one of the reasons that several times a year I look at the yearly charts analysis to identify the key year levels to watch.

The January crude oil contract closed on Friday October 18 at $100.88, which was below the quarterly pivot at $101.11. This was the start of its sharp slide into the late November lows. This was consistent with a negative short-term outlook while the longer-term time frames still pointed higher.

This has added further confusion to investors in the energy sector as collapsing crude oil prices often have more of an impact on the energy stocks. Two of the key energy stock ETFs have lagged the Spyder Trust (SPY) so far this year but have done much better than crude oil. So where are the energy stocks and crude prices headed as we move into 2014?

chart
Click to Enlarge

Chart Analysis: The yearly performance chart shows the sharp divergence between crude oil and energy stocks in the last quarter.

  • Crude oil price performance peaked in early September at +16.4% for the year as it was outperforming the Select Sector SPDR Energy (XLE) and SPDR Oil & Gas Exploration ETF (XOP).
  • Just two weeks later, crude oil was acting weaker than these two ETFs, as well as the entire S&P 500 energy sector as highlighted by the circle on the chart.
  • By the end of November, crude was down 3.7% for the year while the XOP was up 21% and XLE had gained just over 17% for the year.
  • The gains last week have pushed crude back into positive territory for the year but it is still much weaker than the two ETFs.

Across all time frames, the daily analysis for crude oil is positive but the weekly OBV is still well below its declining WMA.

  • On the monthly chart the recent decline appears to be just a pullback within the gradual uptrend, line b.
  • The quarterly pivot for January crude oil is at $101.11 with the monthly pivot at $93.81.
  • There is next monthly resistance in the $105 area with major resistance in the $110 to $112.49 area.
  • The monthly downtrend is at $111.37 along with the monthly starc + band at $116.72.
  • The move in 2013 above the 2012 yearly high at $110.55 is a bullish development.
  • The monthly on-balance volume (OBV) is still holding above support at line d and a move above its WMA would be bullish for prices in early 2014.
  • There is monthly support in the $91.77 to $92.56 area.

chart
Click to Enlarge

The SPDR Oil & Gas Exploration ETF (XOP) dropped 1.7% on Friday primarily due to over a 6% decline in SM Energy (SM).

  • The weekly close was just below the 20-week EMA at $66.40 with the monthly projected pivot support at $65.38.
  • The breakout level, line a, is also now being tested.
  • The quarterly pivot is at $64.22, which was last tested in early October.
  • The weekly starc- band is at $62.15 with the long-term uptrend, line b, now at $60.66.
  • The relative performance dropped below its WMA in early November.
  • The RS line dropped sharply last week and looks ready to test support at line d.
  • The weekly OBV closed just below its uptrend, line e, this week.
  • The OBV has therefore reversed sharply from the highs in October.
  • Initial resistance is now at the monthly pivot at $68.37 with stronger in the $70-$72 area.

The Select Sector SPDR Energy (XLE) is up 22.7% YTD versus a 28.6% gain in the Spyder Trust (SPY).

  • XLE is still holding above its rising 20-week EMA at $84.71.
  • The weekly starc- band and uptrend (line f) are now in the $82.41 area.
  • The relative performance is now testing major support at line g, so this week’s action is important.
  • The weekly OBV shows a strong uptrend, line h, that goes back to the June 2012 lows.
  • The OBV has formed a clear pattern of higher highs in 2013.
  • The daily OBV (not shown) does show a negative divergence from the October highs.
  • There is first resistance now at $87.30-$88.24 with the weekly starc+ band at $91.53.

What It Means: The daily, quarterly, and yearly analysis of crude oil is positive while the weekly is negative. Therefore, the strength of the current rally will be important as it needs to be strong enough to turn the weekly analysis positive.

The action in both the SPDR Oil & Gas Exploration ETF (XOP) and the Select Sector SPDR Energy (XLE) has been disappointing and the strength of the next rally will be important. If it fails to overcome, I will look to reduce the positions in these two ETFs.

Many of the individual energy stocks like Phillips 66 PSX +1.31% (PSX), which is part of our portfolio has done much better than the ETFs. It and other energy stocks are acting much better technically, and I will be looking at these stocks for new buy candidates as we head into 2014.

How to Profit: No new recommendation.

Portfolio Update: Should be 50% long SPDR Oil & Gas Exploration ETF (XOP) from $66.04 with a stop under the October lows at $64.53.

Should be 50% long Select Sector SPDR Energy (XLE) from $86.71 with a stop under the seven week lows at $84.86.

See the original article >>

Sugar bears only think they have the upper hand

By Sholom Sanik

After teasing bulls with a spike to 20¢ per pound, sugar prices (NYBOT:SBH14) have eroded all the way back to their July lows.

The Oct. 18 fire at the Santos Port terminal in Brazil turned out to be a one-day event. Total monthly sugar shipments for Brazil have been down by more than 10% as a result of the damage to the facility, but the market was never very worried about the world supply situation. Some sugar shipments from the damaged warehouses will restart in January. More capacity will be restored by May. A combination of other ports picking up some of the slack and a well-supplied world market has allowed sugar prices to fall back to the lows.

Atypical dryness for this time of year is a mixed blessing for the Brazilian cane industry. On the one hand, it allows mills to continue crushing the current crop, but on the other it deprives the developing new crop of much-needed moisture. In any case, despite the harvest of a 10%-larger cane crop, estimates for sugar output for the center south region – where 90% of Brazilian cane is grown – have not changed much from the 34.5-million-tonne estimates we’ve seen over the past few months.

In mid-October, a large percentage of sugar mills in India balked at the government-controlled minimum price that they must pay to farmers for cane, claiming that it is too high and that they cannot turn a profit while world sugar prices are so low. Crushing normally begins in early November, but the millers refused to start the crushing season. The protest lasted for a few weeks, but eventually the millers caved in, and the crushing season got under way.

There was talk that the delay would of tighten world supplies, but again – like the Brazilian port situation – even before the dispute was settled, nobody seemed to be very concerned. The director general of the Indian Sugar Mills Association assured the market that despite the delays, Indian mills are still in perfect shape to meet export forecasts of between 3 and 4 million tonnes for the 2013-14 marketing year. Bears did not even blink as world prices continued to slide.

The standoff between the Indian millers and the government, while resolved without incident, underscores what we’ve been talking about – ad nauseam – over the past year. Production costs in the major sugar-producing nations, such as India and Brazil, have increased dramatically over the past few years, but prices have been falling. Ultimately, we will see mill closings, as we have in Brazil and the near miss in India. The market did not react – true. But how long can it last?

Production costs are unlikely to drop. Energy prices teetered a bit recently, but remain near historic highs. Labor costs in developing nations are rising. If world sugar prices do not stabilize and then rise, falling production and the inevitable deficits that are sure to follow will replace the burdensome surpluses we have at the present.

It will be a slow grinding process, but we believe it has begun. The International Sugar Organization (ISO) estimates that global sugar production fell 1.2% in the 2013-14 crop year, while consumption rose by 2.2%. There was still a production/consumption surplus of 4.7 million tonnes, but it will fade. The ISO forecasts that the trend of lower output and increased consumption will continue in 2014-15, with production falling by about 1.5% and demand increasing by 2.2%, which would result in a deficit of about 1.5 million tonnes.

We maintain our recommendation to hold positions in long-term sugar calls. At about 55 tics, October 2014 18¢ calls are a steal. Load up.

See the original article >>

Stocks Bear Market Bottoms, Gold Smart Money Buying Opportunity

By: Toby_Connor

In this business there is no greater buying opportunity than at a bear market bottom. For those few investors able to control emotions, delay gratification, and go against the crowd, a bear market bottom is where millionaires and billionaires are made.

Unfortunately for the vast majority of traders, emotions are much stronger than logic. Most people when they see a market that has gone up for five years automatically assume that it's going to continue to go up. And because everyone else is getting rich and they don't want to be left out, they jump on board too.

In reality a market that has gone up for five years is all that much closer to a top and the upside potential is limited, not exponential. Unfortunately at market tops traders are unable to think logically and all they know is that the money is coming easy. Unfortunately when something is easy, it's usually about over.

By the same token when a market has gone down for two years dumb money investors automatically assume that it will continue to go down for the foreseeable future. Let's face it why would anyone want to buy something that is going down when you can buy stocks, that are going up forever, and get rich quick? (This is the same mentality that was prevalent in the real estate market in 2005/06.)

Again if one would stop and think logically, a market that has gone down for two years is all that much closer to a bottom. This is how smart money investors think, they think logically instead of emotionally.

In the chart below notice how the volume exploded at the 2009 low. This is a classic example of dumb money emotional selling, and smart money contrarian buying. Now after five years we have the exact opposite. Big money is slowly selling into the rally to the emotional dumb money investors. Volume is contracting.

So if smart money is selling into the euphoria phase of this bull market, one has to wonder where they are putting their money. One need look no further than the closest bear market.

Smart money understands that all bear markets eventually come to an end. They understand that recency bias is a trap that catches investors at tops and prevents them from buying at bottoms. They control emotions, delay gratification, and understand that bear market bottoms are where the greatest buying opportunities in this business are generated. As you can see big money has been coming into this market since June in preparation for a bear market bottom.

I am cautiously optimistic that gold is in the process of completing a successful test of the June lows. If I'm correct then this will turn out to be one of the greatest buying opportunities of our lifetime.

Let me stress that this isn't the time to swing for the fences. Picking a bottom in a bear market isn't easy. If you're wrong and get caught in another leg down it's going to be painful as these can often drop 15 to 20%.

At the moment I'm watching for signs that gold has formed an intermediate degree bottom. If that bottom can hold above the June low it will confirm that June marked a final bear market bottom, and I believe the start of the bubble phase of the secular gold bull market.

In a somewhat related vein I want to finish this article by talking about inflation. The general consensus at the moment is that there is none. That of course is nonsense. We have massive inflation right now. Inflation is an increase in the money supply.

What most people don't understand, including members of the Federal Reserve, is that inflation doesn't typically flow evenly into all assets. During the beginning stages of an inflation liquidity usually flows into financial assets, as that is where the Fed targets its efforts.

Typically during the first stage of an inflation liquidity will flow into stocks, bonds, and in our case over the last decade real estate. It's only during the second stage of an inflation when these bubbles become overvalued and pop that the inflation that's being stored in the financial markets begins to leak into the commodity markets. At that point we "label" it as inflation.

Notice in the chart below that from 2002 to 2007 inflation expressed itself as rising stock prices and a bubble in the real estate market. During this time the general consensus was that we had little to no inflation. The reality was that we had massive inflation, it's just that everyone was looking for it in the wrong place. Once the housing bubble and stock bubble began to deflate the inflation that had been stored in these markets began to leak into the commodity markets and the second stage of the inflation began. This culminated with a spike in the CRB and oil reaching $147 a barrel.

I would argue that we are now about to begin a second stage inflation again. It appears that rising interest rates have already pricked the echo bubble in the real estate market, and at five years the bubble in the stock market is almost certainly in the final euphoria stage. Once stocks begin to stagnate and rollover we are going to see that same process that we saw in 2007/08 as inflation leaks out of stocks, bonds, and real estate and moves back into the commodity markets.

If I'm correct about gold forming a final bear market bottom then this second stage inflation is going to be an incredible driver for the next leg of gold's bull market, which I believe will probably turn into the bubble phase and top some time in 2017/18.

See the original article >>

Stock Market Rally Expanding the Distribution Phase

By: Andre_Gratian

Current Position of the Market

SPX: Very Long-term trend - The very-long-term cycles are in their down phases, and if they make their lows when expected (after this bull market is over), there will be another steep decline into late 2014. However, the severe correction of 2007-2009 may have curtailed the full downward pressure potential of the 40-yr and 120-yr cycles.

Intermediate trend - An important top formation is in the making.

Analysis of the short-term trend is done on a daily basis with the help of hourly charts. It is an important adjunct to the analysis of daily and weekly charts which discusses the course of longer market trends.

EXPANDING THE DISTRIBUTION PHASE

Market Overview

A decline which started in earnest last Monday came to a screeching halt on Friday when the jobs report proved to be stronger than expected. What was remarkable about this, is that previously, such a show of economic strength would have caused a sell-off, since it increases the odds of the Fed beginning to taper sooner rather than later. Tapering is now old news and traders have become jaded to its inevitability. We'll have to find something new that will worry the market enough to cause it to sell off!

While the various conditions which suggested that the market should reverse proved correct, the decline fell short of meeting the two conditions required for a protracted correction: breaking below the former short-term low of 1777, and a daily close with about -1800 in the A/D in order to break an important uptrend line. Until these conditions are met, we do not have an intermediate-term reversal.

That does not mean that we go straight up from here! Cycles are still down for the next week or two and a re-test of the low is more than likely. The probability of meeting the above conditions on that pull-back are slim and we can surmise that primary III is still ahead of us (assuming that the labeling is correct). What form it will take is for the market to tell us.

So what comes next? We'll have to wait until after the pull-back to get a count for the next uptrend. It could be fairly shallow because, although we have relieved the short-term pressure, the long-term ones are still there and will need to be addressed sooner or later. Here are recent observations made by the SentimenTrader:

"Traders in the Rydex family of mutual funds have moved to a new level of speculation in the major index funds. With $5.30 riding on bullish funds for every $1.00 of bearish funds, they've never been more exposed."

"Assets in equity mutual funds and ETFs have now eclipsed assets lingering in safe money markets by a ratio of 3.7 to 1, a three-decade record."

"Stocks showed a positive reaction on Friday, ostensibly in response to the Non-farm Payroll report. The move comes on the heels of what has already been extreme sentiment levels."

You tell me! Is that the condition of a market which is ready to move much higher before correcting?

Chart Analysis

The weekly oscillators had turned down during the week, but were rescued by Friday's surge and ended the week only a smidgen lower.

The daily chart (courtesy of QCharts) appears below.

We can see how Friday's strong move recovered most of the previous week's decline, but it stopped short of making a new high. Declining prices had broken a minor support level and come out of a minor up-channel, but stopped at the bottom of the next wider channel, just above the more important support that needed to be broken to start a more severe decline.

As mentioned above, the odds of the bottoming 8-wk cycle carrying enough punch to drive prices below the 1777 level are not very good, but you never know! The market has another week or 10 days to retrace from Friday's high, and this would leave us with the negligible possibility that we have completed the right shoulder of a H&S pattern. Therefore, dropping below 1777 would turn out to be significant. The short-term cycle that is being discussed is not the only cycle affecting the market at this time. There are longer-term cycles also exerting downside pressure that will intensify as we go forward.

In any case, it is clear that the daily oscillators did not generate a buy signal in spite of Friday's strong move up. They ended the day mixed with the MACD positive but declining, the SRSI neutral, and the A/D still negative. We'll see how they perform next week.

The hourly chart shows the effect of Friday's strength on the hourly oscillators. They ended the day overbought and in a position to roll over. Here, we see more clearly how the index could be in the process of making a right shoulder. To confirm this and taking advantage of the bottoming cycle, it would have to retrace over 28 points and move below the red horizontal line in about a week. Beyond that, we will be entering one of the most bullish periods of the year with the cycle in a new up-phase. It will then be a matter of how much headway SPX can make during the next two or three weeks. By the first or second week in January, with more cycles bottoming in February, there will be another attempt at reversing the trend in a significant way. The weaker the advance, the better the chance the bears will have to inflict some real damage on the bulls.

Cycles

The 8-wk cycle still has another week or ten days left before it gets to the bottom of its phase. That's enough time to affect prices negatively, perhaps in a real way. There are intermediate and long-term cycles which are also exerting downward pressure on the market and can perhaps give it an extra push.

Breadth

The McClellan Oscillator and Summation Index (courtesy of StockCharts.com) appear below.

During the first few days of November, the McClellan Oscillator went negative and pretty much stayed in the red zone while SPX was tacking on another 60 points to complete the move which started at 1646. That had the effect of driving the Summation Index almost down to the level where it was at the beginning of October -- a level corresponding to the mid-1600s of the SPX.

That kind of relative weakness in breadth is a stern warning that all is not well in the price inner structure, and it should eventually result in more than a 34-point correction.

NYSE McClellan Oscillator Daily Chart

NYSE Summation Index Daily Chart

Sentiment Indicators

The SentimenTrader (courtesy of same) appears to be establishing a new norm of 70 in its long term indicator. It has closed at that elevated level for five consecutive weeks. Perhaps more importantly, it remained at that level throughout last week's correction.

If, after another week or so of pulling back, that reading remains in place and the market attempts to move higher, there is a good chance that we could even see a higher reading by early January. If that occurs, and if there has been no significant improvement in breadth, the market will become even more vulnerable to an intermediate correction than it was last week.

Sentiment Weekly Chart

VIX

By moving above acluster of former short-term tops, VIX made an attempt at breaking out. However, it was pushed back inside its base by Friday's strong rally and, while it may again come out of it on next week's expected market pull-back, it is unlikely to develop enough momentum to get above its declining long-term trend line. This is what it would take to signal that a major top is in place and it looks as if VIX has a little more work to do before it gets to that stage.

IWM (ETF for Russell 2000)

IWM found support on its uptrend line and former short-term peak, telling us that it was not ready to give a sell signal. This coming week, it will have another chance to try again. This may not mean much, but note that Friday, IWM closed a little weaker than SPX. This could give some credibility to another anticipated pull-back.

BONDS

TLT continues to languish at the low point of its long-term correction with little sign that it is about to do anything significant. It appears to have two options: work its way even lower, or continue to create a base from which it will eventually be able to attempt a rally in a downtrend.

GLD (ETF for gold)

GLD is trying to hold above its former long-term low, but as long as it remains under pressure from its bottoming 25-wk cycle which is due in a week or two (red arrow), the odds continue to favor a continued decline to about the 110 area.

UUP (dollar ETF)

UUP continues to consolidate after its initial break-out. Its lack of positive response to the strong non-farm payrolls report Friday, makes one wonder how ready it is to resume its uptrend. The MACD is about to go negative, which could indicate some additional selling directly ahed. The primary factor behind the dollar's weakness is the Fed's interest rates policy. We may need to see evidence of a change before UUP can regain some upside traction.

USO (United States Oil Fund)

USO found support near the low of a former congestion level and bounced. It also appears to have completed a 5-wave pattern at 33. If so, it may now have started a corrective wave which, when complete, could lead to new lows.

Looking at the larger structure, it apears that USO's rise to 30.50 was also a corrective wave, and that the index is now in danger of breaking out of the green channel on the downside. Note that its previous rally was stopped by the junction of two resistance lines, confining it to the bottom of its rather tepid bull market channel from the 2009 low. Any serious decline in the stock market - which is only a matter of time - will most likely send it below the rising trend line and cause it to drop to the bottom of the red channel - at a minimum. This is not a chart pattern that is encouraging to the bulls.

Summary

After an initial decline from its 1813 high, SPX found support at the bottom of a channel and at a level just above its 200-hr MA. Friday's jobs report initiated a strong counter-trend rally which could be wave "b" of a corrective pattern. Wave "c" be should be formed as a result of the pressure exerted by the 8-wk cycle which is due to bottom in a week to ten days. This is one potential scenario.

However, if the next pull-back exceeds 1777, a much weaker correction could be in process. Even if the current correction is limited in scope, SPX may find it difficult to make much more upside progress. The negatives pointing to an important top have not gone away and are not likely to be erased by only a short-term pull-back. On the contrary, more upside will only exacerbate them.

See the original article >>

Rising Stock Market Does Not Lift All Stocks

By: Michael_Noonan

We advocate a proactive stance in managing one’s stock portfolio as the most prudent way to preserve and grow capital, by capturing gains and limiting risks. The days of buy and hold are finished, at this stage of a central bank propped-up market, fed by fiat and highly questionable reports issued by the Bureau of Lies, which seems an accurate assessment.

There are several charts to be shown, and where a picture may be worth 1,000 words, we can limit we say and defer to what the market has to say. After all, the market is the best source and always the final arbiter.

The trend is up. Price rallied strongly from a small reaction. The close was strong and volume increased. These are all positives. A note of caution comes from the lack of upside progress, an inability to rally above the small range high from the previous week.

There is a clustering of closes, and that can lead to continuation or a correction. Odds favor continuation, but we are mindful of the previous cluster in July. Of course, the weekly chart is not used for timing, so the daily chart comes next.

We like to see continuity, a story between the different time frames. There is a series of higher swing highs and higher swing lows, the easiest way to define an up trend. There was bullish spacing at the November swing low. The mid-November swing high was the same price as the next little swing low, so there was no spacing. This lets us know that the market reaction was relatively weaker, but within the context of being in an up trend.

Measuring the swing highs, at the left, confirms the lack of upside progress on the weekly chart, and when seen in more detail on the daily, the market is showing less ability to achieve greater net upside progress, another sign of a weakening of momentum. It does not mean the trend is changing, but just tiring. That could all change next week with a sharply higher market, for example. Just stay with the trend until there are greater signs of change.

If price fails to make new highs, next week, the note of caution would grow, and individual stock performance[s] should be addressed, relative to the index.

The Nas did make new highs, and continuation is expected for next week. The breakout high followed a clustering of closes, an example of how they led to more upside and not a correction. It is important to compare individual stock performance with this index to know how to respond to each stock’s development.

Examples follow.

On 17 November, we gave one way to use developing market activity for initiating new positions that provided an edge.  [See Markets Talk, Few Listen. Profit Is Only Objective]. It will review why each position was taken.  The same stocks are reviewed below.

This was what the chart looked like on 17 November.

Buying “right” is important to provide a market edge and give time in the trade. The first expectation is for continuation higher, or the trade gets reassessed, even sold, if initial results fail to go higher, relative to the overall market.

Whatever one’s rules are for managing positions, [ You do have rules, do you not?!], you can see there has been ample time to determine whether to hold, take partial profits, stand aside, raise stops. Your rules would determine your strategy. This was, and continues to be a good trade.

Relative to the overall market, TJX is not rallying in a similar fashion. This is a small red flag to monitor the position closely. As a previous leader, it should continue to lead or, if not, be cause for concern.

As of the time when this commentary appeared, SSYS was doing well.

Reversal of fortune? Buying with an edge gave time to monitor the red flag high that had a poor close. A single bar is not always determinative, but it should be respected if there is more follow through to the potential reversal.

Next day, there was continued downside on increased volume. We would have looked at an intra day chart to make a decision to stay or cut loose, but assuming the worst, one could have exited at the low of the day for at least a minimal gain. You can see how after the next 10 TD effort, price was still weak, and this is a stand aside to reduce risk exposure.

We noted the red flag high bar, similar to SSYS. This bar qualified as an OKR, [Outside Key Reversal - a higher high, lower low, and in this case, a lower close, not just from the previous day, but it erased the previous 4 TD activity]. [TD = Trading Day]

Unlike SSYS, there was no immediate downside follow through. Our message was, “Why stay with it?” That was due to a sideways move while the markets were still trending up. The motive was to reduce risk exposure, not maximize questionable profit potential

Reversal of fortune!

Assume a stand aside, there was little lost in the process. As it turned out, the reaction to the OKR was weak, very little give-back to the downside. What we know about weak reactions in a bull market is that they usually lead to higher prices. Using the same basis for taking a long position in mid-October, the pattern repeated itself and led to another buy the breakout opportunity.

This is a NAS component, and that index was holding well, giving additional insight into expectations for the buy set-up. We would view the last two bars as another red flag to watch the position closely relative to the overall market.

What we can take away from this is how to use pattern recognition, combined with some rules for engagement in order to take a position in the market that offers an edge. From the last commentary, DE was an example of what NOT to buy, even though there were many “investors” buying that stock, so there has been a variety of examples.

We recognize there are many other ways to get a market edge. This is to demonstrate how even just one kind of pattern set-up can lead to a profitable market experience. Why settle for less?

With an edge, you have time and opportunity in each trade to: control and minimize risk, monitor the position for taking partial profits, if warranted, and/or moving up stops to lock in profits should the market reverse. You have the individual stock performance and the relative overall index as another measure for how well, or not, each stock is doing.

Sounds like a plan, does it not? And one that works, based on market information and pattern recognition.

See the original article >>

Stock Market Christmas Rally Starts Monday!

By: Chris_Vermeulen

Tis the Season for the most powerful seasonality trade of the year!

Seasonal ETF Trading StrategiesWith the stock market up big in 2013 and most participants are speculating on a pullback in the next week or two, I have to say I am on the other side of that bet. Being a technical trader I focus on patterns, statistics and probabilities to power my ETF trading strategies. So with 37 years of stats the seasonality chart of the S&P 500 index paints a clear picture of what is likely to happen in December.

If you do not know how to read a seasonality chart, I will explain as its very simple. The simply shows what the index has done on average through each month over the past 37 years. December typically has the strongest up trend and probability of happening any other time of the year.

The Big Board – NYSE

The NYSE also referred to as the Big Board, is an index with the largest brand name companies. Most individuals do not follow this, but to me its as close to the holy grail of trading than anything else I know. I use many different data points from this index (momentum, order flow, trend) for my ETF trading strategies.

You must follow the trend of this index if you want to be on the right side of the market. While I follow and track the New York Stock Exchange closely and it has its own fund NYC but it’s an ETF trade I do not use. These big stocks are what really move the market (S&P 500) I think so I always trade with this index trend in mind.

S&P 500 Weekly ETF Trading Strategy – Bullish

The chart below is self-explanatory I think… But let me recap.

The overall trend is up, so your ETF trades should be to the long side buying on the dips. The chart below goes back three years so the candles are a little condensed and small, but what you need to know are these two points:

1. After a correction within a trend, probability says that price is more likely to continue rising than it is to reverse. Notice the market just had a running correction through the summer months.

2. A reversal candle on the weekly chart (bullish reversal candle) generally indicates a 2-3 week rally is likely to happen.

Conclusion: Seasonality says higher prices, weekly chart below shows bullish reversal candle… Oya!

The Bigger Picture: 3 -6 Months Out…

This is a quarterly chart and BIG picture outlook. Over the next 3-6 months we could see the stock market start to become choppy and rollover into a minor bear market for a couple years. That is the best case scenario I think… The other scenario is a major crash back down to the 700-1000 level on the SP500 which would cripple the baby boomer’s from retiring and getting a job would be impossible for almost everyone – full blown recession way worse that what everyone is saying we are in now.

Things are going to be really interesting over the next few years and things for south you better be prepared to make a killing during the next bear market or life will not be fun. The nice thing is that you can take advantage of these moves without ever having to lift a finger with my automated trading system.

ETF Trading Strategies Holiday Conclusion:

In short, I think we have a couple good weeks ahead of us. Holiday season, quality family time and a rising stock market paints a nice picture in my mind.

See the original article >>

Weighing the Week Ahead: An End to the Tapering Obsession?

by Jeff Miller

Over the last two weeks we have had an avalanche of economic data – mostly good news. The market reaction has been mixed, because so much of the "hot money" has a Fed fixation. For much of the last two weeks, every piece of good economic news led to lower stocks, presumably because this would lead to a reduction in QE. Finally, the good payroll news on Friday got the opposite reaction.

The question for the coming week – and maybe the next few months – is will "good news" finally be good news? Put another way,

Will the fixation on the "T word" finally come to an end?

The media, increasingly catering to their trader audience, plays into the constant focus on the Fed. This allows everyone to join in, but it has not provided much actual help for investors.

I have some further thoughts in the conclusion. First, let us do our regular update of last week's news and data.

Background on "Weighing the Week Ahead"
There are many good lists of upcoming events.  One source I regularly follow is the weekly calendar from Investing.com. For best results you need to select the date range from the calendar displayed on the site. You will be rewarded with a comprehensive list of data and events from all over the world. It takes a little practice, but it is worth it.

In contrast, I highlight a smaller group of events, including some you have not seen elsewhere.  My theme is an expert guess about what we will be watching on TV and reading in the mainstream media.  It is a focus on what I think is important for my trading and client portfolios. Each week I consider the upcoming calendar and the current market, predicting the main theme we should expect. This step is an important part of my trading preparation and planning. It takes more hours than you can imagine.

My record is pretty good. If you review the list of titles it looks like a history of market concerns. Wrong! The thing to note is that I highlighted each topic the week before it grabbed the attention. I find it useful to reflect on the key theme for the week ahead, and I hope you will as well.

This is unlike my other articles at "A Dash" where I develop a focused, logical argument with supporting data on a single theme. Here I am simply sharing my conclusions. Sometimes these are topics that I have already written about, and others are on my agenda. I am putting the news in context.
Readers often disagree with my conclusions. Do not be bashful. Join in and comment about what we should expect in the days ahead. This weekly piece emphasizes my opinions about what is really important and how to put the news in context. I have had great success with my approach, but feel free to disagree. That is what makes a market!

Last Week's Data

Each week I break down events into good and bad. Often there is "ugly" and on rare occasion something really good. My working definition of "good" has two components:

  1. The news is market-friendly. Our personal policy preferences are not relevant for this test. And especially -- no politics.
  2. It is better than expectations.

The Good

Most of the recent news has been very good.

  • China's PMI of 50.8 shows expansion and represents a new recent high.
  • Congress seems to be nearing a deal on the budget. This will avoid another round of debt ceiling and shutdown crises, and it may even open the door to immigration reform. (See The Hill). It will not represent a "grand bargain" which might still be five years away. (See Stan Collender for ten reasons).
  • GDP was stronger than expected in Q3. The revision was mostly the result of inventory buildup, which invites spinning. Bob McTeer is well aware of this issue. It all depends on whether the inventories represent intentional accumulation for anticipated sales, or disappointing current performance.
  • Employment is improving. The weekly jobless claims hit a new low. The monthly employment situation report shows a nice rebound with growth in the household survey and a lower unemployment rate. We are still far from resuming trend growth, but it is an improvement and certainly belies any lingering recession worries. Scott Grannis has a nice summary, including a chart of both the major surveys. He also puts to rest the part-time employment argument, writing as follows:

    Despite what you might have heard repeated many times in the media, jobs growth in the current recovery has not been dominated by part-time jobs. As the chart above shows, there actually has been zero growth in part-time jobs since the last recession, and the ratio of part-time to total jobs has been falling steadily, much as it has in every recession in the past.

Private Nonfarm Employment

Yardeni indicators

  • Michigan sentiment was very strong. I view this as an important concurrent indicator both for employment and consumption. Doug Short's chart is my favorite and his analysis is excellent.

Dshort michigan

  • Housing still looks good – new home sales and permits. See the authoritative work from Calculated Risk.

The Bad

There was not much bad news. Feel free to add suggestions in the comments. These should be items from the current week, not the repetition of something you could have said (and probably did) six months ago!

  • Personal income disappointed, declining in real terms. See Steven Hansen's analysis.
  • The ISM Services index was positive, but below expectations.
  • Holiday sales were soft for some retailers – at least from the early reports.
  • Investor sentiment remains very bullish, a contrarian short-term indicator. Bespoke charts the AAII data:

AAII Bullish Sentiment 112913

Silver Bullet

I occasionally give the Silver Bullet award to someone who takes up an unpopular or thankless cause, doing the real work to demonstrate the facts.  Think of The Lone Ranger. Thanks to the many readers who wrote or commented suggesting that my analysis of the Morgan Stanley chart on forward earnings should be this week's winner. I cannot give myself the award, but I do urge readers who missed the article to take a look. It was like a movie that got critical acclaim but did not attract a big audience.

Ironically, the original chart I was analyzing pretty much went viral.

The Indicator Snapshot

It is important to keep the current news in perspective. I am always searching for the best indicators for our weekly snapshot. I make changes when the evidence warrants. At the moment, my weekly snapshot includes these important summary indicators:

  • For financial risk, the St. Louis Financial Stress Index.
  • An updated analysis of recession probability from key sources.
  • For market trends, the key measures from our "Felix" ETF model.

Financial Risk

The SLFSI reports with a one-week lag. This means that the reported values do not include last week's market action. The SLFSI has recently edged a bit higher, reflecting increased market volatility. It remains at historically low levels, well out of the trigger range of my pre-determined risk alarm. This is an excellent tool for managing risk objectively, and it has suggested the need for more caution. Before implementing this indicator our team did extensive research, discovering a "warning range" that deserves respect. We identified a reading of 1.1 or higher as a place to consider reducing positions.

The SLFSI is not a market-timing tool, since it does not attempt to predict how people will interpret events.  It uses data, mostly from credit markets, to reach an objective risk assessment.  The biggest profits come from going all-in when risk is high on this indicator, but so do the biggest losses.

Recession Odds

I feature the C-Score, a weekly interpretation of the best recession indicator I found, Bob Dieli's "aggregate spread."  I have now added a series of videos, where Dr. Dieli explains the rationale for his indicator and how it applied in each recession since the 50's.  I have organized this so that you can pick a particular recession and see the discussion for that case.  Those who are skeptics about the method should start by reviewing the video for that recession.  Anyone who spends some time with this will learn a great deal about the history of recessions from a veteran observer.

I also feature RecessionAlert, which combines a variety of different methods, including the ECRI, in developing a Super Index.  They offer a free sample report.  Anyone following them over the last year would have had useful and profitable guidance on the economy.  RecessionAlert has developed a comprehensive package of economic forecasting and market indicators. Their most recent report provides a market-timing update for those considering whether to "buy the dips."

Georg Vrba's four-input recession indicator is also benign. "Based on the historic patterns of the unemployment rate indicators prior to recessions one can reasonably conclude that the U.S. economy is not likely to go into recession anytime soon." Georg has other excellent indicators for stocks, bonds, and precious metals at iMarketSignals. His most recent update revisits Albert Edwards's year-old prediction that the Ultimate Death Cross was imminent. Georg refuted the claim at the time, and now takes a more complete look.

Unfortunately, and despite the inaccuracy of their forecast, the mainstream media features the ECRI. Doug Short has excellent continuing coverageof the ECRI recession prediction, now two years old.  Doug updates all of the official indicators used by the NBER and also has a helpful list of articles about recession forecasting.  Doug also continues to refresh the best chart update of the major indicators used by the NBER in recession dating. The ECRI approach has been so misleading and so costly for investors, that I will soon drop it from the update. The other methods we follow have proved to be far superior.

Readers should review my Recession Resource Page, which explains many of the concepts people get wrong.

Here is our overall summary of the important indicators.

Our "Felix" model is the basis for our "official" vote in the weekly Ticker Sense Blogger Sentiment Poll. We have a long public record for these positions.  Over the last two months Felix has ranged over the full spectrum – twice! The market has been moving back and forth around important technical levels, driven mostly by news. The current values are still bullish, but only marginally so.

Felix does not react to news events, and certainly does not anticipate effects from the headlines. This is usually a sound idea, helping the trading program to stay on the right side of major market moves. Abrupt changes in market direction will send sectors to the penalty box. The Ticker Sense poll asks for a one-month forecast. Felix has a three-week horizon, which is pretty close. We run the model daily, and adjust our outlook as needed.

The penalty box percentage has decreased dramatically, meaning that we have more confidence in the overall ratings. 

[For more on the penalty box see this article. For more on the system ratings, you can write to etf at newarc dot com for our free report package or to be added to the (free) weekly ETF email list.  You can also write personally to me with questions or comments, and I'll do my best to answer.]

The Week Ahead

After the post-Thanksgiving data feast, we have a relatively thin week for new data.

The "A List" includes the following:

  • Initial jobless claims (Th). Resuming a key role as the most responsive employment measure.
  • Retail sales (Th). The consumer remains a focal point.

The "B List" includes:

  • PPI (F). Inflation data remains tame, so this is not likely to move the markets.

The speechmaking schedule is still thin. James Bullard of the St. Louis Fed will speak on Monday. Secretary of State Kerry will testify before a Congressional Committee on Tuesday. We will also get more news on the developing budget deal.

How to Use the Weekly Data Updates

In the WTWA series I try to share what I am thinking as I prepare for the coming week. I write each post as if I were speaking directly to one of my clients. Each client is different, so I have five different programs ranging from very conservative bond ladders to very aggressive trading programs. It is not a "one size fits all" approach.

To get the maximum benefit from my updates you need to have a self-assessment of your objectives. Are you most interested in preserving wealth? Or like most of us, do you still need to create wealth? How much risk is right for your temperament and circumstances?

My weekly insights often suggest a different course of action depending upon your objectives and time frames. They also accurately describe what I am doing in the programs I manage.

Insight for Traders

Felix continues in bullish mode. In our trading accounts we have been fully invested and the positions have gradually become more aggressive. Felix's ratings have been in a fairly narrow range for several months. The rapid news-driven shifts are not the ideal conditions for Felix's three-week horizon. This week we see somewhat lower ratings, but more sectors in the penalty box. There are still three attractive sectors, but it would not be surprising to see a move toward "neutral" in the week ahead.

Felix gets credit for identifying biotech (IBB) and riding the wave. This has been one of the top-rated choices in our free weekly email update (email address in the "Felix" section above.

Insight for Investors

I review the themes here each week and refresh when needed. For investors, as we would expect, the key ideas may stay on the list longer than the updates for traders. I am covering some detailed ideas and links in this section, but also see the conclusion.

There is a continuing barrage of "bubble talk." It seems like there is a drumbeat of stories with the same bearish themes, mostly relying on the Shiller CAPE P/E method of valuation and also the argument that profit margins are elevated. These are both rather old and tired arguments, but the refutation gets little publicity. Worried investors should take a few minutes to read these two sources:

Macro Man – analyzing a number of bearish arguments. The entire article is great, but let me focus on the issue of profit margins, where he writes as follows:

[Argument] Earnings as a percentage of GDP are too high. They will revert back to the long term mean, which means substantially lower profits.
That is only true if you look at TOTAL earnings. DOMESTIC earnings are NOT excessively high as a percentage of GDP. Much of the recent earnings growth over the past decade has actually come from abroad:

Image002

Jeremy Siegel, who has been absolutely right about the market, both for the very long term and for the current year. Advisor Perspectives Editor Robert Huebscher had a fine recent interview where Prof. Siegel explains why the market is 10-15% undervalued right now, and has the potential for working significantly higher. He especially responds to arguments based upon his friend Robert Shiller's CAPE ratio, profit margins, and Fed policy.

Here is a summary of current recommendations for the individual investor.

  • Headlines. The challenge for investors is to distinguish between the major trends and the short-term uncertainty. The main themes are not related to headlines news, even though sentiment may drive market fluctuations. Do not be seduced by the idea that you can time the market, calling every 10% correction. Many claim this ability, but few have a documented record to prove it. Most who claim past success are using a back-tested model. Please see The Seduction of Market Timing.
  • Risk Management. It is far better to manage your risk, specifically considering the role of bonds and the risk of bond mutual funds. As I emphasized, "You need to choose the right level of risk!" Right now, it is the most important question for investors. There is plenty of "headline risk" that may not really translate into lower stock prices. Instead of reacting to news, the long-term investor should emphasize broad themes.
  • Bond Funds are Risky. Investors have been surprised at the losses, which will continue as the long end of the interest rate curve moves higher. You need to have the right mix of stocks to benefit from a rising rate environment.
  • Stepping in gradually. If you are completely out of the market, you are not alone. Consider buying dividend stocks and selling calls against them. This strategy has been working great both for our clients and for many readers. (Thanks for the email responses!) This will work in a sideways market. You can also buy some stock in the sectors with the best P/E ratios.

And finally, we have collected some of our recent recommendations in a new investor resource page -- a starting point for the long-term investor.  (Comments and suggestions welcome.  I am trying to be helpful and I love feedback).

Final Thought

We are reaching the end of a year when many scary possibilities did not occur. Since these many scenarios weighed on stocks, it was natural to see a rally driven both by an improved economy and earnings as well as a reduction in fear. Those who attribute everything to Fed policy are simply making excuses for their bad forecasting as I noted in The Fed as a Fig Leaf.

The classic wall of worry concept, which you can learn more about on my investor page, was nicely illustrated by this chart from LPL Financial (via Cullen Roche).

LPL2

If we had nothing to worry about, the Dow would already be at 20K, fulfilling my prediction. I am looking forward to a time of less emphasis on the Fed and more attention to market fundamentals.

See the original article >>

Hedge funds warned over closing corn, sugar bets

by Agrimoney.com

Hedge funds should be slow to curb their bearishness over corn futures, but take care over getting too downbeat over sugar, for which the scope for further price falls appears limited, Macquarie said.

Managed money, a proxy for speculators, cut its net long position in futures and options in the major US-traded agricultural commodities for a sixth successive week in the week to December 3 – albeit by only 873 lots, according to data from the Commodity Futures Trading Commission, the US regulator.

The trend reflected in the main a further collapse in the net long position that hedge funds hold in New York raw sugar, which dropped by more than 39,000 contracts – the biggest bearish shift in positioning on records going back to 2006, and one termed "larger than expected" by broker Sucden Financial.

In just five weeks, hedge funds' net long position in raw sugar futures and options has tumbled from a near-record 200,000 contracts to 73,489 lots, reflecting a firm finish the Brazilian production season and improved hopes for Indian and Thai output.

Limited downside

However, Macquarie cautioned investors over getting too downbeat on sugar price prospects.

Speculators' net longs in grains and oilseeds, Dec 3, (change on week)

Chicago soybeans: 151,078, (+4,910)

Chicago soymeal: 58,531, (+4,522)

Kansas wheat: 20,684, (+1,551)

Chicago soyoil: -35,594, (-9,264)

Chicago wheat: -64,013 (+2,028)

Chicago corn: -118,814, (+22,237)

Sources: Agrimoney.com, CFTC

"Prices need to fall back further in the short-term to encourage more demand to absorb the carried-over surplus from last season," the bank said.

"But should prices touch 16 cents a pound, we would recommend getting long again."

The bank highlighted that, besides the growing number of short bets, speculators maintain a gross long position of more than 150,000 contracts in New York raw sugar futures and options.

"There are already many gross longs that are happy to position themselves at today's prices, which could be attractive in the longer term."

Raw sugar futures for March delivery rose 0.8% to 16.72 cents a pound in early deals on Monday.

'Prices to fall further'

By contrast, Macquarie urged hedge funds to be cautious over continuing to cover their historically large net short position in Chicago corn futures and options, which they have reduced by more than 60,000 contracts over the last five weeks, to 118,814 lots.

Speculators' net longs in New York softs, Dec 3 (change on week)

Raw sugar: 112,627, (-23,918)

Cocoa: 77,526, (+2,037)

Cotton: 7,360, (+2,392)

Arabica coffee: -21,516, (+1,420)

Sources: Agrimoney.com, CFTC

"Prices are likely to fall further in the short term as fresh supplies hit the market," the bank said, flagging the impact of the record US harvest, which is expected to see stocks more than double over 2013-14.

"Farmers are undersold compared to previous seasons, and we recommend staying short in the near term."

While the corn market may see "some support" return in 2014-15, assuming weaker prices discourage sowings while boosting consumption, "even then US stocks would remain comfortable at above 15.5% of consumption".

'Very comfortable with shorts'

The CFTC data also showed hedge funds taking a breather on boosting their net short position in Chicago wheat futures and options, after a five-week selling spell.

Speculators' net longs in Chicago livestock, Dec 3, (change on week)

Live cattle: 91,142, (+11,436)

Lean hogs: 60,432, (-3,542)
Feeder cattle: 8,142, (+623)
Sources: Agrimoney.com, CFTC

They reduced their net short, although by a modest 2,000 contracts from the record 66,000 contracts set the previous week.

While prices of US soft red winter wheat, the type traded in Chicago, are "looking very cheap on the world market, nonetheless, funds have managed to establish a record large position and appear very comfortable maintaining shorts", Jonathan Watters at Benson Quinn Commodities said.

Indeed, the net short position "has likely grown substantially" since last Tuesday, after Canada depressed prices by on Wednesday hiking its official estimate of the domestic harvest to a record 37.5m tonnes.

'Strong buying demand will emerge'

Among soft commodities, speculators raised their net long position in New York cotton futures and options in the latest week, but only by 341 lots, leaving it at a relatively low 7,701 contracts.

Bullish sentiment in cotton has been depressed by improved prospects for the US harvest, and concerns over Chinese sales from its huge reserves, a result of a generous support programme for farmers.

"However, at the low 70s cents a pound, we believe strong buying demand will emerge, and being too short could be risky - especially bearing in mind that China is committed to maintaining its existing support programme for 2013-14," Macquarie said.

In the livestock complex, speculators turned more negative on lean hog futures, for which prices sank sharply last week, undermined by rising US slaughter numbers and record animal weights.

However, they turned more bullish on live cattle, in which US cold weather, which curtails weight gains in animals, has limited the temptation among investors to act on negative technical signals and take profits.

See the original article >>

Follow Us