Monday, May 16, 2011

Demystifying the Stock Market VIX Volatility Index


In 1993, the Chicago Board Options Exchange (CBOE) introduced the CBOE Market Volatility Index. The CBOE Market Volatility Index, known by its ticker symbol VIX, measures the volatility of the U.S. equity market. It provides investors with up-to-the-minute market estimates of expected volatility by using real-time OEX index option bid/ask quotes.

The VIX is calculated by averaging S&P 100 Stock Index at-the-money put and call implied volatilities. The availability of the index enables investors to make more informed investment decisions. Going over the VIX history along with the S&P 100 OEX index it is quite evident that all of the spikes in volatility accompanied market downturns and significant events that affected the market.

This history reveals a great deal about the relationship between market and volatility. There is a definite tendency of the VIX to spike upward during periods of market decline. For example, during the major market decline of October 1987 volatility reached very high levels. Volatility then declined steadily until late 1989. The spike in volatility at that time was the result of the sharp one-day market correction in October.

Another sharp increase in volatility occurred in August and September 1990, the period during which Iraq invaded Kuwait. In January 1991, volatility rose sharply again, just before the initiative led by the United States known as Operation Desert Storm. The last peak in volatility displayed in the chart reflected the downturn in the market, occurring one month before the United States presidential election in November 1992.

The tendency of market volatility to expand during market downturns is clear from this historical account. This relationship is the subject of numerous studies of the options market. Perhaps the best way to understand the relationship between volatility and market declines is to look at the options market form a put perspective.

A put is the option market equivalent of an insurance policy. An investor may purchase a put to insure a sale price for the underlying asset. The seller of a put may be viewed as the equivalent of an insurance underwriter. The put writer accepts a premium in return for accepting a risk, which in this case is ownership of the underlying asset. In the insurance business, premiums rise following significant negative events. In the options business, market volatility, the critical factor in determining put premium levels, increases in periods of market distress.

The same factor that leads to an increase in put premium levels, increased volatility, causes call option premiums to increase at the same time. Thus, put premium levels and call premium levels move together because they are both related to volatility. This relationship is critical to the option strategist. High call premiums during periods of market distress are the opposite of what most investors expect.

A similar pattern would be observed if we looked at a chart of the implied volatility of an individual stock. When looking at an implied volatility for a stock, remember that the number can vary from option to option within a family of options. It can also change for in-the-money or out-of-the money types.

For this reason, most data services use a filtering process, or weight more heavily the more liquid at-the-money contracts. The most important consideration is that the service remains consistent in applying its rules. Remember also that as a stock's options become less liquid, the implied volatility becomes a volatile number. This would suggest that decisions based on implied volatility would be better for liquid issues than those less often traded. The bottom line is that the VIX is the central starting point when putting together option strategies.

Stock Market Warning Signs


It is been my belief that stocks and the economy have been locked in a secular bear market since March of 2000. During that period we've had two recessions and two cyclical bear markets. One of those recessions was the worst since the Great Depression and the last bear market in stocks was the second worst in history.

I've said all along that printing money will not cure the problem we've gotten ourselves into. It's never worked in history and it's not going to work this time either. We can't solve a problem of too much debt with more debt. All we will accomplish is to make the problem bigger.

We are now fast approaching the period when the next crisis should arrive.

On average the stock market suffers a major correction about every four years. In a secular bear market that cyclical trough arrives as the economy sinks into recession and a stock market bear bottoms out.

The last four year cycle bottom formed in March of '09. That just happened to be the longest four year cycle in history. I've noted before that long cycles are often followed by a short cycle that compensates for the extended nature or the prior cycle. If that's the case then the next four year cycle low is due sometime in 2012. (My best guess is in the fall.)


As we are still in a secular bear market then the move down into the four year cycle trough should correspond to another economic recession and cyclical bear market for stocks. Bear markets tend to last about a year and a half to two and a half years. If the next four year cycle bottoms in the implied timing band then the current cyclical bull should be topping soon.

As a matter of fact the stock market is already flashing warning signs. Three of the largest and most important sectors in the S&P have not confirmed new highs.


Another warning sign; Despite record earnings the market has only been able to move to marginal new highs and is now in jeopardy of reversing the recent breakout.

I've noted in the past that this is how major tops and bottoms are often established. Smart money sells into the breakout, or buys the break down in the case of a bottom. The trend then reverses and a major turning point is formed. Both the '02 bottom and the '07 top were put in this way.


The market is now at risk of a similar event as we've experienced a marginal breakout to new highs that is threatening to fail. Don't forget this is happening against a back drop of record earnings.


When a market can't move higher on good news something is wrong. And don't forget bull markets don't top on bad news, they top on good news.

If the market can recover and move to new highs the cyclical bull will be confirmed, but if the market continues to fade and drops back below the March 16th "tsunami" bottom it will constitute a failed intermediate cycle. If both the Dow and the Transports close back below that level we would have a Dow Theory sell signal and that would confirm the next leg down in the secular bear has begun.

It would also be a signal that the economy was unable to handle the spiking food and energy costs that were the direct result of Bernanke trying to prop up the financial system with his printing press. Like I said, printing money has never been the answer. Every empire in history has tried this approach and not one of them has ever succeeded with it. We won't either.

See the original article >>

Fundamentals of gold, silver remain very sound


Gold and silver are lower this morning as the recent bout of weakness continues. Equities in Asia were lower on economic growth and inflation concerns and European indices are also lower as Greek debt talks are in disarray after the weekend arrest IMF’s Dominique Strauss-Kahn.

There are concerns that the IMF’s chiefs’ arrest may delay resolution of Europe’s deepening debt crisis and Greek bonds have fallen again seeing the 10 year yield rise to 15.58% - close to the record highs seen last week.

Oil prices are lower again on growth concerns despite a significant increase in tensions in the Middle East with clashes on Israel’s borders with Syria, the Lebanon and Egypt.

Gold is likely to find support from geopolitical risk emanating from the tinderbox that is the Middle East.

Gold and silver’s fundamentals remain very sound and yet the majority of the western public remain unaware of the fundamentals and unaware of the significant macroeconomic, monetary and geopolitical risk facing them today.

Tensions in the Middle East and North Africa, concerns that Japan is on the verge of a severe recession (due to its earthquake, tsunami and its worsening nuclear catastrophe), risk of sovereign debt contagion in Europe and the U.S. (the U.S. is set to reach its $14.3 trillion 'debt ceiling' this week) and ultra loose monetary policies, currency debasement and inflation are contributing to continuing safe haven demand.

This is especially the case in China and India where strong demand has continued after the recent sell off and where demand continues to surprise analysts and market participants.

The Financial Times reported on Saturday that “the sharp drop in gold and silver prices has stimulated a surge in buying from India in a sign that consumers in the world’s largest gold-buying country retain faith in the decade-long bull story for precious metals.”

Chhabil Jain, a Mumbai silver trader told the Financial Times that “demand for silver bars was going through the roof” and that “many vendors were starting to run low on stocks”.

“People are booking incredible amounts of silver as they see the current drop in prices as a great opportunity to buy more ... most are buying for pure investment,” he added.

Bloomberg reports this morning that silver was the most traded commodity in April.

Incredibly, the value of trading in silver futures in India was four-times greater than gold. Trading of silver futures on the Multi Commodity Exchange gained more than sevenfold to 4.1 trillion rupees in the April 16-30 period from a year earlier, regulator’s data showed.

Indians unlike their western counterparts still silver as an important store of value to protect against the declining purchasing power of paper currencies.

U.S. Debt Ceiling of $14.3 Trillion To Be Reached
While the media focuses on the weekend arrest IMF’s Dominique Strauss-Kahn, a more fundamental and important story is that of America’s debt ceiling of $14.3 trillion which is likely to be reached, possibly today or tomorrow. America’s budget deficit this year alone is set to be a record breaking $1.5 trillion.

These figures and America’s appalling fiscal state means that gold and silver remain important diversifications.

Should the US Congress fail to vote to increase the debt limit today or this week, the White House has warned that the country would default on its debt and spark a new financial crisis.

The US Treasury has threatened to implement "extraordinary measures" so America can keep paying its bills until August.

Federal Reserve Chairman Ben Bernanke told Congress last week that any delay in increasing the debt limit would result in higher interest rates and could have "extremely dire consequences for the US economy".

The reality is that the continuing imprudent and profligate fiscal and monetary policies in the U.S. are likely to lead to higher interest rates and have "extremely dire consequences for the US economy".

Recent and continuing unsustainable fiscal and monetary policy have led to safe haven demand for gold and silver and the continuation of the bull markets in the precious metals.

Until fiscal and monetary discipline and sanity returns to America and the world, gold and silver will continue to be bought in order to hedge the continuing debasement of fiat currencies.

GoldGold is trading at $1,491.30/oz, €1,056.98/oz and £921.69oz.

SilverSilver is trading at $34.09/oz, €24.16/oz and £21.07/oz.

Platinum Group Metals
Platinum is trading at $1,755.50oz, palladium at $703/oz and rhodium at $2,025/oz.

Forecasts on Ukraine grain exports 'too low'

by Agrimoney.com

Official forecasters are too downbeat about prospects for Ukraine's rebound in grain exports next season, despite the prospect of duties on shipments, one of the most powerful men in the country's farm sector said.
Andrey Verevskyy, chairman of sunflowers-to-silos giant Kernel, said that the Black Sea agricultural powerhouse would "have the potential to export above 20m tonnes" of grain in 2011-12, representing a rise of at least 50%, provided the country does not suffer a return of the weather extremes which marred last year's harvests.
The forecast is above the 19m-20m tonnes forecast by Ukraine and an 18.5m-tonne estimate last week from the US Department of Agriculture.
Although Mr Verevskyy failed to expand on his thinking, and was in line with both Kiev and Washington forecasts on grain production, he was sanguine over the prospect of Ukraine relaxing export curbs only to introduce duties on shipments in their place.
"While we clearly view the free export of grain as the best option available to both farmers and market operators, we nevertheless understand the government's concern and interest in keeping inflation under control," Mr Verevskyy said.
"To achieve this goal, we consider the introduction of reasonable grain export duties as an acceptable mechanism to counter the increase in food prices in the country."
Ukraine is the top-ranked corn exporter outside the Americas, and was the world's sixth-ranked wheat shipper before last year's devastated harvest.
Trader hoarding?
The comments come amid heightened speculation about the return of the region, renowned for its price competitiveness, to large-scale shipments, with some traders also forecasting a limited return to trade from Russia, which barred grain exports completely from August.
"Grain traders in Russia still believe that some exports will have to be allowed at or ahead of harvest to relieve the storage situation in the south," the UK arm of major European commodities house, with operations in the region, said in a market report late on Friday.
"The thinking now is that a quota of about 3m tonnes will be exported, quite possibly with an export tax imposed."
SovEcon, the Moscow-based analysis group, on Monday reported prices of fourth-grade wheat, the main type used for exports, rose 25 roubles last week to 5,475 roubles a tonne as traders secured delivery to elevators in expectation of a lifting in curbs on shipments.
Profits jump
Mr Verevskyy's comments came as Kernel revealed that the volumes of grain handled by its export terminals had near-halved, to 510,000 tonnes, during the January-to-March quarter, thanks to Ukraine's quota regime.
The group blamed a halving in its grain sales, to 393,000 tonnes, on the same issue.
However, higher prices for what was traded, coupled with a jump in bulk sales of sunflower oil, in which the group has lifted capacity through takeovers and organic growth, lifted revenues by 91% to $515.4m during the quarter.
Earnings rose 95% to $77.9m
Kernel shares, which are listed in Warsaw, rose 2.1% to 73.40 zloty in morning deals.
See the original article >>

Morning markets: weather change protects crops from sell-off

by Agrimoney.com

It has passed.
The date, that is, of May 15 when US corn should be planted before yield potential falls. Actually, many observers swear by May 10, and others May 1.
Whatever, a good chunk of corn has not been sown within the optimal window (just how much data from the US Department of Agriculture after the close will reveal) and the chances of getting much more in over the next few days have weakened with a change in forecasts for the wetter.
The weekend brought damp notably for the eastern Corn Belt, where farmers have been particularly behind in sowings.
And "weather models shows the low that is trapped in the atmosphere over the eastern third of the US is not going to go anywhere anytime soon", WxRisk.com.
Too dry, too wet
Later in the week, a fresh low will develop over western Colorado "that will track north east into the Upper Plains into the Dakotas by Thursday", slowing spring wheat sowings again, besides bringing "significant/moderate rainfall to the western Corn Belt and Upper Delta", a negative for corn.
It will also bring "another round of significant heat for the portions of the lower Plains at the end of this week into the weekend with 90+ degrees Fahrenheit temperatures likely", not so good for drought-stressed winter wheat.
And the outlook isn't so bright for Europe either.
"All of the weather models have turned drier with all of France, Germany, Poland, Austria, Hungary all of Belarus and the Ukraine seeing only 25-50% of normal rainfall in the day one-to-five and in the six-to-10 day time frames,"WxRisk.com said.
Agritel said: "The weather is expected to remain dry in Europe, and most crops are now impacted to some extent, especially in France."
Overhang eroded
Add to this some freezing US temperatures over the weekend, a potential setback to seedlings, and the stage was set for a more upbeat start to the week for prices.
Chicago corn gained 1.8% to $6.94 ¼ a bushel for the July contract, now in the spot position, as of 07:20 GMT (08:20 UK time) with its wheat peer up 1.3% at $7.37 ½ a bushel.
Soybeans, which are later sown, added 0.5% to $13.35 ½ a bushel for July.
Also in crops' favour, and notably corn's, was the selldown that speculators have already undertaken over the last few weeks, meaning that the potential for further sales is only modest.
Large funds sold nearly 35,000 contracts in the week to last Tuesday, regulatory data late on Friday showed, bringing the total over the past three weeks to more than 75,000 lots.
External affairs
And it is not only agricultural commodities that have been out of favour this month, of course, with metals also sold, and notching up further small losses on Monday, against a backdrop a marginally firmer dollar.
Oil dropped 1.4% to $98.30 in New York.
Indeed, weather appears to have separated crops from another risk-off day in external markets, with the arrest of Dominique Strauss-Kahn, the International Monetary Fund head, on sexual assault charges adding to a tendency to shift to safer assets.
Japan's Nikkei share index closed down 0.9%, with Shanghai stocks shedding 0.7%.
'Funds wounded'
"Hedge funds have been wounded over the course of the last couple weeks" in commodity market investments, Brian Henry at Benson Quinn Commodities said.
"It's likely some of these funds are having a hard time getting off the mat since the energy markets fell apart."
Cotton certainly struggled to join in Monday's rally, looking less particularly threatened by weather and, as a non-food crop, more attuned to economic sentiment.
New York's July contract gained 0.5% to 145.84 cents a pound, with the new crop December lot up 0.1% at 115.74 cents a pound.

US Stocks-ETF Account Strategy Changes

By David Kotok

There were big changes in portfolios last week.

We downgraded materials and energy. Those accounts have moved to underweight from overweight. Healthcare was upgraded again and is now the most overweight. Consumer staples are also overweight. So is telecom. In addition, there is a cash reserve.

For the moment, we are not fully invested. When we apply our allocation methods to the sectors of the S&P 500 and modify the weights for the relative size of a sector, we cannot find enough sectors to invest 100% of a portfolio. That is a warning sign to raise some cash.

Another warning sign is an indicator named for the late Yale professor James Tobin. Tobin’s Q is an estimate of the value of the stock market vs. the value of the replacement of the assets that are represented by those underlying stocks. One can do this estimation for the market as a whole or for sectors and industries within the market. For example, when manufacturing stocks are cheap it is more economical to buy capacity on the stock exchange than to go and build a plant. When stocks are richly priced, the opposite is true.

Harvard Professor Greg Mankiw estimates Q on his blog. See: http://gregmankiw.blogspot.com/2011/03/tobins-q.html. He compares data derived from the Federal Reserve with the total stock market, using a Vanguard ETF. The chart on his website tells the story. Bottom line: stocks are not cheap. They were two years ago. They are getting expensive now.

Note that Q does not tell you when to trade. It is not a short-term trading guide. It does tell you when valuing levels are cheap or richly priced. Today Q is sending a very clear message that the US stock market is vulnerable to a correction, because it is pricing assets higher than their replacement cost.

A third warning sign is found in the ratio of total stock market value to GDP. We use several methods to calculate this one. GDP is estimated by US statisticians and is readily available to anyone who seeks the information and its revisions. Stock market capitalizations are another matter. One has to beware of double counting from ETFs and from exaggeration of totals from debt-like instruments and preferred stocks. These also trade on the exchanges and distort the actual total equity numbers.

We use World Federation of Exchanges aggregates and we use the exchange estimates from each exchange. We also use Ned Davis’ extensive database. Ned tries to exclude the influence of preferred stocks. In the current environment, all three methods are giving us warnings signs that US stock market value is very high relative to GDP.

One sector that is currently underweighted in our portfolios is the financials. They have underperformed for some time. They were over 23% of total market valuation at their peak before the financial crisis. They accounted for over 40% of the reported earnings of all US stocks. They included firms like Fannie Mae and Lehman Brothers and AIG. Now Financials remain under 16% of the S&P 500 index. Only the technology sector is larger, at almost 18%. For reference, healthcare is 11.4%.

We discussed these sector weights in our May 9 interview with Mark Haines and Melissa Lee on CNBC Squawk on the Street. See: http://www.cnbc.com/id/42956733. The key point is getting these weights “right.” Readers may find the interview on sectors worthwhile. It is only a few minutes.

While the macro stock market indicators have been warning investors, the market has favored commodity-oriented sectors like materials and energy. Those have done quite well and have been the leaders until last week. Now the CME has imposed margin requirements that shocked the markets. That is an additional warning sign; it piled on the valuation level indicators. It was enough for us to make an immediate change. It started with silver and had it been limited to silver we would have stayed the course. However, it expanded and now includes oil and other commodities. It adds to the risk premium on all commodities because the future actions of the CME have now become unpredictable. That news was the catalyst for an immediate change in our strategy.

The news actually broke on Monday night while we were doing a joint interview with John Kilduff and Sri Jegarajah on Squawk Box Asia with Martin Soong and Karen Tso joining in. John Kilduff actually read the summary of the CME release on the air. Such is the world that breaking news in the financial arena comes on air from a Singapore-based studio connected live to New York via satellite and one of the parties is reading the release from a Blackberry. In the US, it was almost 7 PM.

Readers may not know that Sri compiles an oil price sentiment survey on a regular basis and publishes it on CNBC-Asia. John Kilduff and I are both participants.

Anyway, as soon as we exited the TV studio, we immediately started to put the energy sector profits in the bank and went from overweight to underweight. That was initiated and completed last week in all US stock ETF accounts. Increases in margin requirements have a history of triggering selling. That is a trading indicator. 

In the CNBC interview on Squawk Box Asia, I call it a “game-changing” event.

The change realigned many weights for us and raised some cash. We have not finished realigning weights on the buy side and clients come ahead of readers, so this is all we can say now.

It has turned out that “Sell in May and go away!” may yet be applicable in 2011. Time will tell.

See the original article >>

Compelling Evidence Extended Stocks Bear Market Rally To End


On November 26th 2010 I posted “My view still is that the rally in equity markets since March 2009, with its persistence of upward wedges and broadening top formations across such a broad range of financial entities and time frames, is compelling evidence of an extended bear market rally that will soon end.”

In my last posting on January 24th 2011, I wrote that equity markets were overextended, with upward wedge patterns and broadening formations still predominating in most of the leading US and world equity market indices. 

Let me state now that nothing much has changed, except that many uptrends in equities have been broken and that probable tops continue to mature.

Pattern and trend analysis of key US Sector Indices highlight the mostly negative features over the short term. They also show clearly that the market as a whole is in a major decision mode, with very little room to move before one will be made. Note the close correlation between charts of the Mining Index, the Industrial Metals Index and BHP – where one goes the three will go and where these three go the rest of the market will follow – including the Australian Dollar.

Over the last few months, equities and metal prices have deviated from the mean to bullish levels approaching the elastic limit of where they can go. Barring the traditional US “pulling the proverbial bullish financial rabbit out of a hat”, I expect the emphasis to remain on a topping out process, sensitive in the short term to a testing of current price support levels. If and when support lines , as shown in some of the charts below, are decisively broken, then money flowing out of equities and corporate bonds must go somewhere and that somewhere I expect will be US T-Bonds and the USD.

The VIX chart also indicates high risk, showing a level of complacency more associated over the last few years with future market weakness rather than strength.

More than two years after an equity market rally that started in March 2009, the US Bank Index is still sitting below the neckline of an 11 year top. It is fascinating to me, that despite socializing the debts of a 30 year speculative frenzy with a multi-billion dollar bail out by the US government and the use of essentially free money to gamble in the world wide casino of derivative and high frequency trading to generate huge ongoing profits, the monthly Bank Chart below remains an ongoing testament and threat to a more bearish longer term future of equities in general.

Perhaps what this chart is trying to tell us, is that the combination of past indiscretions and the hundreds of trillions of dollars of corporate money sloshing around the world as indescribable “virtual” derivatives, will sometime soon come back to bite the banks on their collective virtual backside. It should be remembered that the world’s financial media and economists faced with a similar situation back in 2007/2008, also failed miserably to anticipate the GFC at that time. Not much has changed in this regard and equity prices in the USA are back to where they were prior to the recent GFC only three short years ago.

Current chart weakness in the Euro and the British Pound, together with an uncomfortably high AUD, coupled with a basing out of US 10yr T-Notes and 30yr T-Bonds prices, suggests that the US T-Bonds will most likely be the bullish recipients of falling equities – at least for the short to medium term. On my Comex charts the 10yr T-Notes and 30yr T-Bonds are both sitting just under five month resistance lines, whose upside penetration (through 123 – 10yr and 125 – 30yr) is a critical contrary move to any sustained downward move in equities.

While the USD on the charts is still sensitive to a move down for a testing of lower prices, it historically has shown an unnerving tendency to go straight up with minimal retracements in times of increased financial uncertainty. The same would apply to US government bond prices with the US 30yr T-Bonds (see second last chart) showing an uninterrupted uptrend still intact after a long 30 years. 


See the original article >>

Gold, Silver, and Dollar Long Term Trends with Fibonacci Retracements

By: Jesse

Here is some general knowledge on Fibonacci Retracements

The placement of the pattern on the chart is given to some subjectivity. I prefer to do it according to the patterns I am attempting to analyze. Obvoiusly there are other ways of doing it. 

This is by way of saying that these are my own calculations. There are others.

The Anglo-American banking cartel will resist change with increasing determination, and at times bitter opposition.


See the original article >>

GOLD’S CHART OFFERS 3 TECHNICAL LESSONS

by Tom McClellan


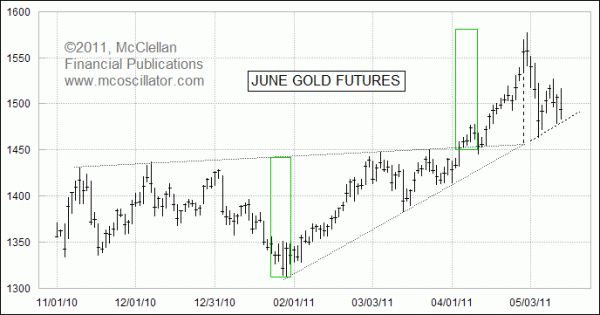
June gold prices
May 13, 2011

Silver has been getting most of the attention lately among the precious metals, but gold’s chart offers us some really great examples of classical bar chart analysis that are worth paying attention to. If you have never read Technical Analysis of Stock Trends, by Edwards and Magee, you ought to make a point to read it because it is considered the bible of classic bar chart analysis.

Typically when discussing the important lessons of bar chart analysis, analysts focus on one tenet at a time. But this week’s chart features 3 great lessons in a single chart.

Lesson #1

Triangles Offer Measuring Objectives

Prior to its big move up above $1500/oz, gold had been constrained within a big triangle structure. The breakout from that triangle was to the upside, and so we can apply the measuring objective rule to figure where the upside objective should be. The green rectangles highlight how this is done. The height of the triangle gets added to the breakout point to arrive at the measuring objective. At the intraday high on May 2, the June gold contract just missed reaching that objective by a couple of bucks.

Lesson #2

Breakouts Usually Get Tested

When gold prices first broke out above the upper boundary of the triangle on April 5, it rose for a few more days but then the price fell back down to test the support offered by that upper boundary. This is an important point for all chartists to understand: broken resistance agents like that trend line can turn into support agents, and vice versa. At the point when it was clear that the support had held during the retest, that marked a great low-risk point to take a bullish stance for the extension of the breakout.

Gold prices have also pulled back down to the support offered by the rising bottoms line that formed the lower boundary of the triangle. A pullback like that is also normal, especially considering how far prices had gotten extended above that trend line.

Lesson #3

The Apex Matters

The point at which the two boundary lines of the triangle converge will often have importance for price action. That importance can occur either in terms of the timing of a future turning point, or in terms of price. Sometimes it matters in both ways. I have seen examples of prices returning back down to touch the exact price-time point of an apex.

In this instance, the apex coincided exactly with the top of gold’s up move. This is not unusual, and not all that rare of an occurrence. To see a different example of how an apex like this marked a turning point for the SP500, see the March 16 issue of our Daily Edition.

CYCLICAL BULLS WITHIN SECULAR BEARS & THEIR SHORT DURATION

by Cullen Roche

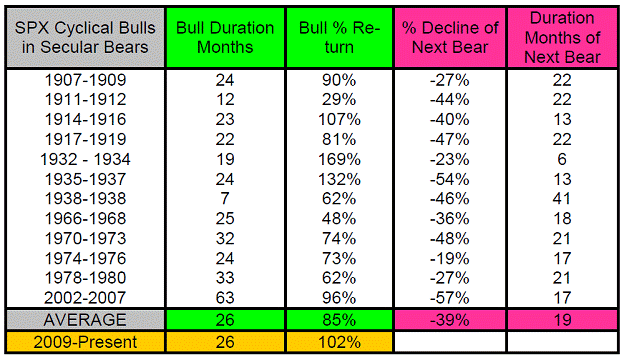
John Hussman has some good data from Nautilus Capital regarding the average duration of cyclical bull markets within secular bear markets. If we indeed remain in a secular bear market then the current cyclical bull run could be nearing its end or even extended:
“You might expect that when the market is gradually working down from a high level of overvaluation, bull markets would tend to be shortened, and bear markets would tend to be deeper. In fact, that’s exactly what we observe. As the guys at Nautilus Capital note, cyclical bull markets within secular bears have tended to average just 26 months, with an average gain of 85%, while cyclical bears within secular bears have averaged 19 months, with steep average losses of -39%. So market cycles tend to be truncated during secular bears, averaging a full bull-bear duration of just 3.75 years, for a full-cycle average gain of just over 12% (3.3% annualized). Of course, fundamentals still tend to grow faster than 3.3% over the cycle, resulting in valuations that are lower at each bear market trough, even if prices are higher in absolute terms. I recognize that outcomes like these are unpleasant and inconvenient to contemplate, but denying the possibility doesn’t make anyone a better investor.”

See the original article >>

Follow Us