Sunday, July 24, 2011

The S&P 500 & Gold Play A Crazy Little Game of Poker

by JW Jones

Recently I have had several members of my service requesting my thoughts on the macroeconomic backdrop which is shaping financial markets. I decided I would proffer an article about why I find such practice to be a total waste of time. Don’t get me wrong, acknowledging what is going on in the world around us as a trader is important because economic data and geopolitical events shape social mood. Social mood is just one catalyst that directly impacts financial markets and it is important for traders to monitor the world around them.

However, building trading plans based on events with outcomes that are unknown and unknowable is foolish. If an event’s outcome is unknown, one would surmise that the market’s reaction to the news is unknown as well. If a trading plan is built on multiple unknowns it can lead to a disastrous outcome for trades built around such premises. I pay attention to the headlines, but I don’t base trading decisions solely on the news cycle. Spending time building detailed thoughts about the future of events and then trading based on those events also cause traders to become biased with regard to price action.

Let me be clear, I do read analysis from experts on global events, but I don’t build trading plans around what I read. I try to look at the news and decipher what impact events will have on social mood. Once I have what I feel to be a grasp of social mood, then I look at fundamentals which could be earnings reports or economic data points searching for more clues about social mood and the strength of specific economies. From there, I use basic tape reading and technical analysis to help identify trades that have sound risk / reward. Trading is not a guessing game, nor is it gambling. The best traders take a variety of forms of data, interpret them, and then build trades that make sense based on probability.

Trading is very similar to playing poker. Everyone sits down with the same amount of money essentially and the money on the table does not really change. All that happens is money moves from one perception of the game to another. Those who understand and accept risk at appropriate times are rewarded more often than those who ignore risk. As time goes on, the players who understand the game and risk the most make the most money as their probability of success is higher than those who play every hand ignoring potential hazards. Trading is identical in thought and practice. Understanding risk and leveraging probability is what separates great traders from speculators.

As is customary, I will provide readers with a little bit of insight about what I believe could play out in the S&P 500 and gold. Before I get into the chart work, I would like to remind readers that this market is treacherous. Risk has not been this high for quite some time and ignoring it is foolhardy. I am trading smaller position sizes, taking profits quickly, and ultimately I’m sitting in cash waiting for price to breakout and offer solid setups where risk is defined. Currently the S&P 500 and gold are stuck between major overhead resistance and underlying support. Breakouts are going to transpire, but the question is which direction price will ultimately go. I’m going to let others do the heavy lifting and wait patiently for a solid setup to trade.

It seems to me that social mood is pretty poor at this point, economic data has not been great, earnings have been solid except for Caterpillar, and headline risks are plentiful. With that said, I am starting to lean slightly in the bullish camp. My reasoning is built around the fact that the majority of retail investors and novice traders are all setting up for a nasty selloff.

The only selloff I see possible is in the Treasury bond market and possibly the U.S. Dollar. In either case, equities could rally and it would be a surprise to most investors and traders. Mr. Market will punish as many traders and investors as possible and the majority are leaning bearish, so my contrarian instinct says to watch for bullish setups, but be patient enough to see them breakout before jumping aboard.

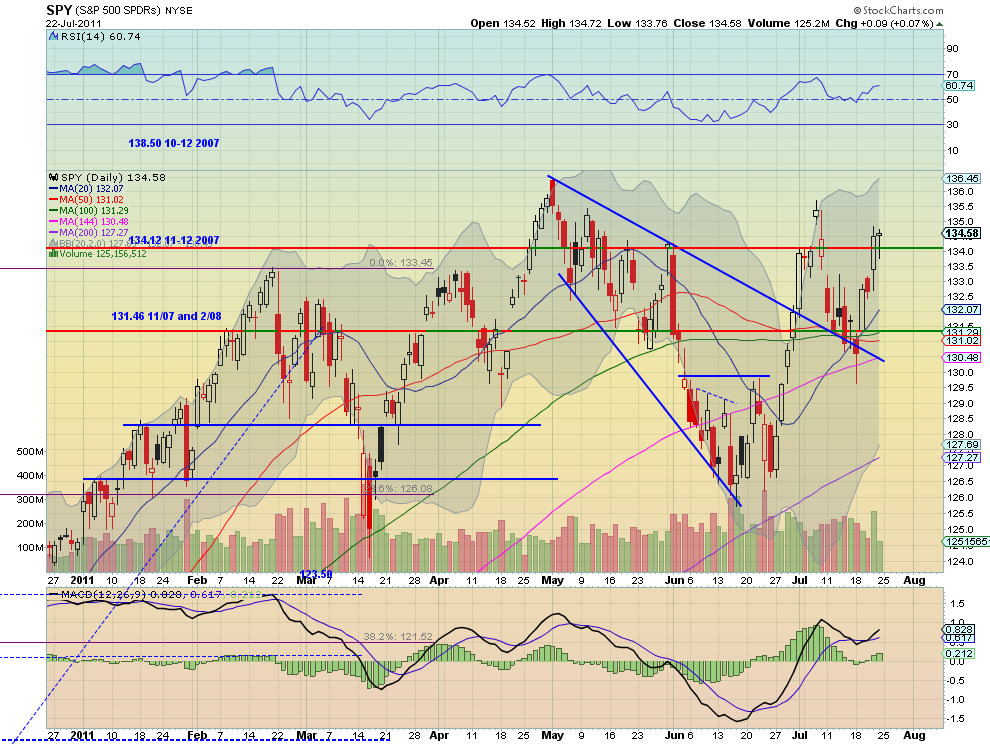
I intend to trade the S&P 500, but I am waiting on a confirmed breakout in either direction. I really don’t care which direction it is, I just want to be patient and let Mr. Market talk. Once I know the expected directional bias, I will have a solid risk / reward entry because I will be able to define risk at the breakout level regardless of which direction price ultimately arrives at. The key levels I’m watching on the S&P 500 Index are shown on the daily chart below:

If the S&P 500 extends to the upside above the S&P 1,350 price level a test of the 2011 highs will take place. I believe that if tested a second time we could see the 2011 highs taken out and a trip to the S&P 1,420 – 1,450 price levels before year end. Consequently, if price breaks down on the S&P 500 below the S&P 1,295 level I expect price to work down to the March pivot lows. If they breakdown, a trip to the S&P 1,150 – 1,180 area is likely.

Thus the conundrum described above is now in focus. The S&P 500 remains range bound and until a confirmed breakout takes place, I will likely remain neutral with a slight bias to the upside for good measure. However, I would point out I am simply going to be patient and let Mr. Market dictate the terms of price. I am just going to wait Mr. Market out instead of having some kind of trading plan built on assumptions about the outcome of multiple independent variables which at this point are unknown.

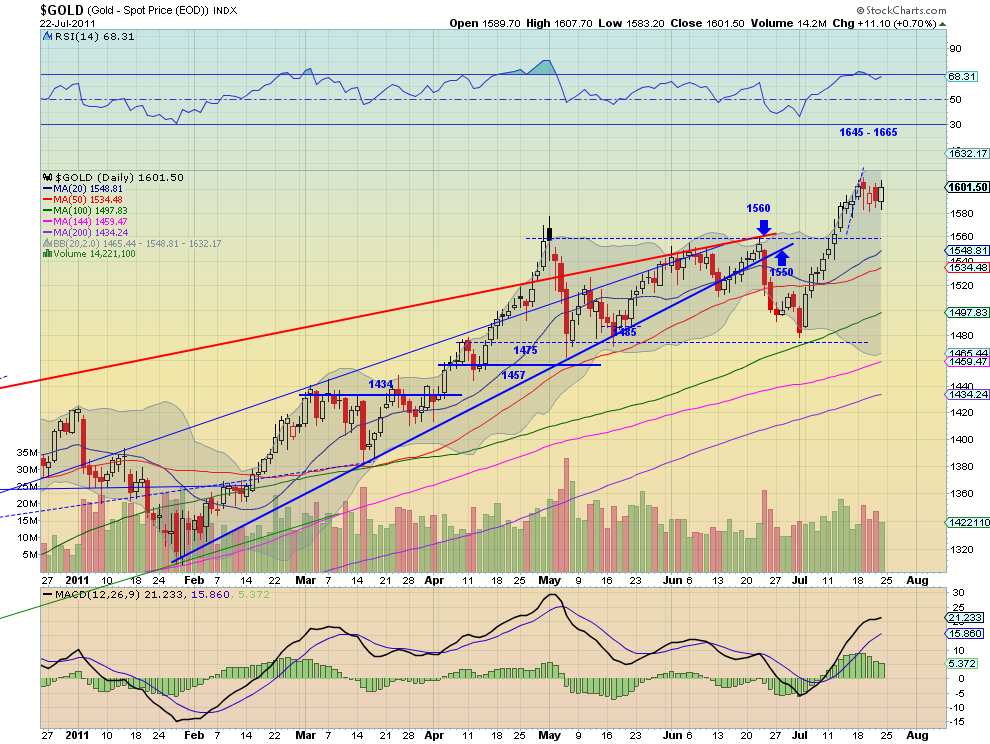
My most recent article discussed the likelihood for a small correction in gold and silver. We pulled back quite a bit, but news coming out of Europe and the flight to safety has bounced gold prices back near recent highs. I will likely establish new long positions in gold and silver on a breakout over recent highs that has strong momentum and volume. I continue to believe that in the longer term gold and silver will remain in a bull market due to the continuing devaluation of various currencies by deficit laden, overextended federal governments around the world. The daily chart of gold is shown below:

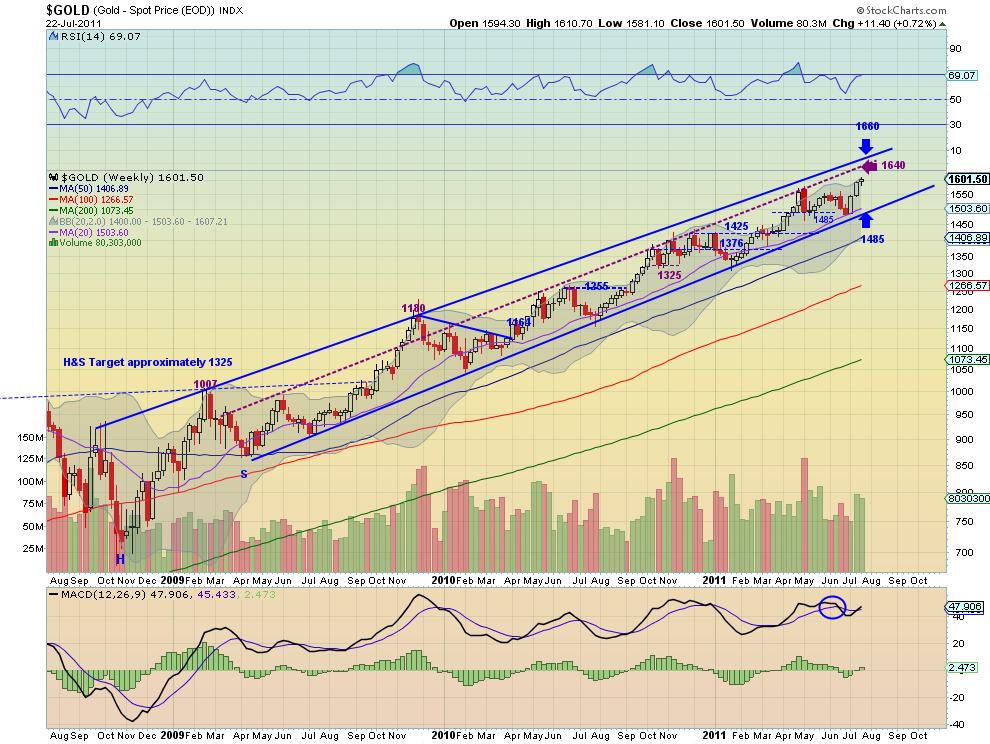
Gold similarly to the S&P 500 is trading in a range between the recent all-time highs and the breakout level which was offering resistance and now stands as support. If price breaks above the recent highs I will expect a move higher that could close in on $1,700 – $1,750/ounce by the end of the year. If price breaks below the recent breakout level (1,580) a thrust as low as $1,410 – $1,480/ounce could play out in a short period of time. I continue to believe higher prices are far more likely, but I will respect the price action. The weekly chart below of gold prices illustrates the key price levels:

In closing, I would remind readers to monitor their risk aggressively, keep position sizes small, and protect capital at all costs. Risk is extremely high currently and price could go either direction in a variety of asset classes.

Macro week in review preview july 23-2011

by Gregory W. Harmon

Last week’s review of the macro market indicators looked for Gold to continue its run higher and for Crude Oil to continue to consolidate with a bias for any breakout to the upside. The US Dollar Index looks ready to move higher but could consolidate further, while US Treasuries move sideways. The Shanghai Composite looks ready to break the flag higher while Emerging Markets consolidate in a broad range between 44.2 and 48.2. Volatility looks to remain subdued but despite this Equity Index ETF’s, SPY, IWM and QQQ look biased to the downside in their broad ranges, but near support. A true stock pickers market.

The week began by Gold and Crude Oil reversing roles, with Gold consolidating around the 1600 level and Crude Oil moving higher. The US Dollar Index tested higher Monday but then fell throughout the week while Treasuries did consolidate. The Shanghai Composite continued its flag, and Emerging Markets kept the range drifting towards the top end. Volatility came back in and as it did the SPY, IWM and QQQ dropped Monday and rose through out the rest of the week, with the QQQ’s making a new high. What does this mean for the coming week? Let’s look at some charts.

As always you can see details of individual charts and more on my StockTwits feed and on chartly.)

Gold Daily, $GC_F
gold d2 stocks
Gold Weekly, $GC_F
gold w3 stocks
Gold spent the week building a bull flag between 1580 and 1600. On the daily chart it has positive reinforcement for more upside from the Relative Strength Index (RSI) and the rising Simple Moving Averages (SMA). But the diverging Moving Average Divergence Convergence (MACD) waning has led to consolidation. On the weekly chart the bull case for Gold remains very strong. The RSI is high and the MACD has crossed positive to join the upward sloping SMA’s. look for Gold to continue higher next week with short term targets in the 1640-1665 area and with any pullback limited to 1560 area.

West Texas Intermediate Crude Daily, $CL_F
oil d2 e1311380127838 stocks
West Texas Intermediate Crude Weekly, $CL_F
oil w5 e1311380154650 stocks
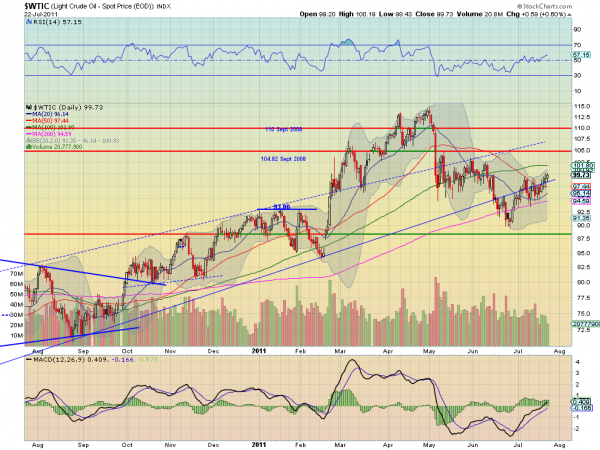
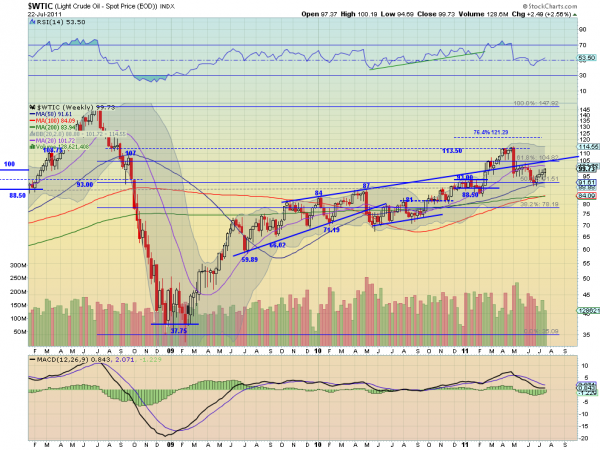
Crude Oil continued to move higher along the extension of the trendline support from 2010. The RSI is trending higher and the MACD on the daily chart shows a slow drift higher. both supporting more upside. The weekly chart also has a bullish bias to it with a rising RSI and a MACD that is improving toward zero. Look for more drift to the upside next week with a move above 100 seeing resistance at 104.82. Any pullback should find support by 93.

US Dollar Index Daily, $DX_F
usd d3 e1311380186844 stocks
US Dollar Index Weekly, $DX_F

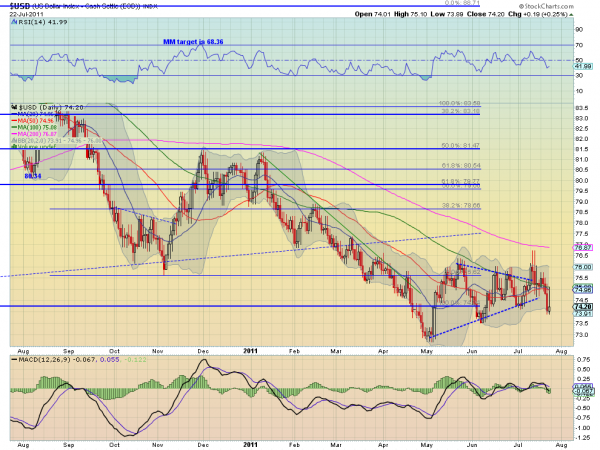
The US Dollar Index fell out of the apex of the symmetrical triangle on the daily chart and tested support at 74. The RSI is sloping lower and the MACD is growing more negative on the daily chart. The weekly chart is also bearish with the RSI rolling lower and the MACD rolling lower as well. Look for more downside next week with support at 73.50 and 73 before 72 and a test of the lows at 71.50. Any move higher should find resistance at 74.80, the triangle mid point, and then 76.00.

iShares Barclays 20+ Yr Treasury Bond Fund Daily, $TLT
tlt d2 stocks
iShares Barclays 20+ Yr Treasury Bond Fund Weekly, $TLT
tlt w3 stocks
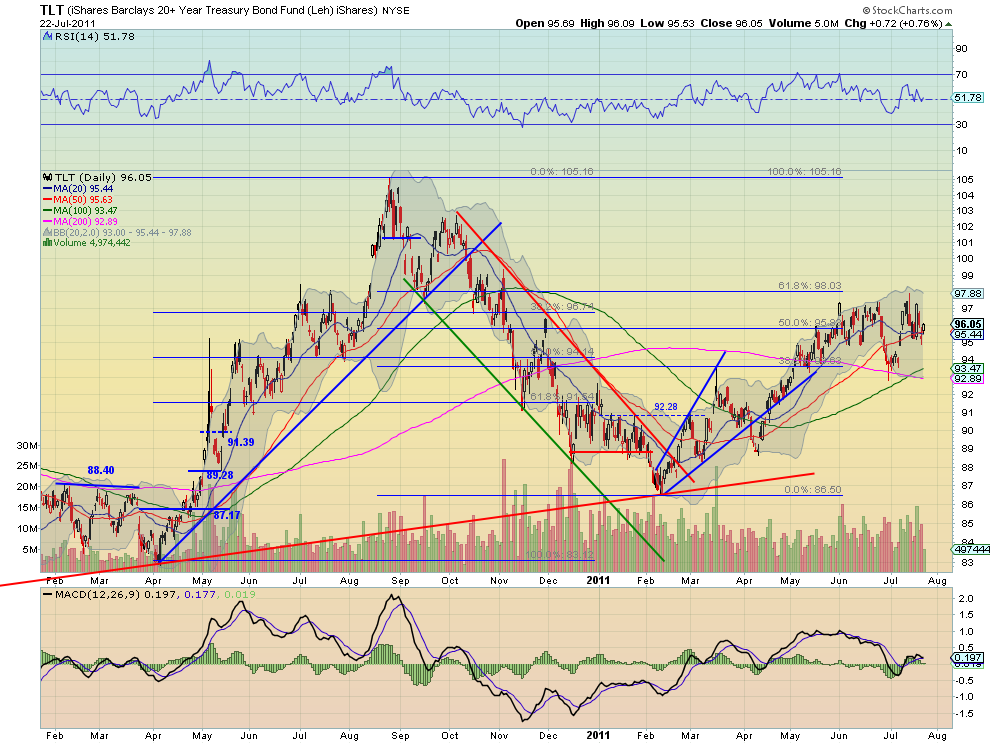
US Treasuries, measured by the TLT ETF, remained in a tight range in a consolidation zone. The daily chart shows the rejection at the top of the range and hold at 95 on top of the SMA cluster. The RSI is bouncing along the mid line and the MACD heading back to zero. The weekly chart shows that the top of the triangle center line area is big resistance at 97.30 but that the short term trend is higher. The RSI is moving back up but starting to roll and the MACD is waning. The majority of the indicators suggest that next week will be lower for bonds within the uptrend if they break consolidation. Look for support to come at 95 and then 93, while a move above 97.30 would change the forecast to higher with a target of a touch of the top rail at 102.50.

Shanghai Stock Exchange Composite Daily, $SSEC
ssec d2 stocks
Shanghai Stock Exchange Composite Weekly, $SSEC
ssec w2 stocks
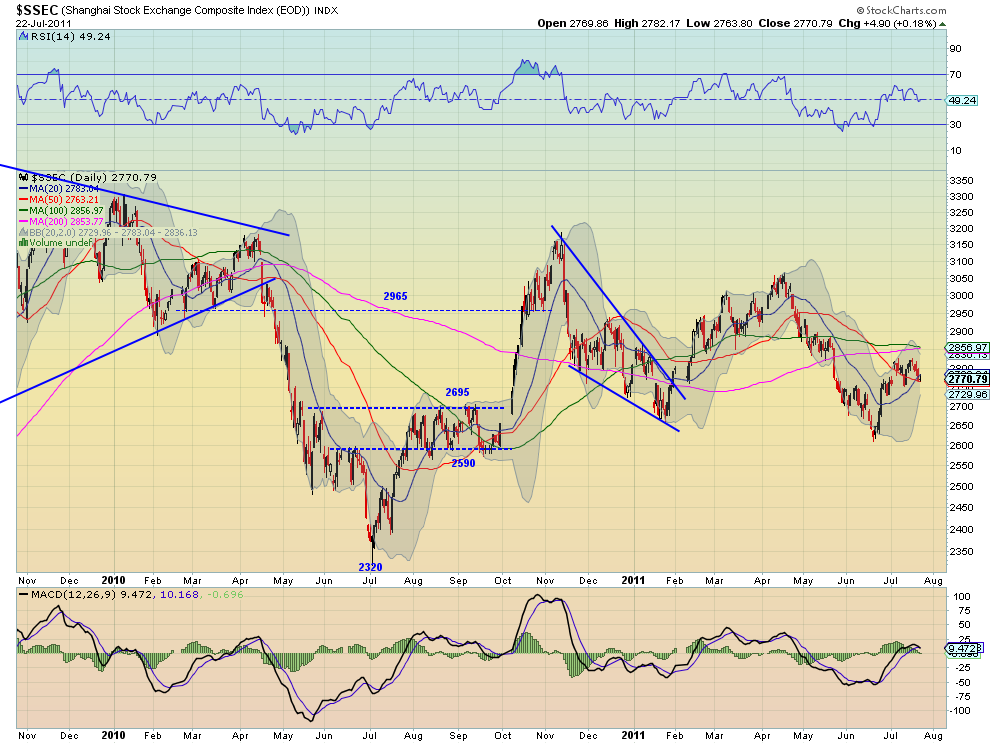
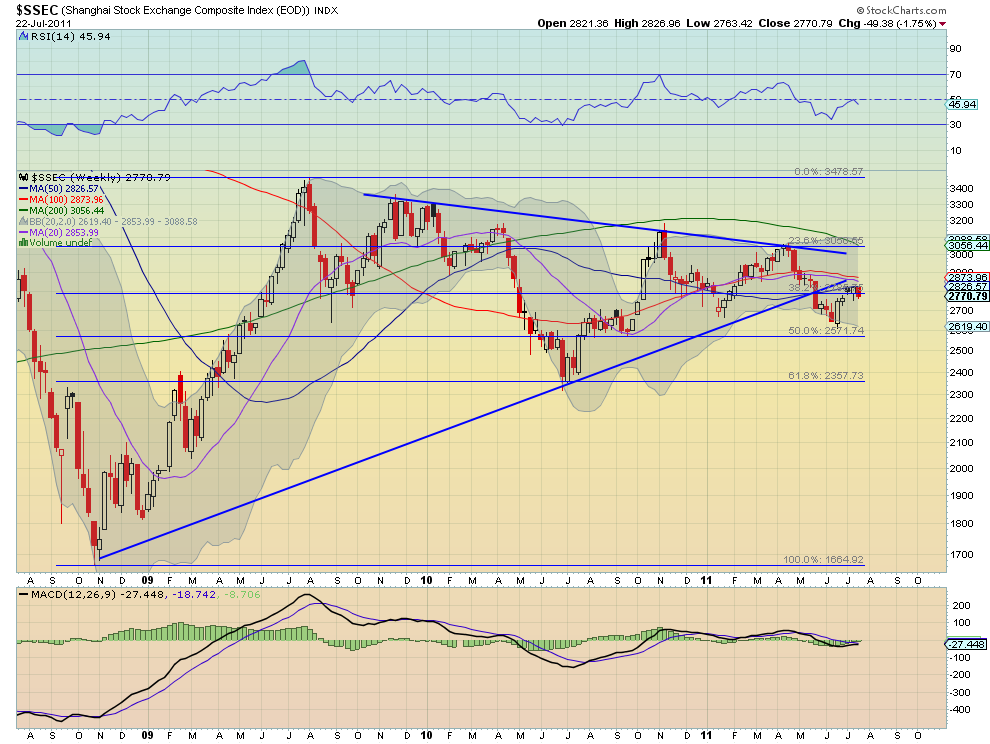
The Shanghai Composite continued in the range between 2750 and 2850 during the past week. The daily chart has a RSI that is falling but holding the mid line which has been support while the MACD is crossing negative. Also note that the Bollinger bands are starting to tighten. The weekly chart shows that the 38.2% Fibonacci level at 2785 is still playing a leading role, just below the weekly SMA’s. The MACD may be heading to a positive cross but from a shallow level while the RSI is rejecting lower off of the mid line. Next week looks like more of a mixed bag with a consolidation range. Any rise looks to meet resistance at 2800 and then 2900 and any drop to find support in the 2695-2700 area.

iShares MSCI Emerging Markets Index Daily, $EEM
eem d2 stocks
iShares MSCI Emerging Markets Index Weekly, $EEM
eem w3 stocks
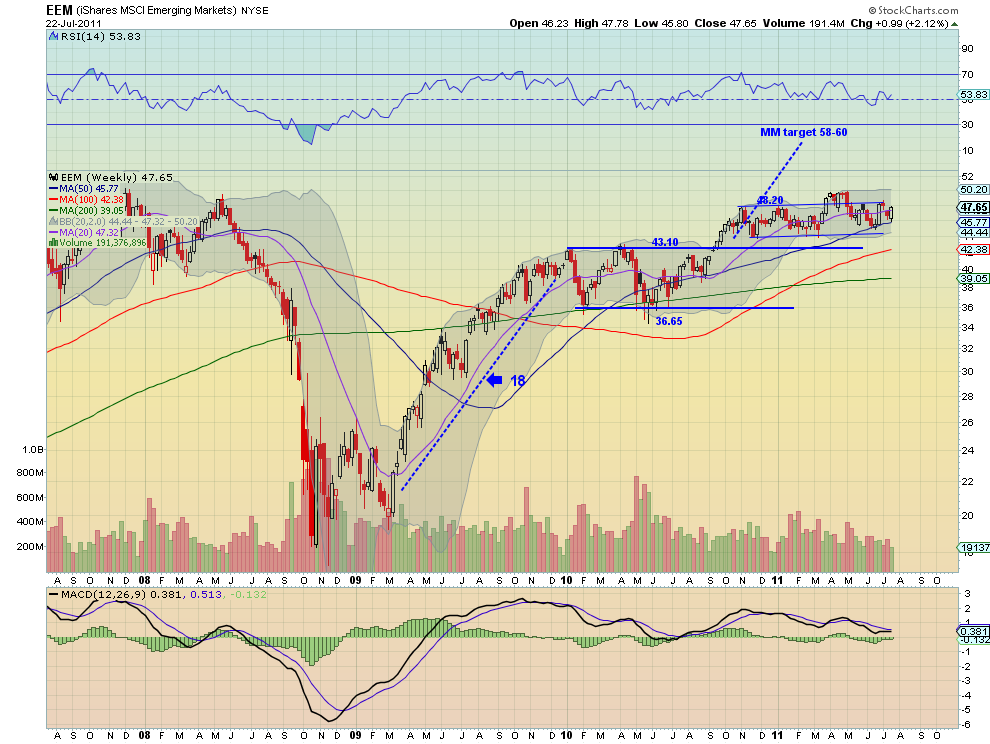
Emerging Markets, measured by the ETF EEM, moved higher off of support with in a tight range. The daily chart shows the move up began off of a Hammer candle and finished the week with a Hanging Man. It has positive reinforcement from a RSI that is trending higher and MACD that is crossed positive. On the weekly chart the consolidation can be seen more clearly between 44.20 and 48.20. The MACD is meandering and the RSI bouncing but not getting far from the mid line. Look for continued consolidation within the broad range in the coming week with a possible test of the top of the range based on the short term bullishness in the daily chart.

VIX Daily, $VIX
vix d2 stocks
VIX Weekly, $VIX
vix w3 stocks
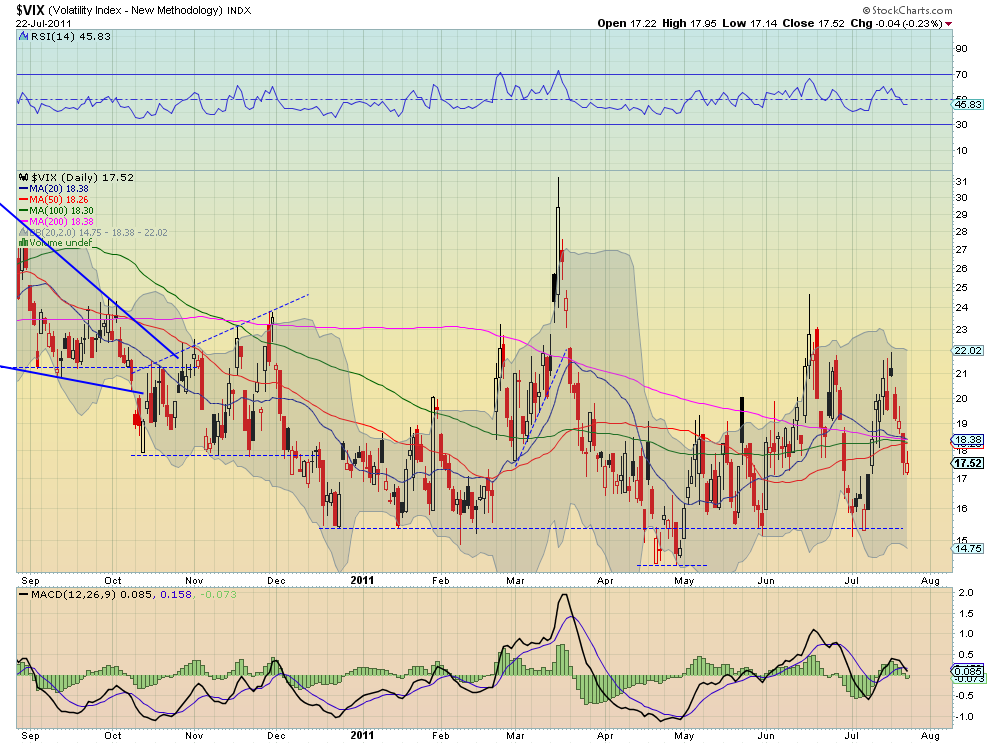
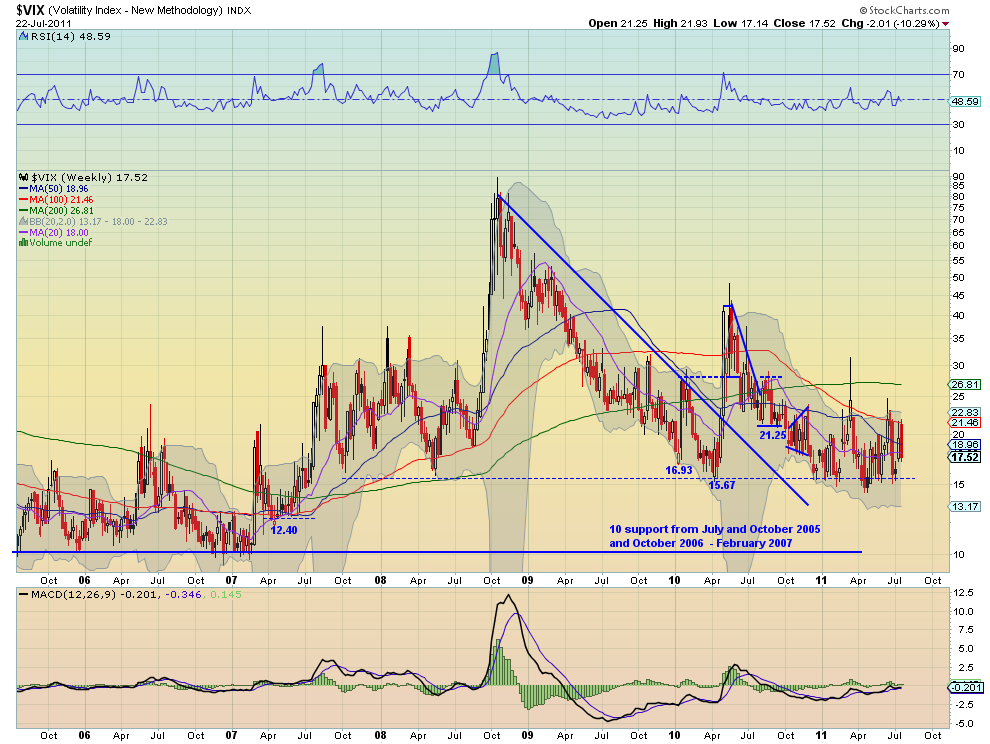
The Volatility Index met resistance at the 21.25 level and fell throughout the week. The daily chart shows the RSI heading lower and the MACD crossing down, suggesting more downside. The weekly chart shows the falling SMA’s played a role at resistance and the RSI still hovering near the mid line. The MACD is flat as well. Look for Volatility to remain low and in a range between 15.50 and 22 with the possibility of an upside surprise reaching as far as 24.

SPY Daily, $SPY
spy d5 stocks
SPY Weekly, $SPY
spy w4 stocks
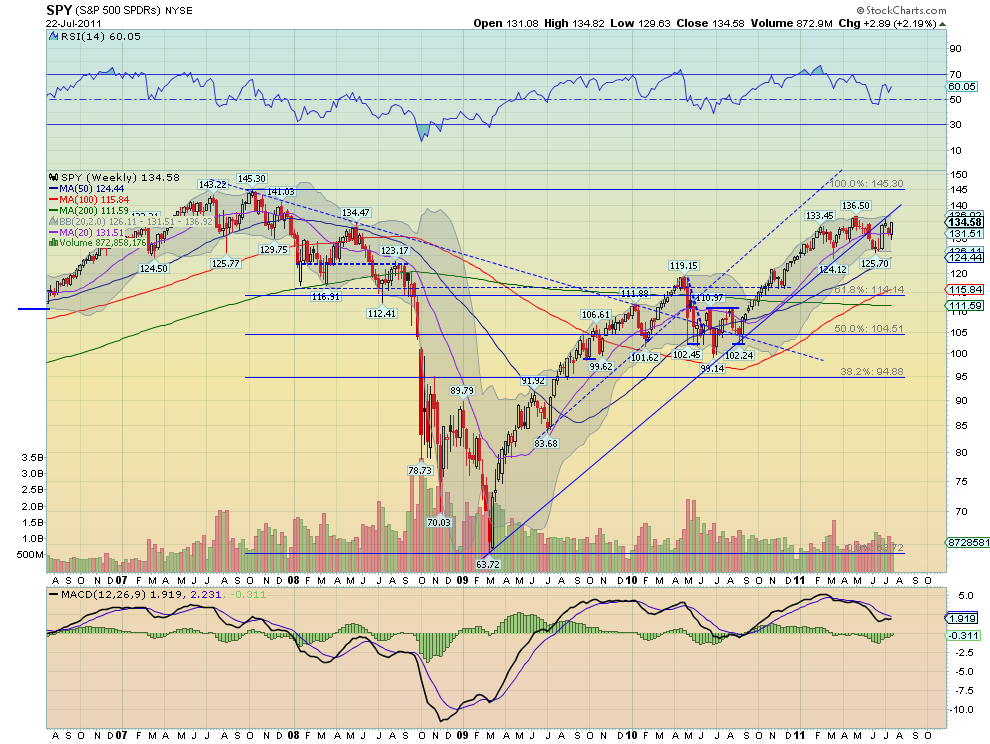
The SPY found a bottom Monday printing a Hammer reversal candle near the previous downtrend support and then rising through the week, finishing with a Hanging Man. It is over long term support/resistance at 134.12 and with a MACD that is increasing and a RSI that is slowly moving up, looks positive. The weekly chart shows that it bounced off of the 20 week SMA and is now approaching resistance. The RSI is trending higher and the MACD is about to cross up. Look for next week to be biased to the upside with resistance higher at 135.60 followed by 136.50 and then 141. Any pullback should find support at the 134.12 or 131.46 levels. A hold and move higher above 136.50 would signal an end to consolidation and a trend change to higher.

IWM Daily, $IWM
iwm d4 e1311383554662 stocks
IWM Weekly, $IWM
iwm w2 stocks
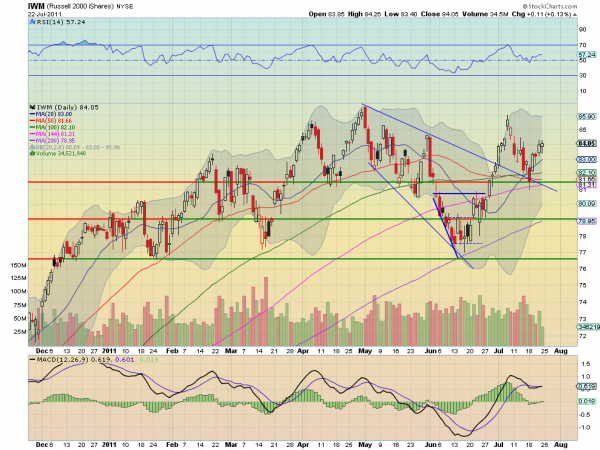
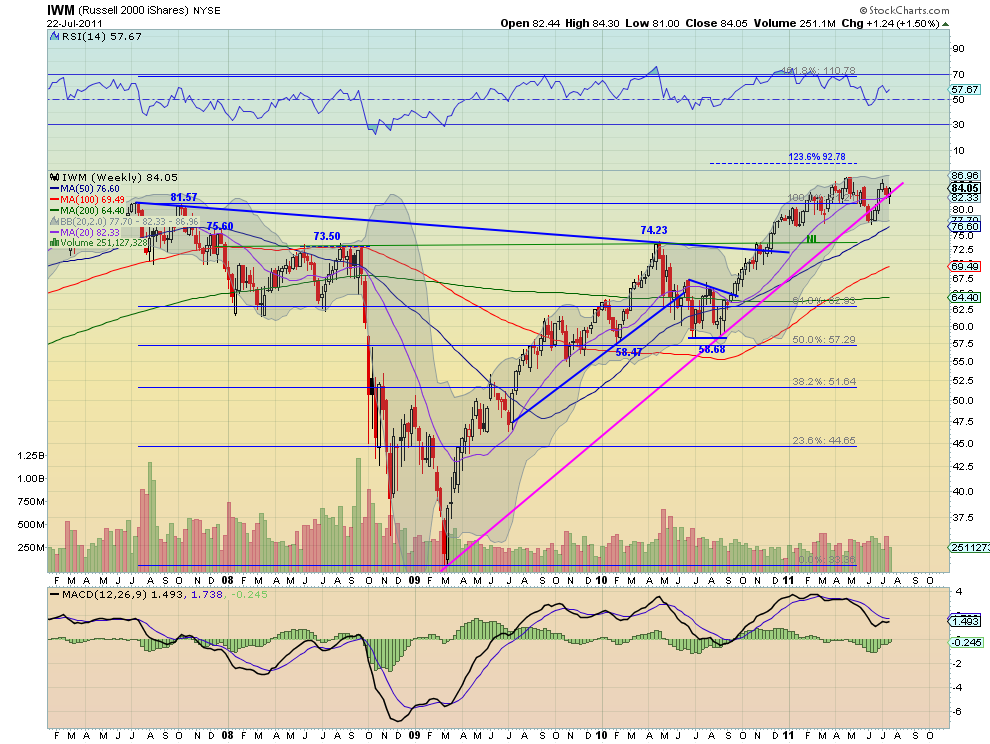
The IWM also found a bottom Monday reversing near the previous downtrend support and then rising through the week, finishing with a Hanging Man. It is over long term support/resistance at 81.57 and with a MACD that has crossed up and is increasing, and a RSI that is slowly moving up, looks positive. The weekly chart shows that it is now approaching resistance. The RSI is trending higher and the MACD may be about to cross up. Look for next week to be biased to the upside with resistance higher at 85 followed by 86 and then 86.55. Any pullback should find support at the 81.57 or 79.10 levels. A hold and move higher above 86.55 would signal an end to consolidation and a trend change to higher.

QQQ Daily, $QQQ
q d1 stocks
QQQ Weekly, $QQQ
q w3 stocks
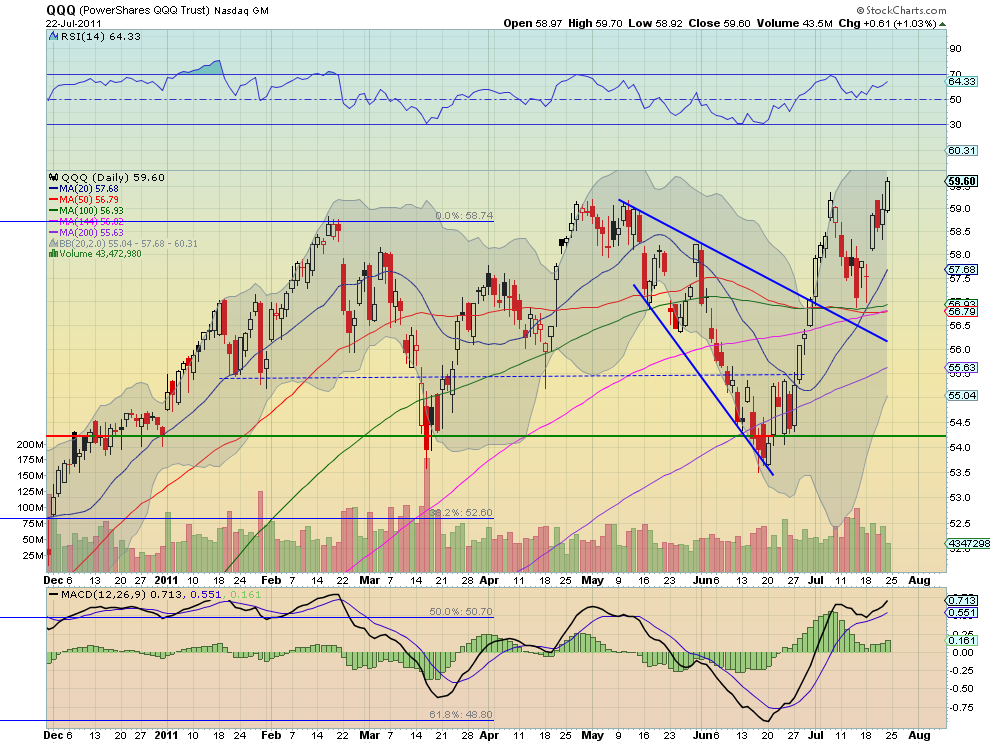
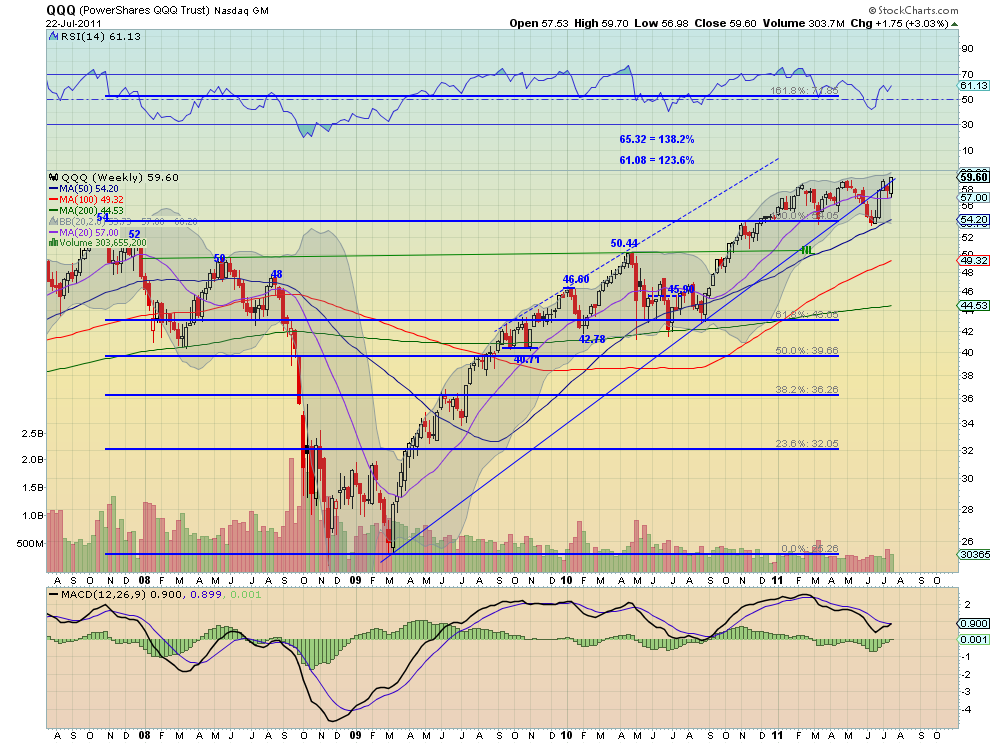
The QQQ found a bottom Monday printing a long legged doji reversal candle near the confluence of the SMA’s and then rising through the week, finishing with a strong move higher Friday. It has a MACD that is increasing and a RSI that is slowly moving up, the strongest of the three indexes on the daily timeframe. The weekly chart shows that it is breaking resistance. The RSI is trending higher and the MACD is about to cross up. Look for next week to be biased to the upside with targets higher at 60 followed by 61.08 and then 65.32. Any pullback should find support at the 57 or 54.26 levels. A continued move higher above 60 would signal an end to consolidation and a trend change to higher.

Next week looks for the move higher in Gold and Crude Oil to continue. The US Dollar Index and US Treasuries conversely are set up to move lower, with a chance of Treasuries just running in place. The Shanghai Composite and Emerging Markets look as though they may test the top of their consolidation ranges. Volatility appears to remain muted and allow for the Equity Indexes SPY IWM and QQQ to continue to test higher and perhaps break their consolidation ranges, with the QQQ already making a new high. Use this information to understand the major trend and how it may be influenced as you prepare for the coming week ahead. Trade’m well.

Stock Market Whipsaws Continue


The markets continued with the whipsaw and wild swings that traders have being seeing for a number of weeks now, which are offering some great opportunities in all markets, be it equities, forex and commodities.


We are living in historic times with European nations that are on the brink of collapse and even the US is potentially looking at a default or a downgrade, should a deal not be on the table before the deadline of August 2nd 2011.

That aside, I have a feeling with have seen this movie before and the price action sure reminds me of 2008, with these crazy wild swings from nowhere on some rumors, kind of reminds me of those MBIA and AMBAC deals that were imminent, and around the corner, everyone remember those? regular as clock work on a Friday afternoon. They were famous for starting a short squeeze, which eventually came right back off.


Today we live in interesting times, 10 years ago you would never have dreamt of being so close to a technical default from the US, yet here we are with a real possibility, such is the bizzaro world we live in today.


That aside, the majority of the public, simply has not got a clue what's really occurring, if you talk the man on the street, he generally is only interested in where his next pay check is coming from, but rest assured, I think the markets are going to see some serious moves over the coming months, and feel that we are entering into a period like 2007-2008 again. We look forward to trading those moves, I think we got some great opportunities coming up, far far better than what we have seen already.


SPX
Last week, I left readers with an idea of a potential idea of a low in place, but we needed to hold last Fridays low, well that idea was blown out of the water, as we wanted a gap up on Monday, not a gap down, so we had to move to plan B and move to the target zone of 1290-1300SPX.


Members were aware of this target, it started off as my original target, but with a clear idea at last Fridays close, there was a good chance of a low in place, well as the market gapped down on Monday, we knew then to start looking for a low in the 1290-1300SPX region.


The low came in at 1296SPX, I also had a lower target of towards the 1280SPX, but overall I still felt the markets were trying to carve a low, simply based on the wave structure and not calling for a crash as some bears were for the umpteenth time, I guess when you call a crash at every given moment, then eventually you will be right.


A skilled Elliottician can with some confidence look at a chart and based on his/her skill and willingness to accept what price is suggesting and not some hardened bias, predict with some confidence the markets next likely move, and able to come up with control risk parameters, sadly I still see those perma bears (some even alleged to be the best in the business) still force labeling 3 wave corrective moves as impulsive 5 wave moves just to curve fit to a bias, generally when you "curve fit" wave structure to your bias, it 95% of time it proves you wrong. As has been the case for those bearish Elliottcians calling for the 3rd wave crash at every given moment because it corrects 50 points, the latest one being from the May 2011 highs. When you curve fit an obvious 3 wave move to become 5 wave move, imo you are asking for trouble trying to force a bearish bias on an obvious bullish tape, the trader and technician that is willing to adjust to the market and have a good feel for the gyrations, will come out on top.


If you are following such a service, have you not had enough with the poor service? are you not at a stage where you want to follow someone who actually knows how to count properly and willing to accept and switch ideas as price dictates, i.e. do their best to offer you a service that keeps you on the right side of the tape, and actually coming up with ideas to help you make $$$ in a multiple number of markets, even going so far as to suggesting not to trade a particular market or look elsewhere for a better opportunity, not trying to massage his ego with some wave count that is calling for the death of society as we know it.


Are you not fed up with so called experts forcing a wave count to fit their bearish bias, and cling on to ideas, even thought price is telling them that their ideas have been wrong for the umpteenth time.


If so I strongly suggest checking us out, you have nothing to lose my taking us up on the 4 week free trial offer.


My calls for a bullish move higher, have been met with some hostility, I guess being a lonely bull in this environment is not part of the "Ellioticians Clique", but I have gone it alone before and against the "so called experts" and will do again, as I am humble enough to acknowledge what price "is" likely suggesting against what it's "not" suggesting, that's the key to everything, understanding and making a judgment call based on what is happening against what is not happening and accepting that at times you can be wrong in your ideas.

So where are where likely going from here?


Well having hit our 1290-1300SPX target the market made a great start, but I made it known to members that we needed to get above 1310ES to be sure, as I not a fan of trying to catch tops or bottoms unless I can control risk with patterns like an ending diagonal (ED).


Tuesday resolved the issue and gapped over 1310ES and confirmed what I originally thought that a low was likely at hand.


You simply can't trade that sort of information from a newsletter, you have to adjust to the market in real time, that's why we have a chat room, and copy our transcripts for members in a daily forum, so even members that are working or don't have much time, and don't have access to the chat room, are keep up to date on a regular basis, having a newsletter update you "after" the move is as worth less as a chocolate teapot.


At WPT, we adjust as the markets adjust, members stay on top of patterns and ideas as the markets move, so it can work both ways, as it can limit risk if the idea is wrong and also we can try come up with ideas quickly, and not wait until after the idea has already finished, or stay flat (i.e. no trade) if we can't come up with a decent idea, if the market is choppy etc.


We think this adds superior value to most other services, in this sort of market, you need to be continuously on the ball with your analysis, and it's important that members of any service have complete access to ideas and up to date information, it's no good being charged a premium rate a minute to speak to someone about an idea, when you need to get in touch of the author quickly.


That's where we differ, as we trade and adjust as the market adjusts, so you get to stay on top of the markets, not wait 24 hrs or 48hrs till the next update.


My bullish call of new yearly highs is still on track and the market has not negated those ideas, the past few months has been in a sideways pattern and likely suggesting a move higher is near to happening if not already started. Those traders that have embraced the bullish side have made some terrific gains in these markets. Although I still get emails from time to me asking me when I will become bearish and what's my targets are etc, I guess some traders are trying to get the "inside scoop" on selling these markets. Those answers are for members.


When the time is right we at WPT will become very aggressive on the short side to sell these markets, most likely when almost no one thinks this market can reverse and push lower, just the complete opposite as the lows near 1260SPX when the bears were calling for 3rd wave Armageddon wave counts and figures of 1000SPX.


I regularly see traders now accepting that we are likely going higher towards 1400SPX, it only took 80 points ;-) so now traders are eager to become bulls again, yet most times traders tend to buy into a move after 90% of the move is near over, and I don't think this time will be any different, it's always the same, most are bearish at the lows, and bullish at the highs.


So I suspect seeing new yearly highs will have most traders and the public at large calling for far higher. Maybe just the wrong time to be getting long, but we will deal with whatever comes along, until prices negate my bullish ideas, then those ideas are still on the table.


As you can see it hit a perfect 61.8% retracement, if Leonardo were alive today, I am sure he would be proud of the markets.


I showed this chart in last week's article, and starting to look really good, and whilst no one can be ever sure on an outcome, seeing that new high would further convince me that we were likely in a topping phase if we again, to put in the correct number of gyrations to confirm a completed pattern, and with a lower peak in the RSI, long term it looks like the previous analogue I mentioned last week.


Whilst I have not been seduced with the Armageddon call to DOW 1000, I do have a potential wave idea on a yearly scale that could most defiantly see a test of the March 2009 lows again.


The RSI 50 mark was tested early last week, but once again the market has trapped the bears, and as long as price is above the 50 mark, the trend is still bullish.


The chart above is one of the reasons I actually am not calling for some super bullish wave count to 2000SPX etc, as the chart suggests atm, that we appear to be following the same sort of analogue, and in my view price action simply don't support a 3rd wave to the upside, so I guess I am going it alone against both the perma bears and perma bulls.


Seeing that new yearly high, would at least complete a pattern on an idea I have been following for a few months now and seeing a completed ABC count from the March 2009 lows, and thus could also be ending an alt idea to the super bearish wave counts the bears offer, whilst we could see a test of the March 2009 lows again, it's not likely to see extreme prices such as those being suggested by the Armageddon wave counts.


Still as I have mentioned before, these wave counts are generally not something I focus too much on, because as we have seen, it can take years before you can be wrong. We at WPT tend to stick to short term price charts on 15 and 60 min charts, that's where the real action is, I will leave the macro picture wave counts to the newsletters, as they don't really play a part in my game plan. But I thought I would whet the appetite of any bear still clinging on to seeing far lower.


As long as we remain on the correct side of the trend, that's really all I am interested in, the rest in general is for the magazines you sit and read whilst on the toilet.


DOW
Using the same idea, it appears so far to be a 3 wave advance from the March lows 2009, the most important piece of information is what the RSI is doing, as if we were to see an explosive move to the upside, I would expect the RSI to confirm such a move by breaking the trend line which is resistance.


Whilst there is a target band higher, it can only be fined tuned as price structure dictates, and that comes from the 15 and 60min charts, which is what we specialize in.


NDX
Looking at a longer term view, here is one idea of a ABC advance and the 1x1 target where C would equal A, and is looking very near to being completed, again we would need to see new yearly highs on the other markets in sync, to lift the NDX to hit its measured move target, so something to watch over the coming weeks, if the SPX and DOW lift high to their respective targets.


Looking at the RSI this sure looks like it's on its last legs and agrees with the chart I posted above regarding the previous analogue with 3 peaks.


If this was the start of some super bull market I would be expecting the RSI to confirm the idea.


EUR/USD
One market that appears to be generating interest is the EUR/USD pair, with the crisis potentially escalating in Europe; I think traders are puzzled to why the EUR/USD is moving higher.


Maybe it's simply that traders just want to buy the EUR against the US$? Have traders ever thought it could be that simple?


This is simply one of the reasons I let price do the talking, as I am simply not interested in what comes out of the mouths of politicians or governments, as that just causes confusion, traders dictate where price goes, and that comes from buying and selling.


Buying and selling leaves a path, and we can use that path the market markets to help predict a potential path.


With the damage done to the US$ ala DX, the ending diagonal (ED) has now come to the forefront as our best working idea, the choppy range a week ago, never really gave much clarity, but the huge upside move in the EUR/USD pair this week, put this idea to the head of the class, and now has become the favorite idea and a 150-152 target is what we think is going to happen going forward.


Like all ideas, there is a cut of point where the idea gets negated, but having aggressively pushed through 142 and the 143-14320, we tend to favor the upside and seeing the 150-152 target band, that would also suggest seeing equities push higher as well thus seeing new lows on the DX towards 72, until this pair negates this ED idea, it's our main wave count going forward, and if we did see the 150-152 target, we feel it could offer one of the "trades of the year" , although we have had many trades of the year already ;-)


Come join us and take part in some of these huge moves in the FX markets, this is just a taster of some of the FX crosses we follow, we have so many FX crosses that we follow and setting up trade after trade, week after week, let alone what we follow in commodities and European and US stock markets.


Most traders should be aware that the US$ pushing lower is called "risk on" as the US$ pukes lower traders are buying assets, be it commodities, stocks, or higher yield currencies like the AUD$ etc


If you noticed the AUD/USD pair also moved in tandem with the large move in the EUR/USD and DX this week, thus confirming the moves in stocks and "risk" markets across the board.

SPX VS USD/CAD  
USD/CAD as usual pukes lower when "risk" gets bought, as it's just one pair I like to use as a barometer to help predict where stocks are likely going, as seen in this chart, I have showed this before, but if you're not following the little edges the market is giving you, then you are making your job far harder than it need be, this is just one of many that I look at and base a theme on what is likely happening to markets going forward.


By monitoring and watching the AUD/USD and USD/CAD pairs, it has allowed us to stay on the right side of these moves you are witnessing, when pairs such as AUD/USD and USD/CAD are not confirming the bearish outlook on stocks, it simply seems ridiculous to even begin to think of crashes when other markets are not confirming the move.


I have a long term idea on both AUD/USD USD/CAD , that if correct, should setup further upside for stocks, as both those pairs are leading FX currencies that help confirm risk on/off etc.

Conclusion
Markets have did what I thought they would and nothing really to detract from my call of higher prices, although things can happen, and negate that idea, until such time that the market proves otherwise, then I suspect we are going to see new yearly highs and complete some long term ideas I have in some FX and equity markets both in the US and Europe.


I think we are now entering a time of increased volatility and the traders that get to grip with this sort of price action and stay on top of the moves are the ones that will come out with the substantial gains.

Investor Sentiment: Remember This


Investor sentiment remains without change week over week. One would think that the markets are being held captive to the news flow coming out of Washington, but let’s remember this: nothing will be done to roil the markets. Even the great one, our President, said this: “I think it’s very important that the leadership understands that Wall Street will be opening on Monday, and we better have some answers during the course of the next several days.” It is my belief that the day to day uncertainty is actually equity positive yet meaningless because in the end, a deal will get done. Buyers are buying on the obvious. The debt ceiling will be raised. Nothing will be done to throttle the one bright spot of our economy — a rising equity market. How will the market respond once the deal is done? Will this be a sell the news reaction? Hard to know, but one thing is for certain: the deal will likely fall far short on substance when it comes to fixing the real issues facing the country.

The “Dumb Money” indicator (see figure 1) looks for extremes in the data from 4 different groups of investors who historically have been wrong on the market: 1) Investors Intelligence; 2) MarketVane; 3) American Association of Individual Investors; and 4) the put call ratio. This indicator is neutral.

Figure 1. “Dumb Money”/ weekly
Figure 2 is a weekly chart of the SP500 with the InsiderScore “entire market” value in the lower panel. From the InsiderScore weekly report: “Sentiment across the market is neutral heading into earnings season as transactional volume last week was not just seasonally low, but historically low as well. For our 391-week tracking period (dating to January 1, 2004), the number of buyers was the third-lowest on record and the number of sellers was the sixth-lowest on record. The result was the lowest number of non-options, non-10b5-1 transactions in any given week during our tracking period; and, sentiment readings across all tracking groups – sectors and indices – coming in neutral (Ed. Note: This particular week is always the slowest of the year). This sets up nicely to get post-earnings tells as the volume of trades will increase week-over-week going forward.”

Figure 2. InsiderScore “Entire Market” value/ weekly
Figure 3 is a weekly chart of the SP500. The indicator in the lower panel measures all the assets in the Rydex bullish oriented equity funds divided by the sum of assets in the bullish oriented equity funds plus the assets in the bearish oriented equity funds. When the indicatoris green, the value is low and there is fear in the market; this is where market bottoms are forged. When the indicator is red, there is complacency in the market. There are too many bulls and this is when market advances stall.
Currently, the value of the indicator is 65.42%. Values less than 50% are associated with market bottoms. Values greater than 58% are associated with market tops.
Figure 3. Rydex Total Bull v. Total Bear/ weekly


What Happened To The 9-Month Market Cycle?


The 9-month cycle in the stock market used to be a very regular and important factor governing stock price movements. But recent changes in the rules and structures of the markets may have made this cycle go the way of Saturday trading and paper stock certificates. Or perhaps it has just changed itself into a new form. Let's take a look.
My lead chart this week highlights what I am talking about. Before 2007, there were important bottoms about every 185 trading days. Cycles analysts for years have called this the "9-month cycle", or the "40-week cycle", even though the precise period was a little bit shorter than those numbers. Big round numbers are easier to say, which is why those names were used.
chart
In addition to the major cycle lows every 185 trading days, there was also a significant mid-cycle low that would appear somewhere in between the major bottoms. The mid-cycle low was usually not as punctual, and could arrive early or late, even as the major cycle low would tend to be more on time. This mid-cycle low was a "harmonic" of the frequency of the major cycle low, meaning that they were even multiples of each other. Harmonic frequencies are a big deal for mechanical engineers dealing with solid structures, but they also show up in other arenas like the stock market.
Starting in 2007, this all changed, as delineated by the red vertical line. It was hard to understand this change as it was occurring at the time, but easier to see now that we have the luxury of looking back at the historical data. What appears to have happened beginning in 2007 was that the length of this cycle contracted dramatically, for both the major cycle and the mid-cycle periods.
One of the reasons why it was so difficult to understand this change in period as it was occurring in real time is because of another trait of this cycle, which is known as a "phase shift". In my historical research, I have identified the 9-month cycle as working on the stock market all the way back into the 1960s, although curiously not so much before then. One of the more interesting behaviors of this cycle over that time period is that about every 6-8 years, the 9-month cycle would seem to skip a beat, and then start up again on some new schedule. Here is a great example of this behavior:
chart
In the lower portion of this chart, there is a modified sine wave pattern to help visualize the behavior of the cycle in the SP500's price movements. The market was following this cycle pattern very nicely up until late 2005, and then it jumped onto a new schedule that just happened to be about a half cycle length off of the original schedule.
So with the knowledge that a phase shift was a possibility with this cycle, it was hard to understand what was happening in early 2008. And this illustrates one of the big pitfalls with doing any sort of cycle analysis: cycles can change, and so while they may give us nice predictions of what should happen at some point in the future, there is no guarantee that the past behavior will remain in effect in the future.
It just so happens that 2007 was when this cycle changed, and it was also the year that the uptick rule for shorting stocks went away. It is hard to understand why a rule change like this could make a difference on a market cycle, but I have an explanation that may help.
Imagine a wave pool in a laboratory, where scientists create waves to study how they travel through the water. Now imagine that you remove all of the water, and replace it with 30-weight motor oil. Because the oil is lighter but more viscous than the water, the behavior of waves in that wave pool would understandably be different.
So thinking of the financial markets, if the regulators were to do something that changes the "viscosity of money", making it flow more or less easily, then we would likely see changes in the way that waves propagate through that medium as well. Such changes might include restrictions on shorting stocks, the advent of money market funds, the introduction of stock index futures and options, leveraged ETFs, etc. All of these affect the ease with which money can flow into and through the stock market.
Now, if you look back at the top chart, you can see that the blue numbers are getting bigger again lately. Those numbers represent the time period between the major lows of this cycle (formerly known as 9-month). The lowest number was 159 trading days in early 2008, and it has climbed back all the way up to 177 as of the latest major cycle price low. It may be that after the initial shock, this cycle is working on getting back up to is "natural" frequency. Or it may be that 159 and 177 are just the widest extremes of a new range of cycle periods that average more like 168 trading days, and that this is the new natural frequency. We won't know for sure for several more cycles' worth of time, and that's the big problem with this analytical technique.
For what it's worth, and to help your planning, 159 to 177 trading days from the most recent major cycle low equates to a timeframe of Oct. 31 to Nov. 25, 2011.

Follow Us