Tuesday, May 24, 2011

Financial Sector Continues to Struggle

by Bespoke Investment Group

The overall market is relatively flat today, but the S&P 500 Financial sector is down once again, putting it down 3.50% year to date. A sector or stock is generally thought to be in a long-term uptrend when it is trading above its 200-day moving average and a long-term downtrend when it is below its 200-day moving average. As shown in the chart below, the Financial sector has just broken below its 200-day moving average today. 


See the original article >>

When the economy reaches stall speed


If an airplane is moving too slowly, the plane is about to head down. Federal Reserve economist Jeremy Nalewaik has an interesting new paper exploring whether the same is true for the U.S. economy.

Nalewaik notes first that the 4 quarters prior to recessions were usually characterized by slower real GDP growth than is typically observed in an economic expansion.


Estimated density of real GDP growth in the 4 quarters prior to an economic downturn (dashed blue) and all other quarters characterized as economic expansion (solid red). Source: Nalewaik (2011).
stall1 economy


He then estimates Markov-switching models in which there may be an intermediate phase the economy moves into before or after an economic recession. This approach allows for a variety of possible outcomes. For example, it could capture a phase of rapid GDP growth in the first few quarters of a recovery, as proposed by Sichel (1994). However, Nalewaik usually finds evidence of a “stall” phase that the economy enters before going into a full-blown recession. For example, real GDP might be expected to grow at only a +1 to +2 percent annual growth rate per quarter while in the stall phase, before falling outright at a -1 to -2 percent rate during a recession.
Unemployment in the stall phase might be expected to increase by 0.1% per quarter, before rising at 0.6% per quarter once the recession proper begins. The graph below shows the inferred probability that the economy was in the stall phase and the recession phase as inferred from unemployment dynamics.


Probability (reported as percent out of 100) that the U.S. economy was in the stall phase at any given date (solid) and in an economic recession (dashed) as inferred from unemployment rate alone. Shaded regions correspond to NBER recession dates (not used in estimation). Source: Nalewaik (2011).
stall2 economy


The figure above represents an inference based on the full sample of data as subsequently observed. It is a trickier business to construct real-time forecasts with this approach. Slow economic growth or gradually rising unemployment sometimes is a precursor for a recession, but sometimes it’s just a temporary hiccup before more robust growth resumes. Nalewaik recommends a more detailed model for forecasting that makes use of other leading indicators such as the slope of the yield curve or housing starts.

And of course the big question right now is whether the recent sluggish growth could turn out to be part of another pre-recession stall phase. The yield curve is steeply sloping up at the moment. In normal times that would be a favorable indicator, but it’s pretty hard to interpret in the current setting with the short-term interest rate artificially stuck at zero. Housing starts are likewise of limited help at the moment since residential construction has been dead for so long.

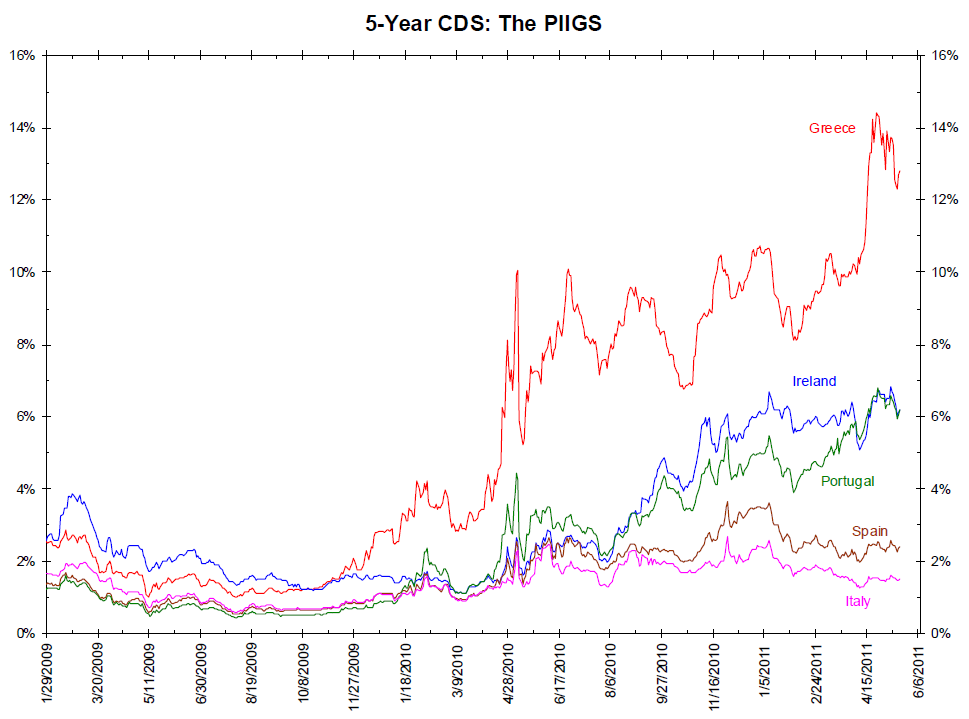
CDS: Have You Seen the Little PIIGies . . .

By Anna W

. . . crawling in the dirt, and for all the little piggies, life is getting worse ! Credit Default Swaps of the Portugal, Ireland, Italy, Greece and Spain:
>
click for larger piig chart


A Look at Volatility Index (VIX) Since QE2 Began

By Anna W

Since QE2, Volatility has been falling.

As the fascinating chart below from Ron Griess shows, the volatility of markets, post Flash Crash was drifiting lower until the modest sell off in March 2011 sent the VIX spiking.
>
click for larger chart


See the original article >>

Will the US Dollar Finally Break Its Long-Term Downtrend?

by Bespoke Investment Group

While the dollar has rallied nicely off of its lows over the past month, it hasn't done much to change global sentiment that the currency will continue to trend downward for the foreseeable future. But how does the currency look from a technical perspective? Below is a one-year chart of the US Dollar index. As shown, the index recently broke through the top of its short-term downtrend channel, but it still has a bit farther to go before breaking above its long-term downtrend channel. A few more days worth of gains and it will get there though.


See the original article >>

Seven factors that drive Chinese gold demand

by Commodity Online

China is on a gold drive and it has overtaken India as the world’s largest purchaser of gold at 90.9 million tons in gold bars and coins for Q1, 2011. This is up 123% from 40.7 tons last year for the same period. India meanwhile has purchased only 85.6 tons of gold this year.

There are seven factors that drive Chinese gold demand, according to the recent World Gold Council Report:

Culture: China has a golden culture and gold buying and gifting is an integral part of the same. When a child is born, it is customary on the part of Chinese people to gift the newborn with gold. On birthdays, people gift gold and New Year and weddings are opportunities to splurge on gold. Gold in China is considered to bring good luck and is touted as the colour of emperors.

Hedging: Y-O-Y increase of 11% in Q1 global gold consumption is attributed to investment demand, and gold being a preserver and enhancer of wealth is used as a hedge against inflationary wealth loss. The same is the case with China. Chinese view gold as an investment and a hedge against inflation.

Global uncertainty: Gold forms only 1.6% of China’s total wealth reserves. There is a possibility that People’s Bank of China (PBOC) would buy more gold, given the uncertainties prevailing in the planet. This includes the MENA (Middle East North Africa) unrest.

Investment diversification: With liquidity flowing into China, people fear that certain asset bubbles have formed especially in the real estate sector. The Chinese government is sparing no efforts in taming the scenario and maintaining normalcy. In this regard, a number of measures have been initiated by the government to curb excessive rise in property price. This has made other asset classes to have better investment appeal. Gold is one among them.

Advisory: With the dollar losing its sheen subsequent to the QE schemes, Chinese economists like Li Yining are calling for increased gold purchases and improvement in gold reserve figures. This is another factor driving up gold demand in China.

Institutional investment: Chinese institutional investors like China Investment Corporation (CIC) are allocating more money into gold. Capital preservation and not speculation drives the institutions, records World Gold Council.

Prosperity: The World Gold Council also says that with the reforms taking root in China, and economy getting accelerated, the disposable income with Chinese middle class is also going up. In a decade, the country may witness double the gold demand. 75 million households in China with an annual income of more than $4300 per annum would be here by 2015. The figure was 15 million in 2005. Household savings would also triple in the period between 2005 and 2015, statistics say.

Meanwhile the same report indicates demand destruction in gold jewellery in US. US purchased only 20.5 tons of gold which is a Y-O-Y drop of 10%. The high prices have reportedly kept Americans at bay.

See the original article >>

Bullish Fundamentals; Bearish Outside Markets


Bullish Fundamentals vs Bearish Outside Markets! The markets were quick to add additional weather premium as we opened the session Sunday night, but those premiums quickly faded as more bearish news and continued evidence of a global economic slowdown were unveiled. The question has to be when will the "fundamentals" in the Ag markets prove to be too much. When will the Ags bust free from "outside" pressures and take a leadership roll. I have to believe we are getting extremely close, as several specific contracts have been able to gain ground despite the negative influence of the outside markets. Just take a look at the July corn contract. This contract has exploded higher the past few days despite the weight of the US Dollar. You have to believe July corn would be even higher if it were not for the outsides weighing on the trade. I believe the US corn market is questioning the USDA ending stock numbers right now. The trade seems very content on building more premium into the price as many inside the industry contend that the strong domestic corn basis means that corn demand is still surging higher, and that we may actually be seeing first hand confirmation that last year’s corn crop was actually overstated by the USDA. Extremely poor grazing conditions have now placed an abnormally high amount of cattle on feed also sending into question the USDA's assumption that corn being used for feed would fall substantially during the March-August time frame. With wheat feeding no longer an option, you would have to think the USDA might be forced to rework a few numbers. You also have to figure that with July corn trading within $0.25 cents of its highs and end-users willing to pay $0.50 to $0.60 over in some areas, that $8.00 corn in fact will pencil for many of them. With that being the case you would think the July contract will try its darnedest to reach those levels. A print of $8 might also prompt a little more selling by the producers and pressure the market some short-term. Obviously, I have no crystal ball, but if you take the current flat price and add the basis premium being paid in most parts, you have to believe fair value is somewhere close by. 
 
* I would imagine soybeans may become extremely volatile these next couple of weeks as traders try and figure out if producers are going to take "preventive plant" or make the switch to more bean acres. 
 
* If rain is added to the forecast for Northern Europe or Russia you may see these grain markets set back, however I highly doubt we stay their very long considering the recent demand and surge in the both the corn and bean basis. Short-term set backs from outside market pressure and weather adjustments should be anticipated, but the overall fundamental direction for corn still seems to be much higher. Look for the "outsides" to have some bearing and effect on determining overall direction, however bullish fundamentals should eventually win out. As long as the "cash" markets continue to pace the field I feel much more comfortable about longer-term price direction. Remember, it is when the cash starts to drastically diverge from the futures that you have to start wondering about a "bubble." 
 
* Many in the trade now believe that "old crop" corn is undervalued at or below the $7.25 level, and "new crop" is undervalued at or below the $6.45 level. Thoughts are that "wheat" may be undervalued or a hypothetical floor may be in place close to the $7.50 level based on current global weather conditions. If weather issues continue a wheat run closer to $10 would not surprise me. Aggressive producers may want to consider re-owning at or below these levels mentioned above with some type of limited risk strategy. I continue to preach not buying into the rallies. Only use the rallies to buy puts if needed. 
 
* Despite the recent rally, many of the big boys are still deeply concerned that most recent US macro numbers have suggested a significant deceleration in US growth, further confirming a belief that the flow of "new" capital into the commodity markets maybe start to ease in the months ahead. There is also further confirmation that this may be happening as well in the emerging economies.

See the original article >>

Morning markets: sowings, dollar, Goldman raise crop prices

by Agrimoney.com

Asian trading hours filtered out the bad karma in markets stemming, mainly, from the eurozone debt crisis.
The steep losses in Western share markets were not repeated in Tokyo, where stocks closed up 0.2%, while Shanghai and Hong Kong shares showed only marginal losses in late deals.
And, importantly for commodity markets, the dollar edged lower, down 0.2% against a basket of currencies as of 07:30 GMT (08:30 UK time) so improving the competitiveness of dollar-denominated assets on export markets.
Add in a report from Goldman Sachs (of which more to follow on Agrimoney.com) warming back to raw materials and the stage was set for gains in many commodity markets. New York crude added 1.1% to return well above $98 a barrel, while London copper rose 1% or so.
'Low end of expectations'
Agricultural commodities had the extra boost of a weekly US crop progress report which showed farmers a little more behind in sowings even than had been expected, with 79% of corn sown, for instance, up 16 points on the week, but behind forecasts of a figure of at least 80%.
(On average, 87% of corn has been sown by now.)
For soybeans, "planting progress came in at the low end of expectations at 41% complete compared to 51% last year and five-year average", Kim Rugel at Benson Quinn Commodities said.
"Granted soybeans still have lots of time on the calendar to get in the ground, [but] the forecast across the south central and northern states were planting is the furthest behind remains wet through this week."
Indeed, at Phillip Futures, Kerr Chung Yang said: "Looking ahead, rainfall this week in the eastern US Midwest and in the South may continue to hamper corn and soybean plantings.
"This further raises the concerns about reduced acreage and yields for both crops."
Wheat's woes
For spring wheat, "seeding did pick-up to its fastest pace of the spring at 18 points this past week to 54%", Jerry Gidel at North America Risk Management Services said.
"But the two largest producing states [North Dakota] don't have half their acres planted yet and nationally 89% is usually done over the past five years."
Furthermore, winter wheat continued to deteriorate – and this despite some recent rains for hard red winter wheat crops which desperately need more.
While the proportion of the US crop in "good" or "excellent" condition stabilised at a low 32%, compared with 66% a year ago, the percentage deemed in "poor" or "very poor" condition edged one point higher to 46%. A year ago, the figure was 9%.
'Very poor weather'
Still, it was cotton which did the best in price terms, adding 2.0% to 157.00 cents a pound in New York for July and 2.3% to 122.50 cents a pound for the December lot.
"US cotton planting advanced from 42% to 57% complete last week, but this still remains slightly behind the normal seasonal pace," Luke Mathews at Commonwealth Bank of Australia said, highlighting that weather in US cotton-growing areas "remains very poor – drought in the west and floods in the east".
Furthermore, futures on the Zhengzhou exchange in China, the top consumer, grower and importer of the fibre, put in another firm performance, gaining 2.6% to 24,295 yuan a tonne for November delivery.
And cotton was, with corn, singled out in the Goldman report.
Scores on the doors
Among the big Chicago crops, soybeans led, on a near-term lot basis at least, managing a rise of 0.8% to $13.84 ¼ a bushel for July delivery, with the new crop November lot up 0.8% at $13.61 ¾ a bushel.
And wheat was not far behind, up 0.7% at $8.08 ½ a bushel for July and 0.6% to $8.55 ¾ a bushel for September.
Corn added 0.6% to $7.58 ¾ a bushel for July, with the new crop December lot spurting 0.9% to $6.76 ¾ a bushel.
China concerns
Better sentiment was also evident in Asia's commodity markets, where palm oil for August added 1.0% to 3,387 ringgit a tonne in Kuala Lumpur, while rubber gained 2.2% to 375.90 yen a kilogramme for the benchmark October contract.
But can rubber's rally last? Besides the seasonal recovery in production in top exporter Thailand, "there is also concern that China's demand has slowed in recent months, in part due to series of tightening measures by Beijing to curb inflation", Mr Ker said.
China's imports of natural rubber fell 18%, month on month, to 175,200 tonnes in April.

Goldman reverses 'sell' call on commodity futures

by Agrimoney.com

Goldman Sachs has, in a report forecasting "sustained elevated crop prices" but cutting hopes for cattle futures, reversed last month's negative call on commodities which sent raw material prices tumbling.
The investment bank, which last month cut its rating on commodities to "sell", said it was "turning more bullish", after lower prices reduced the risk of consumers cutting back on raw material demand, and of inflation being stoked to uncomfortable levels.
"With prices now more in line with near-term fundamentals and price targets, we believe that the risk/reward once again favours being long commodities," the bank said, returning to an "overweight" call on raw material investments.
Goldman lifted its forecast for Brent crude as of the end of the year to $120 a barrel, from $105 a barrel, and recommended fresh long positions in oil, copper and zinc.
'Sustained elevated crop prices'
For crops, the bank said that risks to corn and cotton, especially, were "skewed to the upside", given the threat that production setbacks, such as poor weather, pose at a time of weak inventories.
"While we expect high crop prices to generate a global supply response in 2011-12, we believe that the concurrent tightness across crop balances and our expectation for continued strong demand will limit the recovery in inventories, and points to sustained elevated crop prices," the report said.
Indeed, firm data on crop use in biofuels, livestock feed and exports showed that "demand destruction has yet to occur".
For wheat, over which Goldman has been more lukewarm on price prospects, "continued poor weather is creating risks of an even larger global deficit than we currently expect and presents upside risk to our neutral price outlook".
Corn vs soybeans
However, the bank flagged a warning over soybeans which, while remaining its preferred crop in terms of price prospects, could see its supply squeeze eased by a switch to the oilseed by US farmers giving up on corn, for which sowings have been heavily delayed by rain.
"Sustained planting delays would likely increase the upside to corn prices over the next 12 months while reducing our forecast soybean upside," the briefing said.
The bank's forecast for soybean prices were cut by $1 a bushel on three, six and 12-month time horizons from those stated two weeks ago.
'Tightened supplies'
Hopes for some cattle futures were also reduced, after Friday's data showing placements of animals on US feedlots soaring 9.9%, year on year, last month, twice the pace that traders had expected.
"This larger feedlot count points to strong supplies of live cattle through the summer and in turn lower live cattle prices," Goldman said.
Nonetheless, the bank kept a forecast that Chicago's near-term live cattle contract would stand at 120.00 cents a pound in a year's time, citing the limited supplies of further feeder cattle ready for fattening in feedlots, a factor highlighted to Agrimoney.com readers on Monday by leading analyst Steve Meyer.
"These sustained strong placements since last fall have tightened feeder [cattle] supplies significantly, pointing to lower placements in months ahead and lower fed cattle supplies by year end," Goldman said.

Il vulcano Grímsvötn

Grímsvötn Volcano Eruption
Grimsvotn Eruption
Grímsvötn Volcano Showing Plume - May 22
Grimsvotn Eruption

Volcanic Sunrise - Grímsvötn Eruption, Vatnajökull, Iceland

Scene da un altro mondo sono arrivate nelle ultime ore dall’Islanda. Il vulcano Grimsvötn ha iniziato ad eruttare lo scorso fine settimana scagliando colonne di cenere, vapore e fumo fino ad una quota di 12.000 metri. Esplora altre foto nei nostri risultati di ricerca.

Corn Market Continues to Focus on Production Prospects

Source: University of Illinois

Two weeks ago, corn prices were declining rapidly, and experts pondered the likelihood of a recovery similar to those of September 2010, November 2010 and March 2011. The answer came quickly, says University of Illinois Agricultural Economist Darrel Good.

"By May 23, July 2011 futures traded within 14¢ of the contract high, and December 2011 futures traded within 7¢ of the contract high on May 19," Good notes.

From the low on May 12 to the recent highs, July futures increased by $1, and December futures increased by 58¢. Although the larger increase was in old-crop prices, the recovery was driven by concerns about the new crop. The price behavior was an attempt to slow consumption of old-crop corn in the face of concern about new-crop supplies, he says.

"Domestic consumption of old-crop corn is likely proceeding at or above the rate projected by the USDA
Ethanol production during the first half of May occurred at a rate 4.1% above the pace in May 2010. To reach the USDA's projection of 5 billion bushels of corn used for ethanol and byproduct production during the current marketing year, ethanol production from now through August needs to exceed that of a year ago by 2.4%," he says.

The pace of domestic corn feeding is not known, but the USDA's May 20 Cattle on Feed report supported ideas that feed use continues to be large. The number of cattle in feedlots on May 1 with capacity of 1,000 or more was 7% larger than a year earlier. Placements into feedlots during April were 10% larger than placements of a year earlier and were the second largest for the month since reporting began in 1996, he says.

"The number of milk cows on farms during April was 1.2% larger than a year ago. The number of broiler-type chicks placed for meat production continues to run near the level of a year ago," he adds.

Exports of U.S. corn continue at a rate below that needed to reach the USDA projection of 1.9 billion bushels by the end of August. For the four weeks ended May 19, export inspections averaged 35.2 million bushels/week, he says.

"To reach the USDA projection, exports during the final 15 weeks of the year need to average 41.1 million bushels/week. The pace of new export sales suggest that exports can reach 1.9 billion bushels by the end of August, but the pace of shipments will need to accelerate," Good says.

In many markets, the recovery in cash prices since May 12 has been larger than the recovery in futures prices as basis levels continue to strengthen, he adds.

The average spot cash price of corn in central Illinois on May 20, for example, was 11¢ under July futures, compared to 24¢ under on the same date last year. Cash prices reached new highs in some markets, says Good, adding that basis also remains strong in export markets where demand appears to be the weakest. The average bid at Illinois River points north of Peoria on May 20 was 9¢ under July futures, equal to that of a year earlier, he says.

"The strong basis levels being experienced in many areas may reflect relatively small inventories remaining in the hands of producers. The March 1 USDA Grain Stocks report revealed that producers held a much smaller portion of the crop than in 2010. Monthly USDA estimates of average farm price received also suggest that farmers forward contracted a large portion of the 2010 crop," Good says.

See the original article >>

Breadth Divergence Between Large and Small Caps Continues to Widen

by Bespoke Investment Group

Whenever the major market indices have a big move in either direction, it often helps to look at the breadth of their underlying components in order to gauge the health of the rally or the decline. In early May when the small cap Russell 2000 hit a new high, we noted that cumulative breadth in the index had yet to hit a new high, thus not confirming the rally to new highs. Unlike the Russell 2000, breadth in the S&P 500 did hit new highs as the index itself also rallied to new highs.

In the chart below, we have updated the cumulative breadth for both the S&P 500 and Russell 2000. As shown, breadth for both indices is off of its peak levels. However, the downtrend in breadth that is forming for the Russell 2000 is considerably more well-defined than the S&P 500. Whether or not the S&P 500 follows the lead of small caps is unknown, but until the pattern for small caps changes, investors would be best served staying away.


 See the original article >>

Silver Panic Selling, Is it Possible to Have Panic Buying?

By: EWI

"Panic selling" is easy to understand and recognize: Investors rush to sell from the fear of loss. No more explanation necessary. 

On the other hand, "panic buying" is not easy to see for what it is. The phrase seems to clash with itself. People commonly assume that "buying" involves rational choices by investors, who assess risk, calculate entry points, establish stops, etc. 

None of that happens in a panic. So how can you have "panic buying"?

For starters, you have it when fear actually motivates investors to buy. 

Whereas fear of loss motivates panic selling, investors get in a buying panic when they're afraid of missing out on the profits they see everyone else making

Such as, for example, panic buying in the silver market from late January through late April of this year. Buyers drove prices from $26.40 per oz. (Jan. 28) to $49.80 (April 25), a gain of more than 80 percent in under three months.

You probably have a good idea of what followed in the first week of May: more than half those gains vanished in four trading sessions. The direction changed, but the emotion did not. Fear inflated and deflated the same bubble.

This excerpt from Elliott Wave International's free issue of Global Market Perspective depicts that panic.
The chart below shows that daily trading volume in the exchange-traded fund, the iShares Silver Trust (SLV), surged to a record 189 million shares on April 25, days prior to silver’s peak. Then, just a few days after the peak, on May 5, it reached nearly 300 million shares, another record. The first record was on buying fever, the second on a selling panic. As shown on the chart, both levels far surpass the daily trading volume in the S&P 500 SPDR (SPY), which is generally the most heavily traded fund in the world.
Through Wednesday, seven out of the past nine days have seen the daily volume in SLV outpace that of SPY. This is unprecedented behavior. “Day traders are going crazy,” says the head of trading at one brokerage firm. “Investors who felt they may have missed the boat with gold have jumped into silver because it has a better price point,” said a precious metals analyst. A Bloomberg story attributes the rise in SLV’s volume to “worries about inflation and the weakness in the U.S. Dollar.” But the real reason, in our view, is simply the same old mania story. Higher prices in silver got people more excited about the prospects of even higher prices, as they always do. The excitement hit a speculative crescendo when SLV reached a new high of 48.35 on April 28, unconfirmed by the price of the metal itself.

Bearish Outlook for Crude Oil


Last Wednesday we told subscribers that the day's upmove in WTI crude oil futures from $95 to $101 was not the start of a new upleg. We noted that the pattern exhibited on the daily chart since the May 7 at $94.63 to Wednesday's high at $100.99 resembled a bear flag formation much more than a significant bottom. It had the look of a digestion-consolidation pattern in the lower quadrant of the larger downleg from May 2's $113.97.

The analysis remains unchanged, and still argues for another downleg into the $90-$88 area next, which should also negatively impact the U.S. Oil Fund ETF (USO) as well as oil & gas names.

Only upside continuation that hurdles and sustains above 106.20 will invalidate the current "bearish" outlook.


See the original article >>

Stock Market Uptrend Still Weakening

By: Tony_Caldaro

Another choppy week that ends in the red for the third time this month. Economic reports were definitely on the negative side outnumbering positives by 9:2. On the positive side the weekly Jobless claims improved and the Monetary base rose. On the negative: the NY/Philly FED both declined, along with Housing starts, Building permits, Industrial production, Capacity utilization, Existing homes sales, the WLEI and Leading indicators. The NAHB index was flat.

Markets, worldwide, held up fairly well. The SPX/DOW lost 0.5%, and the NDX/NAZ was -1.1%. Asian markets were off 0.4%, as were the Commodity equity group. Europe dropped 0.9%, but the DJ World lost 0.5%. Bonds gained 0.2%, Gold added 1.1%, Crude was +0.1%, and the USD lost 0.2%. Next week offers the second estimate to Q1 GDP, Durable goods orders and Personal income/spending.

LONG TERM: bull market

While recent market activity leaves a lot to be desired. Long term prospects for the stock market continue to look bright. Our bull market count, from the SPX 667 Mar09 low, remains intact. We continue to anticipate a five Primary wave bull market, and two of these Primary waves have already completed. Primary wave I in Apr10 at SPX 1220 and Primary wave II in July10 at SPX 1011. Primary wave III began at that low. The first Primary wave divided into five Major waves: Major 1 in Jun09 at SPX 956, Major 2 in July09 at SPX 869, Major 3 in Jan 10 at SPX 1150, Major 4 in Feb10 at SPX 1045 and Major 5 in Apr10 at SPX 1220.
Primary wave III should also be dividing into five Major waves. Thus far, Major 1 in Feb11 at SPX 1344 and Major 2 in Mar11 at SPX 1249. Major wave 3 should be underway now. We do, however, offer an alternate count which suggests Major wave 2 is still unfolding. This count is posted on the DOW daily chart.


MEDIUM TERM: uptrend high SPX 1371

The current uptrend from the Mar11 low at SPX 1249 has been a bit choppy of late. The two significant rallies, thus far, were from SPX 1249-1339, a drop to 1295, then another rally to 1371. Since the uptrend high was hit on the first trading day in May the market has done nothing but work its way lower in a series of zigzags. The low thus far, SPX 1319, was hit on tuesday. We can count this uptrend with three possible counts. The next couple of weeks should determine the most probable outcome.


The first count is posted on the SPX hourly/daily charts. This suggests an ongoing Major wave 3 uptrend that has subdivided into, first Intermediate waves i and ii then Minor waves 1 and 2. Minor wave 3 should be underway now. Should the recent SPX 1319 hold and the market rallies to new highs this is the correct count.

The second count is posted on the DOW hourly/daily charts. This suggests the entire uptrend is an Intermediate B wave rally of Major wave 2. The decline into Mar 11 at SPX 1249 was Intermediate wave A, the rally to SPX 1371 this month was Intermediate wave B, and Intermediate wave C is currently underway. The final outcome would suggest a correction back down to around SPX 1249. Since most of the foreign indices we track are in confirmed downtrends this count is gaining in probability.


The third count we modified this weekend. This suggests the entire uptrend from SPX 1249 to 1371 was Intermediate wave i of Major wave 3, and Intermediate wave ii is currently underway. While the wave structure, at first look, appears to be three waves. We can count five waves using OEW techniques. This wave count also seems to align with some of the foreign markets we track. The final outcome under this count would suggest a correction back to around SPX 1295. Overall the weekly MACD suggests the market is in some sort of correction mode.


SHORT TERM

Support remains at the OEW 1313 and 1303 pivots, with resistance at the 1363 and 1372 pivots. The uptrend high is SPX 1371. Short term momentum has been heading lower since it nearly hit extremely overbought on thursday. The market action for the past three weeks has been quite choppy. Most of the commodities are in downtrends, the Euro is downtrending, and 9 of the 15 world indices we track are in downtrends. This is not what one would expect during an EW third of a third. It is more in line with correction activity.


In the first week of May last year, commodities dropped hard and the SPX experienced the “flash crash”. This sent the SPX into a three month, 17% correction. The first week in May this year, commodities dropped hard but the SPX has only drifted down for a 3.8% loss thus far. The wave activity, however, does again look correctional. Last year at this time the FED was completing its QE 1.0 program. This year it is completing its QE 2.0 program. The uncertainty of what lies ahead has definitely impacted the market as, just like last year, the economy is weakening again.

The short term parameters are quite clear. Last week the SPX entered the OEW 1313 range, (1319), and then rallied. The week before it entered the OEW 1363 pivot range, (1359) and then declined. A breakout above or breakdown below these pivots should determine the outcome of the current trend. Best to your trading!

FOREIGN MARKETS

Asian markets were mostly lower on the week for a net loss of 0.4%. Four of the five we track are in confirmed downtrends.

European markets were mostly lower as well for a net loss of 0.9%. Two of the five we track are in downtrends.

The Commodity equity group were also mostly lower for a net loss of 0.4%. All three of the indices we track are in downtrends.

The weakening uptrend DJ World index lost 0.5% on the week.

COMMODITIES

Bonds are uptrending and gained 0.2% on the week. 10YR rates have declined to 3.15% and the 1YR is bouncing along the bottom at 0.18%.

Crude is downtrending but gained 0.1% on the week. Crude appears to be bouncing off the recent $95 low.

Gold is still uptrending, +1.1% on the week, but needs to continue its recent rally to maintain the uptrend. Silver and Platinum are in downtrends.

The USD is close to confirming an uptrend, but lost 0.2% last week. The EUR (+0.3%) is already downtrending. The uptrending JPY lost 1.1% on the week.

See the original article >>

MARKET MINUTE – A GLOBAL SLOWDOWN?

by Cullen Roche

A little over a month ago I described the biggest risks to the market currently. It has been my position for several years now that we remain in a balance sheet recession and that growth has been largely salvaged via deficit spending and strong Chinese growth. The risks in such an environment are rather simple. Because the EMU is not helping their periphery brethren the depression on the periphery is certain to continue. It’s only a matter of time before this hurts growth in the core. Europe requires a structural fix. They’re far from achieving that.

In China, they implemented a highly flawed stimulus package (they did not have the banking crisis the USA had, yet they responded with the same medicine) and the result has been a seesaw in inflation. We’re now on the downswing as high inflation naturally causes reduced demand.

In the USA, the recovery is largely due to deficit spending as the private sector remains weak and deleveraging. Thus far we’ve managed to sidestep the global cries for austerity, however, it is beginning to look like spending cuts could come to fruition as the fear mongering over the debt ceiling gives Republicans a bargaining chip.

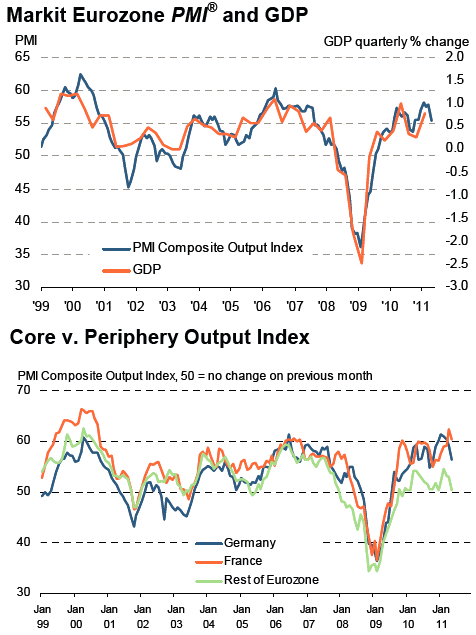
There was a huge amount of global news this morning and unfortunately for equity investors it’s all bad. We hit every corner of the globe with manufacturing news. First up, Europe, where the Flash Output Index from Markit sank to its lowest level since November 2008. Markit elaborates:
“The Markit Flash Eurozone Composite Output Index, based on around 85% of usual monthly replies, fell from 57.8 in April to 55.4 in May to signal ongoing expansion for the twenty-second successive month. However, although in line with the average seen during 2010, the increase was the weakest for seven months and the deceleration in the rate of growth, as measured by the fall in the index, was the largest since November 2008.”

The above chart is important as it shows just how weak the periphery nations are compared to the core. As regular readers know, this highlights the flaw in the single currency system. The core nations, which are trade surplus nations, are the winners in such a system as decades of trade deficits in the periphery nations inevitably led to excessive government spending. The periphery nations find themselves without a floating exchange rate to help balance trade so the situation has devolved into what we see today – several of these nations are bankrupt. Unfortunately, the situation is unsustainable. Real reform MUST happen. I have maintained for over a year now that that will involve defaults/defections and a more unified core Europe as a result. European leaders appear unable to resolve the structural flaws in the Euro so the situation is spiraling out of control. It’s only a matter of time before the citizens become increasingly upset with the depression that is being imposed on them. This situation is highly combustible and nearly impossible to predict.

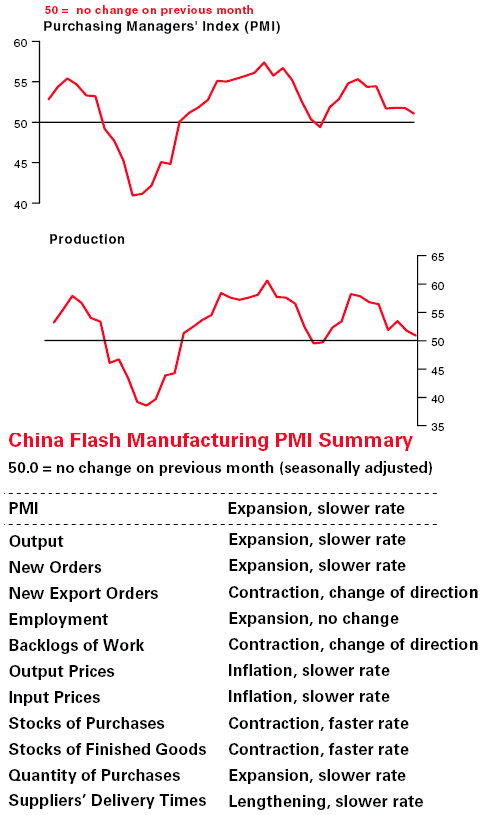
China’s Manufacturing sector appears to be slowing. The monthly flash PMI showed growth slowing to a 10 month low (via Markit):
  • Flash China Manufacturing PMI™ at 51.1 (51.8 in April). 10-month low.
  • Flash China Manufacturing Output Index at 50.9 (51.8 in April). 10-month low.

Commenting on the Flash China Manufacturing PMI survey, Hongbin Qu, Chief Economist, China & Co-Head of Asian Economic Research at HSBC said:
“The Flash manufacturing PMI eased further to 51.1 in May, the lowest level since July 2010. Manufacturers continued to reduce inventories amidst slowing new business flows, leading to slower production growth at a 10-month low. That said, we think that there is no need to worry about a hard landing because the current level of the PMI is still consistent with around 13% IP and 9% GDP growth. Policy focus is still tilted towards taming inflation. We expect Beijing’s tightening policy will continue in the coming months.”
China has been the one strong leg of the global growth story over the last 2 years. It’s my opinion that misguided domestic stimulus programs led to the current mini-boom in the Chinese economy and we’re now experiencing the inevitable downside involved in misguided government intervention as inflation has sapped demand by forcing consumers to reallocate spending. QE2 exacerbated the commodity boom via speculation. The air is now coming out of that bubble. The risk now, is that the Fed has created a highly unstable market in commodities that will result in production concerns and exacerbated economic fears.

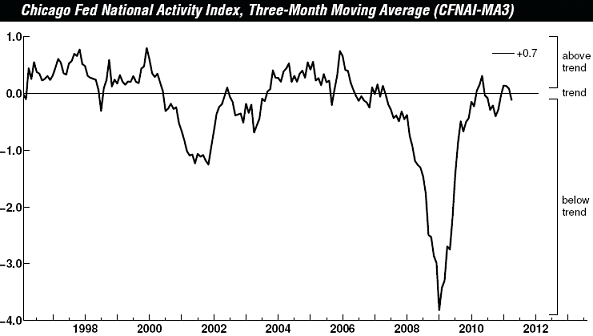
In the USA, we continue to see weakening manufacturing data. This morning’s Chicago Fed Index is consistent with several of the recent regional reports as well as the latest ISM Services data. This month’s decline was the lowest reading since August 2010:
“Led by declines in production-related indicators, the Chicago Fed National Activity Index fell to –0.45 in April from +0.32 in March. April marked the lowest reading of the index since August 2010. Three of the four broad categories of indicators that make up the index deteriorated from March, but two of those three categories made positive contributions to the index in April.”
The risks have certainly increased in recent months as the manufacturing boom appears to be softening around the globe. I believe the highly misguided QE2 program has substantially contributed to the current downturn around the globe as speculators drove many prices well beyond sustainable levels. Real GDP has slowed every quarter since the beginning of QE2. We should all hope that the Fed doesn’t respond to the current downturn with more of the same misguided medicine.

JEFF SAUT: KEEP AN EYE ON THE 50 DAY MOVING AVERAGE

by Cullen Roche

Like Richard Russell, Jeff Saut of Raymond James is keenly focused on the technical aspects of the current market environment. Saut says this is a decisive week as any break of the 50 day moving average could result in further declines:
“Two weeks ago I said, “While the intermediate/long-term internal stock market energy remains fully charged for a move higher, the market’s short-term energy still needs some time to rebuild. This probably means another week, or two, of consolidation and/or attempts to sell stocks down before we begin another leg to the upside. Even so, I don’t think any selling will gain much downside traction, implying the zone between the S&P 500’s 50-day moving average (DMA) at 1320 and the 1340 level should provide support for stocks.” Well, it’s now two weeks later and from my lips to God’s ears because the S&P 500 (SPX/1333.27) did exactly that last week when it tested its 50-DMA and proceeded to bounce above 1340, which I thought would confirm the successful test of the 1320 level. Alas, that wasn’t meant to be as once again Friday’s Fade (-10.33 SPX) left the SPX right in the middle of my 1320 – 1340 support zone. Still, the action has not negated the “call” for a move above 1400 by the end of June provided the SPX doesn’t decisively violate the 50-DMA to the downside.”
As I type, the S&P is about 8 points below its 50 day moving average. If Mr. Saut’s thesis plays out we could see a bit of a bounce at these levels, however, if the decline this week persists then it could be time to look out below.

All Major Global Equity Markets Close Below Their 50-day M.A.

By Global Macro Monitor

What a difference a trading day makes. As of Friday’s close only seven of the fourteen major global indices that we track were below their 50-day moving averages. As of today, they all are. The S&P500, Dow (just barely), Nasdaq, all three European, and the Korean Kospi broke their 50-days. The Hang Seng and Shanghai fell sharply to close below their 200-day moving averages.

Some positives were the VIX, after opening at 19.55, traded lower almost all day. The S&P500 filled the April 19-20 opening gap at 1312.70-ish and held. The BOVESPA and Mexican Bolsa were able to muster impressive bounces off their opening lows. And, finally, Apple, after probing the key support level of $327.50, closed up $5 off its low of $329.42. Given the attack of the Macro Swans and lack of upside catalysts, tough to see how we bounce big here, other than some nutcracking short covering. Let’s see what Turnaround Tuesday brings us. (click here if table is not observable)
>

See the original article >>

Follow Us