| Feels Like Forever I saw you All I know Hold me All I know I might have never met you All I know All I know |
| Feels Like Forever I saw you All I know Hold me All I know I might have never met you All I know All I know |
Capitalism gets into deep trouble when the price of financial assets becomes completely disconnected from economic reality and common sense. What ensues is rampant speculation in which financial gamblers careen from one hot money play to the next, leaving the financial system distorted and unstable—a proverbial train wreck waiting to happen.
That’s where we are now. And nowhere is this more evident than in the absurd run-up in the price of European sovereign debt since the Euro-crisis peaked in mid-2012. In that regard, perhaps Portugal is the poster-boy. It’s fiscal, financial and economic indicators are still deep in the soup, yet its government bond prices have soared in a triumphal arc skyward.
Unfortunately, the recent crashing landing of its largest conglomerate and financial group (Espirito Santo Group) is a stark remainder that its cartel-ridden, import-addicted, debt-besotted economy is not even close to being fixed. Notwithstanding the false claims of Brussels and Lisbon that it has successfully “graduated” from its EC bailout, the truth is that the risk of default embedded in its sovereign debt has not been reduced by an iota.
At the time of the 2011-2012 crisis, its central government was already sliding rapidly into a debt trap with a ratio of just under 100%. Self-evidently, the nation’s so-called EC bailout has only made its public debt burden dramatically worse. Today Portugal’s debt to GDP ratio is 129% and there is no sign of a turnaround.
 |
But that has not deterred the rambunctious speculators in peripheral sovereign debt. Since mid-2012 and Draghi’s “whatever it takes” ukase, the price of Portugal’s public debt has soared. This means that leveraged speculators—-and they are all leveraged on repo or similar forms of hypothecated borrowings—-have made a killing, harvesting triple-digit gains on the thin slice of non-borrowed capital they actually have at risk in these carry trades.
As shown below, in response to this central bank induced bond buying campaign by fast money speculators, the 10-year Portuguese government bond yield has experienced a stunning plunge from 15% to 4% during the last 24 months. Among other things, this dramatic improvement virtually overnight in its fiscal financing costs has taught Portugal’s government a dangerously false lesson. Namely, that in the face of unsustainable fiscal profligacy all its takes is a little budgetary sleight of hand and fake austerity. In fact, nearly all of its fiscal improvement is owing to the one-time sale of state assets including the airport operator and various public utilities under financial arrangement which amount to little more than off-budget borrowing.
 |
Moreover, regardless of the quality of its fiscal recovery measures, the sharp drop in its bond yield would ordinarily at least imply that Portugal has turned its chronic fiscal deficits on a dime, but that is not remotely the case, either. Portugal has been burying itself in red ink for decades and despite being down from their crisis peak of 10% of GDP in 2010-2011, government deficits are shown are still running at the historic rate of 5% of GDP and will be lucky to break below that level in 2014 or anytime soon thereafter.
Needless to say, when a country’s nominal GDP is stuck on the flat-line, it can’t add 5% of annual output to the public debt each and every year without quickly being doomed by sheer arithmetic. That baleful fiscal math, in fact, is exactly the reason its bonds sold off so sharply in the first place, and why in the absence of massive central bank distortion of bond prices, Portugal would still be under the thumb of crushing yields on its monumental public debt.
So what is at work here is the opposite of is honest price discovery of the type that occurs on a genuine free market. There is virtually no logical basis for the bond market rally in Portuguese or other European sovereign debt. As detailed below, the whole thing is a central bank driven wave of short-term speculation and inflows of hot money which can reverse as quickly as it arrived following Draghi’s ukase.
in the meanwhile, the Wall Street and London sell-side continues to promote hairline and often transient improvements as justification for the rally, which is to say, purchase of bonds and derivatives from their trading desks. In truth, the dismal facts of Portugal’s stunted economy and profligate fiscal practices have barely improved, but that does not prevent sell side ballyhoo from breaking out all over.
During recent quarters, for instance, Portugal’s real GDP has turned slightly upward, but the magnitude of improvement is laughably marginal—-certainly not remotely consistent with the massive gain in its bond prices. Thus, after three quarters of hairline gains, its real GDP in the Q2 2014 was a barely measureable 0.8% larger than the same quarter a year ago. And these rounding error gains, of course, have not yet made up a fraction of the deep shrinkage that occurred in the prior two years.
 |
Indeed, despite all the sell-side drum-beating, Portugal’s real GDP is still 6% smaller than it was on the eve of the financial crisis in 2007. In that context, the galloping bond market rally during the past two years is insensible: a slight uptick from the bottom of a deeply depressed trend is no evidence whatsoever that Portugal’s battered national economy is being sustainably rejuvenated national economy, or that its capacity to service its spiraling debts has been improved in the slightest. In short, the entire bond rally has noting to do with the fundamentals of Portugal’s fiscal and economic circumstances.
The real problem, of course, is that all sectors of the Portuguese economy buried themselves in debt during the years after it joined the EC and was able to access the cheap funding available in the euro bank and bond markets. Indeed, the explosive growth of debt was so extreme that it could be fairly labeled as a sheer financial orgy. As shown below, during the 14 years between 1996 and 2010, for example, household sector debt increased by 6X at a time when the nominal GDP grew by less than 2X. Even after some modest liquidation during the last 4 years, household debt is still 5X larger than it was in the mid-1990s, yet Portugal’s nominal GDP has actually declines since the 2010 debt peak, meaning that the household leverage ratio is now worse than ever.
The same holds for non-financial business debt, which also soared by 6X after the turn of the century. As is evident below, there has been no progress whatsoever in reducing the enormous burden on the business sector.
Toss on top of this the still rising government debt burden and the implication is obvious. During the halcyon years of Europe’s debt orgy, Portugal went whole hog attempting to borrow its way to prosperity. Now its economy is crushed by the resulting balance sheet fiasco, and shows no signs that its devastating leverage ratios have been reduced by its so-called austerity program.
indeed, what all this fantastic borrowing did was to allow Portugal to finance a wholly unsupportable national life-style by importing vastly more goods and services than it exported, and financing the difference by means of the above borrowings in the euro debt markets. During the decades leading up to it financial crisis, its current account deficit averaged between 6% and 12% of GDP—surely a dead-end trend if there ever was one.
Once again, however, the sell-side propaganda about the “turn” in Portugal’s current account is just another case of grasping at straws. In order to liquidate its towering debts, Portugal actually needs to run large trade surpluses for years to come in order to generate the means of pay down. But despite a modest uptick in exports which is inherently constrained by the faltering condition of the EC economies and the general world slowdown, it has barely made a dent in its level of imports. Stated differently, the Portuguese economy continues to live high on the hog as is its debt crisis had never really happened.

The fact is, away from Wall Street’s fatuous focus on superficial, hairline signs of recovery, Portugal’s real economy is still deep in the doldrums. Its industrial production index, for example, is down 5% from 2010 levels and 18 percent from turn of the century levels.
But the most telling indicator is its plunging labor force participation rate. As shown in the graph below, the dramatic plunge since 2000 is even more severe than the ballyhooed decline in the US figure. The reason is that Portugal’s work force has been out-migrating in droves or tumbling into its over-burdened social safety net. Like, in the US, its recent hairline gains in the unemployment rate—still above 15%—are essentially attributable to a shrinking work force.
This is the crux of the matter. With a declining level of labor input and the unavoidable need for nominal wages—which were vastly inflated during the debt boom—to shrink in absolute terms to more sustainable levels, Portugal’s national income growth rate will flat-line for years to come under the best of circumstances, and will continue to decline in the face of another European and global recession.
Accordingly, there is no relief in sight for its towering leverage ratios in all sectors—government, households and business. In these circumstances, a 4% sovereign debt yield is nothing short of absurd.
The truth of the matter is therefore quite simply. Draghi ignited a short-term buying stampede with his mid-2012 pronouncement. This caused a hot money inflow—especially from dollar based Wall Street speculators and hedge funds. It certainly helped that the latter were drowning in liquidity owing to the Fed’s $85 billion per month of QE purchases and the ready availability of essentially zero cost repo financing. Indeed, the combination of QE3 and Draghi’s “whatever it takes” amounted to a bugle call to the financial hounds.
In short order, the impact was to drive both Euro bond prices and the Euro/USD exchange rate dramatically higher. In fact, between July 2012 and spring 2014, the euro rocketed from 120 to 140 or by nearly 17 percent. Not only did the resulting combo of a rising euro and soaring peripheral bond prices result in a tsunami of hot money into the euro markets, but it also laid the planking for today’s pathetic excuse that Europe is suffering from an economic affliction that can only be solved with an even more fantastic increase in ECB monetary intervention—-even beyond the financial repression it has in place today including negative deposit rates.
But there is no structural deflation in Europe—just the short-term impact on the rate of price change owing to a spike in the exchange rate that, ironically, resulted from Draghi’s pledge that he would run the printing press at some future date at whatever speed might be necessary to “save” the euro and prop up the sovereign debt of the EC periphery.
In truth, the current “deflationary” scare will soon abate as the euro moves through the 130 mark, and dollar-based speculators are forced to sell their peripheral bonds in order to avoid losses. The trend level of euro area inflation has been, and will remain, in the order of 2.2% per annum since 2000 as shown below. Other than the short-run exchange rate effects on the rate of price change, the idea that Europe is suffering a deflationary crisis is absurd.
Accordingly, bond yields everywhere throughout the euro area are distorted beyond recognition. In a recent post, EconMatters laid this out quite explicitly. The data for all of the major European countries shown below truly describe the mother of all bond bubbles. This is central bank destruction at work on a monumental scale.
By EconMatters
How to properly value European Bonds
This seems to be the biggest question in financial markets for me right now because the math just doesn`t add up any way you slice it. When you look at the pricing for European bonds this conclusion jumps out from an analyst perspective, either European bonds were analyzed and incorrectly priced two years ago, or they are currently being analyzed and mispriced today!
Possible Explanations for Large Valuation Gap


One might say it is a little of both, the yields shouldn`t have been that high two years ago, and they shouldn`t be this low right now. However, the gap is just too large from a valuation standpoint to hold much water or relevance here. The next possible answer is that central banks have made interest rates for borrowing money so low that this has incentivized bondholders to accumulate more bonds in search of a yield vehicle to invest this ZIRPMoney.


Also, the US QE Program of $85 Billion per month, much of this money may have found its way into the European banking and financial markets further incentivizing liquidity driven asset purchases of all kinds in Europe. But remember, Europe itself has done very little besides the main weapon of ZIRP compared with the United States, and these are European bonds we are talking about. But if it just comes down to ZIRP offering enough of an incentive to buy what were perceived as risky bonds for investors just two years ago, why weren`t these yields much lower as soon as ZIRP began in Europe?
One answer might be that there was a scale issue regarding liquidity, and ultimately there was a lag effect, until liquidity reached a certain threshold, first of filling the deleveraging credit gap, then there is enough to spill over into alternative investments like chasing yield trades. However this two year period also happened to correspond with the $85 Billion QE policy in the United States, and this seems to have been some of the catalyst for ditching investments like Gold in favor of Yield Investments. There is also this ‘Binary Mentality’ in financial markets in evaluating an investment risk or trading strategy, it is ‘Risk On’ or ‘Risk Off’, ‘Yield On’ or ‘Yield Off’, or European bonds are ‘Safe’ or really ‘Risky’.
Fundamentals in Europe Haven`t Changed


However when you look at the fundamentals and compare them to 2012 things haven`t really changed that much in Europe from a ‘getting their financial house in order’ standpoint, and their economies aren’t exactly booming, so these bonds seem as risky now as they ever have been from a solvency standpoint. I realize that the higher yields feed on themselves and make Europe`s outlook worse by some metrics, and that lower yields help alleviate near-term financing concerns from an interest on debt perspective, but the moves in these European bond yields just don`t make sense on a valuation standpoint, who would buy these bonds at current prices and yields? [Moreover, lower yields may be bad because it allows the governments to put off the much needing structural reforms that are necessary for fixing Europe in the long run.] The possible answer is that banks think that they can front run central banks, beg for QE, and get the central banks to take these bonds off their books.
Read More >>> The Bond Market Explained for Mohamed El-Erian
How Big can the ECB Balance Sheet Really Get?


But remember Europe hasn`t really done any bond buying program, and it really seems like a big risk to take with your only real out being that Mario Draghi can convince policy makers to buy European bonds in any sizeable scale to make all these bonds good values here. The scale is enormous because the amount of debt that Europe needs to sustain their deficit spending weak economies that are not very competitive from a global standpoint outside of Germany is enormous each year. Furthermore, the ECB is really going to buy “all of these European bonds” from Italy to Belgium? The math doesn`t add up, just think about the Fed`s 4.5 Trillion dollar balance sheet, how big would the ECB balance sheet need to be to have any real impact in buying all these bonds from the banks that currently hold them?
What Will Germany Sign Off On?
Would Germany really sign off on this even if it was potentially possible to buy even half the bonds of these European countries? This just seems ludicrous and I hope this isn`t a real investment rationale for buying all these European bonds, that the ECB is going to take them off their hands regardless of price. The other explanation is that these bond investors think they can get out quick enough, make enough money before ZIRP and the market reverses itself, and basically dump these bonds back onto the market without getting hurt.
However, when you calculate the magnitude of how many bonds were bought all across Europe with deficit spending needed to sustain largess social governments, taking yields down from such heights just two years ago, this is a lot of bonds that will have to be dumped onto the market, what effect is this going to have regarding a tremendous spike in yields during this process?
Paper Gains on Bank`s Balance Sheets Likely to Reverse to Actual Losses Again
Remember so far these banks and financial players have gained ‘paper gains’ on their books, they of course book the yield profits, but these are small relative to the price moves in these bonds. However the bonds are still on their books and nothing has changed in Europe and in reality many of these ‘paper gains’ on the books will reverse themselves. In many cases any financial institution who bought bonds over the last year in Europe at extremely high historical prices relative to recent history and the dire fundamentals of Europe from a debt to GDP standpoint is going to incur massive losses on these bonds that make the banks themselves extremely vulnerable to collapse. Basically needing to be bailed out all over again, i.e., the collapse of the Spanish Real Estate market, and the after effects of all this bad debt on bank`s balance sheets who had exposure to the overbuilding in Spain.
The Problem with Accumulating Assets without regard to Fundamental Value means these Assets are Forever Stuck on the Bank`s Books – Nobody will buy them when they need to sell


But based just on the fact that bond investors have no real clue what any of these bonds should be priced at just in a two year period, I have no confidence that their models over a ten year time period have any validity or insight regarding valuations and sound investment decisions. It seems more likely that somebody in Europe is going to have to take huge haircuts on these bond positions, as unlike Japan Europe relies on external funding for these bonds. It seems like the likely scenario is that yields start rising slowly at first with the extinction of the massive US QE program in October by the Federal Reserve. And pick up steam as the ECB cannot deliver relative to the expectations already priced into European Bonds, and then the technicals take over fueled by the reality that Europe was never fixed. This leads to the same scenario for these bonds getting ‘re-priced’ back into the bond market that we had just two short years ago. That most of these bondholders will have to take massive haircuts on these positions, and in two to five years European bonds are back pushing the upper limits of yield once again on an increased insolvency risk profile or EU breakup entirely.
The German Bund is a Long-Term Short over 10-Year Duration
But the one thing that is certain is European bonds are not properly priced today on any scenario. There is a high probability that these bonds are completely worthless in ten years for some of these countries, the math just doesn’t work out in some of these peripheral countries. The German Bund also looks like a short at least back to 1.2% from the current 0.88 % yield for the 10-year duration as the market has really gotten ahead of itself in a slow summer, and as markets often do overshoot based upon one-sided momentum trading.
European Bonds Biggest Bubble in a World of Mispriced Assets
I would also reiterate that most of these European bonds are massive shorts, just take positions, be able to stay in these markets for ten years, and most of these bonds are going to ‘re-price’ back to the fundamentals of Europe and a sustainable risk profile. Any investor buying European bonds at these prices is going to lose money on this investment when they have to sell these same bonds in an escalating yield environment.
More Money Has Been Lost Chasing Yield the last 10 Years than any other Investment Strategy – Yet it Remains one of the most popular – so much for “Prudential Regulation” Janet Yellen as being an Effective Tool for Containing Risk to the Financial System
Remember you haven`t made money on a trade until the position is officially closed out, good luck buying European bonds in the biggest bubble of the vast universe of bubbles that currently exist in the financial universe that we find ourselves in due to incompetent Central Banks, matched only by incompetent governments who spend more than they can possibly take in regarding revenue, all cheered on by irresponsible banks who want their investment risk subsidized by others. I am a finance guy, and the math ultimately has to make sense, and it just doesn`t make any sense in Europe, and unlike the United States, the margin of error for Europe is not nearly as big to fall back on!
By John Ficenec
Nothing has been learnt from the madness of the 1929 stock market crash as once again traders reach for record amounts of debt to pile into rising share prices.
The level of margin debt that traders are using to buy shares in the stock market reached the highest levels on record, according the latest data from the New York stock exchange.
US traders borrowed $460bn from banks and financial institutions to back shares, and once cash and credit balances held in margin accounts of $278bn is subtracted this left net margin debt of $182bn in July
Traders are now more exposed to a fall in share prices than at the height of the dot-com bubble at the turn of the century, and just before the financial crisis during the 2007 peak.
 |
Source: Dshort.com
Buying shares on margin is often used by hedge fund traders to increase the returns on their investments. As the stock markets have steadily risen during the past five years and the level of risk has fallen, banks have become more willing to lend money for this activity.
The practice of buying shares on margin can trace its roots back to the heady days of the roaring 20’s stock market boom. Retail investors intoxicated by the offer of limitless gains only had to put down a small portion of their own money to buy shares.
In the 1920’s investors put down between 10pc to 20pc of their own money and therefore borrowed up to 80pc to 90pc of the cost of the investment.
The impact on returns in a rising market is startling. If for example an investor only has to put down 10pc, then with £10 he can buy £100 worth of shares. If by the end of the next day the investment has risen by 10pc to £110, when they sell the shares the returns in absolute amounts would be the original £10 plus a £10 profit, thus generating 100pc return within a day rather than 10pc if they had to put up the whole £100 to buy the shares in the first place.
The problem comes when markets start falling and investors get the dreaded margin call. Using the same example if the shares fall to £80 on the first day the investors entire £10 has been wiped out, plus another £10 of debt he now owes. However, at the end of the day the broker will only call for an additional £2 to be put into the account. If at the end of the following day the shares fall further and the investor cuts their losses, they have to find money to repay their debts.
In the 1920’s many in the stock markets bought on margin, confident that they would gain from the rising market and get out before everyone else started selling.
In today’s stock market the only modification to buying on margin is that the US Federal Reserve currently has an initial margin requirement set at 50pc. The margin debt must remain below specified amounts on each account and not all shares can be bought on margin.
The market participants using debt to invest has also changed, gone are the days of retail investors using margin to boost returns, it is now largely the preserve of professional investors such as hedge funds.
More and more shares have become available to buy on margin as the perceived level of risk within markets has steadily decilined.
A key indicator of risk the Chicago Board Options Exchange Volatility Index, or VIX often known as the investor fear gauge, closed last week at 12.05 points, only three points from a record low.
The hope is that professional investors will not behave as irrationally, and sell shares wildly at the first sign of trouble, as happened in 1929. However, this looks to be wishful thinking on the part of the regulator. If anything the problem of the markets being exposed to sharp falls has only been amplified by the growth in the level of debt used by hedge funds.
The logic of the professional investors also appears deeply flawed as they all believe they can steadily unwind trading positions in an orderly process to realise their gains. However, because borrowing on margin requires positions to be exited quickly to prevent losses; a steady unwinding is impossible. This would be much the same as every spectator at a football game believing they can all make it through the exit at exactly the same time.
As we move into autumn the traders will be returning to the markets and reviewing their positions. This tends to be a volatile period for stock markets. The stock market crashes of 1929, 1987, 2001 and 2008 all happened in September and October.
In fact the anatomy of the 1929 crash is worth reviewing. It started with the Dow Jones Industrial average hitting its peak on September 3. The stock market then started to fall two days later, there was no panic and no crash throughout the whole of September and early October just stock prices failing to make a move higher.
It was on October 24, or Black Thursday, that the market finally fell apart dropping sharply before recovering strongly into the end of the day. The seeds of doubt had been sown and over the weekend investors decided they wanted to get out. When the markets opened on October 28, or Black Monday, there was more sustained selling and no recovery. The collapse culminated in the worst day in stock market history recorded on Black Tuesday October 29, when fear gripped the markets and the lack of any buyers resulted in share prices dropping through the floor.
The Dow Jones hit a record high of 17,154 last week and the S&P 500 has also gone above 2,000 for the first time ever. If investors do start to sell it will be into a thin market. US stock-market volume averaged 5.3bn a day in August, compared with a mean of 6.3bn in the first seven months, data compiled by Bloomberg show.

The S&P 500 has risen more than 22pc in the past 12 months

The Dow Jones Industrial Average has risen nearly 16pc in the past year
In the UK the FTSE 100 hasn’t climbed as high as the US stock markets. The Footsie closed last week at 6,820, still some way short of the record 6,951 reached on December 30, 1999.
As we approach those levels it is worth keeping in mind how far we could fall.
When the dot-com bubble burst at the start of the new millenium the FTSE 100 slumped 48pc to fall below the 3,500 level. As the 2008 financial crisis unfolded the FTSE 100 index dropped 41pc from its peak in 2007 and once again dipped below the 3,500 level.
As the traders and investors return from their summer break it looks likely to be a lively autumn.
By Mark O’Byrne
The palladium price made a new 13 year high today and reached $909/oz, its highest since February 2001. Markets fear that the global supply of palladium could be impacted by the threat of further sanctions against Russia.

Palladium in U.S. Dollars - 20 Years (Thomson Reuters)
The Russian mining industry has not been the target of sanctions so far, but with the oil sector already affected and the gas sector possibly the target of upcoming sanctions by the EU, markets remain fearful.
Russia is the world’s largest palladium producer accounting for over 40% of global production. This is mainly through Norilsk Nickel, the world’s largest mining company which mines nickel, copper and palladium in the area of Norilsk in Siberia, the world’s most northerly city. Palladium is mined as a by-product of nickel and copper mining. 
The majority of palladium produced is used in automobile catalytic converters and demand has been buoyant recently due to higher sales in the auto industry. Recent miner strikes in South Africa have also disrupted supply for the big South African palladium producers, Amplats, Impala and Lonmin.
Investment demand for palladium has also been strong recently and as acted as a competing demand to industrial users.

EU Draws Up Further Sanctions Against Russia
Diplomatic fallout from the conflict in Ukraine continues to intensify. Amid claims and counter-claims by the Russian and Ukrainian sides concerning the fighting and incursions in Eastern Ukraine, the war of words has stepped up.
Russian President Vladimir Putin was quoted as saying last Friday that "I want to remind you that Russia is one of the most powerful nuclear nations. This is a reality, not just words." While visiting EU leaders in Brussels at the weekend, Ukrainian President Petro Poroshenko said “we are very close to the point of no return, which is full scale war.”
As fighting continues, European Union leaders met in Brussels yesterday and recommended that the European Commission draw up further economic sanctions against Russia that would be imposed unless Russia demonstrates a de-escalation of its involvement in the conflict in Eastern Ukraine.
The recommended proposal includes “a provision on the basis of which every person and institution dealing with the separatist groups in the Donbass will be listed.” Donbass is the region in eastern Ukraine that encompasses the Donetsk and Luhansk areas that are currently the scene of the heaviest fighting in the conflict.
Up until now, the EU’s sanctions against Russia have targeted specific individuals, and a number of companies in strategic industries such as the Russian financial sector and high tech oil sector equipment sector.
The next set of potential sanctions is believed to still focus on the energy and finance industries, but would extend to sectors such as Russia’s gas sector, and step up the financial sanctions.
In the financial area, there appear to be plans by the EU to continue to limit access for Russian companies to the western financial markets. Further financial sanctions have also been discussed such as attempting to limit Russian access to sovereign bond markets and access to syndicated lending deals but, for now, these broader financial sanctions appear to be in reserve.
Russia has already imposed a ban on EU food imports and the EU is still fearful of retaliatory economic sanctions from Russia, which could extend to the EU aerospace, shipbuilding and car manufacturing sectors. This could ignite a harmful trade war which is why some EU member states are hesitant on sanctions at this time.
Last week, the UK was said to be proposing that Russia be blocked from the international SWIFT bank transfer network. If this occurred it would essentially shut Russian banks and other companies out of the international banking network. SWIFT is a Brussels based organisation and so it is obliged to follow any sanctions that are imposed by the European Commission.
However, the very fact that a proposal even exists to shut out Russia from the SWIFT network shows that the Ukrainian crisis is now taking on a more ominous tone, and that geopolitical risk is set to rise from here unless diplomatic intervention can somehow retrieve the situation.
With a heightened terror threat level being imposed in the UK, a potential ratcheting up of sanctions on Russia, and the threat of a larger trade and currency war on the horizon, September should be an interesting month for the precious metals markets.
by Ronan Manly, GoldCore Consultant. Editor Mark O’Byrne of GoldCore
Sources available on request - info@goldcore.com
MARKET UPDATE
Today’s AM fix was USD 1,287.25, EUR 979.34 and GBP 774.47 per ounce.
Friday’s AM fix was USD 1,285.75, EUR 975.83 and GBP 774.55 per ounce.
Gold fell $2.00 or 0.16% to $1,287.30 and silver slipped $0.05 or 0.26% to $19.48 per ounce Friday. For the week, gold was up 0.54% while silver remained unchanged.
Today, the U.S. markets are observing a national holiday for Labor Day.
Platinum is trading at $1,424, unchanged from Friday. Palladium is again up strongly at multi-year highs at $909, up 1.5% from Friday’s $895.
With the Labor Day holiday today in the US, markets are expected to be quieter than usual, but given that it’s now September, the remainder of the week is set to see higher volumes and more market activity as traders return and refocus following what is traditionally considered the holiday month of August.
By Nicholas Larkin and Glenys Sim
Palladium rose to the highest level in more than 13 years as prospects of further sanctions against Russia increased concern that supplies from the largest producer may be disrupted. Gold was little changed.
Russian President Vladimir Putin suggested “statehood” for battle-torn southeastern Ukraine, as European Union governments agreed to impose new sanctions on Russia if the conflict worsens. Russia has retaliated against previous sanctions by banning imports of some food products. There have been no metal-related restrictions yet.
Palladium has climbed 27 percent this year as usage rose in catalytic converters, which curb harmful emissions in cars, and as a five-month mine strike that ended in June in South Africa, the second-biggest producer, reduced supplies. The metal capped a seventh month of gains in August that was the longest such run since January 2011.
“The threat of additional sanctions against Russia has rattled a commodity where demand” is increasing, Ole Hansen, head of commodity strategy at Saxo Bank A/S in Copenhagen, said today by e-mail. While prices may fall back toward the “psychological” level of $900 an ounce in the short term, “the risk of a deeper correction seems low at this stage,” he said.
Palladium for immediate delivery climbed 0.6 percent to $910.25 an ounce by 12:29 p.m. in London, according to Bloomberg generic pricing. It reached $911.46, the highest since February 2001. The metal for December delivery on the New York Mercantile Exchange was 0.3 percent higher at $912.25.
Futures trading volume was 26 percent below the average for the past 100 days for this time of day, data compiled by Bloomberg showed. Floor trading on U.S. markets was closed today for the Labor Day holiday.
Platinum lost 0.2 percent to $1,421.10 an ounce in London. The metal is also mostly used in catalytic converters. Platinum and palladium are both heading for a third straight annual supply shortage, according to Johnson Matthey Plc.
While EU leaders disagreed about possible military assistance to Ukraine, they gave the European Commission a week to deliver proposals for sanctions that may target Russia’s energy and finance industries.
Gold was little changed at $1,287.24 an ounce in London. It reached a one-week high of $1,296.61 on Aug. 28, rebounding from a two-month low of $1,273.14 set Aug. 21. Bullion gained 0.5 percent last week even as the dollar climbed to the highest level in almost seven months against 10 major currencies. The U.S. Labor Department will release its latest monthly jobs report on Sept. 5.
“Gold prices have been pulled higher by geopolitical tensions but pushed lower by a stronger dollar,” Barclays Plc wrote in a report today. “Market focus will turn to the U.S. unemployment report this week, where recent stronger-than-expected data have capped upward momentum in gold.”
Silver was little changed at $19.4733 an ounce.
by Sober Look
In addition to property market challenges and the unexpected slowdown in manufacturing expansion, we continue to see markets signaling a significant loss of momentum in China's economic growth. Earlier in the year the country's economic trajectory was quite uncertain. This was followed by a strong pickup in manufacturing activity early this summer and economists suggested that the worst is over. But it seems that China is once again facing significant headwinds.
The nation's industrial commodities are hitting new lows, particularly iron ore and the Shanghai-traded steel rebar.
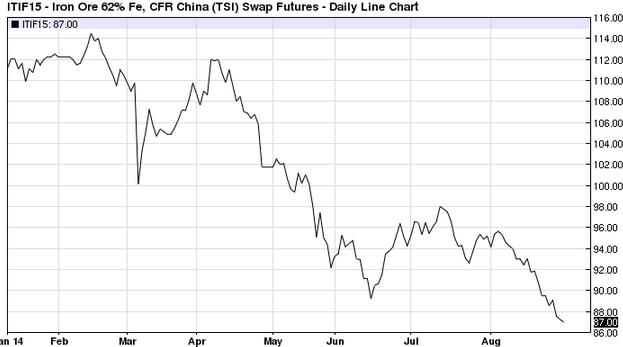
Iron Ore 62% Fe, CFR China; Jan-2015 contract (barchart)
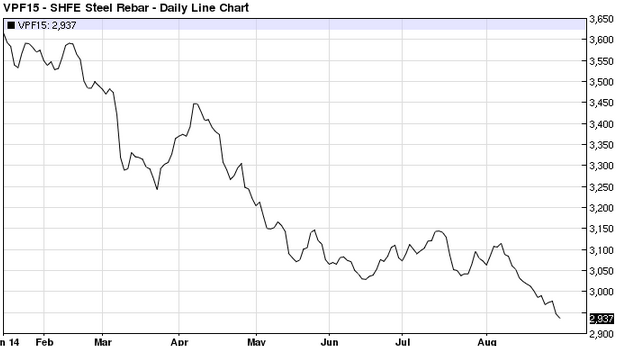
SHFE Steel Rebar January 2015; Jan-2015 contract (barchart)
Other commodities linked to construction, such as fiberboard, have been declining as well. Moreover, the recent stock market rally has stalled. Perhaps the most telling sign of weakening fundamentals in China has been the nation's rates market. Rates implied by SHIBOR-based interest rate swaps have declined materially over the past month. More importantly the yield curve has become inverted.
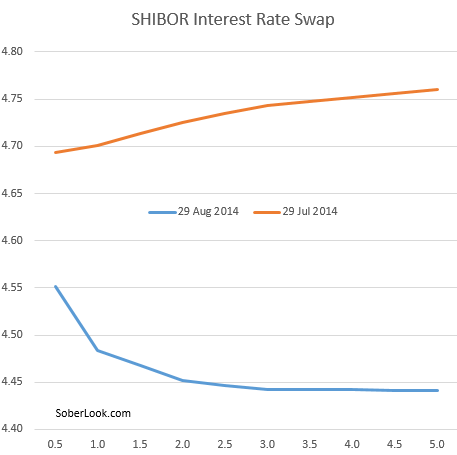
Swap rates by maturity (yrs)
As discussed before, economic weakness in China is reverberating globally - from Australia to the Eurozone - and is in part responsible for the bond yield compression across developed economies. We are likely to see the central government step in with more stimulus in order to stabilize the situation. However, as Beijing is beginning to realize, limited new stimulus directed at boosting growth is becoming less effective. A much larger effort may be required.
 | The United States and Canada celebrate Labor Day today. Its origins are a few years earlier than the May 1 international labor holiday, which is also of American origin. May Day arose out of the ashes of the 1886 Haymarket Square affair in Chicago. The roots of the September Labor Day can be traced back to a large organized labor parade in New York City in 1882. The September Labor Day did not become a national holiday until 1896. It appears to have been seized upon by the political elite as moderate alternative to the May Day holiday, which was identified with more radical elements of the labor movement. May Day has historically been associated with effort to reduce the work week and increase pay. September's Labor Day traditionally focused on the dignity of work. It may not be an exaggeration to say that September Labor Day is to the May Day holiday what a company union is the the union movement. |
| These Great Graphics are from Pew Research, which drew on Bureau of Labor Statistics. They illustrate both the improvement in the US labor market and how it still has not returned to the conditions that existed before the crisis. One of the starkest changes has been the rise of part-time workers for economic reasons (that is want to work full-time but cannot find full-time work). Before the crisis, 3.3 mln Americans were so classified. In July 2014, 7.7 mln Americans fell into this category, which is down almost 20% from it peak. There are two debates over the state of the US labor market. First, there is some disagreement about whether there is slack in the US labor market. The last FOMC statement cited "significant under-utilization". Some economists disagree, and even among those that might be more sympathetic to the Fed's statement, dispute how much slack exists The second debate is over structural and cyclical aspects of the under-utilization. The idea is the monetary policy can help facilitate improvement in the latter but not the former. The Troika at the Fed (Yellen, Dudley and S. Fischer) argue that there still is a significant cyclical component. The increase in productivity means that we can produce more goods, while spending less time making them. Productivity is considerably more difficult to measure in parts of the service sector, but technological advances also permeate that space. Consider the ATM and sku-readers at retail stores, as easy examples (but don't fiddle with my string quartet). The key challenge is lies with distribution not production. The distribution is not only of consumption, and the necessary separation of consumption from work, but also the distribution of work and leisure time itself. On this Labor Day, I will think about how the cumulative increase in productivity provides the economic basis for a re-organization of society. | 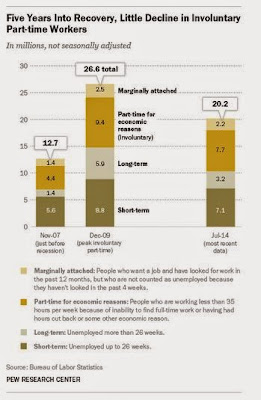 |
by Minxin Pei
CLAREMONT, CALIFORNIA – China has recently held a series of solemn, high-profile ceremonies, barely noticed by the outside world, in honor of the 110th anniversary of former leader Deng Xiaoping’s birth. But, as with most political festivities in China these days, few have bothered to reflect on what is being celebrated – and what Deng’s leadership actually meant. The truth is that, while Deng deserves appreciation for having brought China back from the abyss of Maoism, his approach – “Dengism,” or authoritarian developmentalism – is now impeding China’s prospects.
Distinguishing Deng the reformer from Dengism the governing philosophy is no idle academic exercise. Deng, who risked his authority and that of the Chinese Communist Party (CCP) to break with Maoist convention and launch China’s economic revolution, died in 1997. Dengism, which emphasizes the goal of modernization under a powerful one-party state, continues to shape China’s governance system.
Deng, who famously declared, “A cat’s color does not matter as long as it catches mice,” is generally remembered as an unabashed pragmatist. But even pragmatists have core principles that limit their actions, and Deng was no exception. Two ideas were incontrovertible: the CCP could retain its grip on power only by delivering economic development, and China could modernize only under a strong one-party system.
Thus, rejection of democracy in any form was fundamental to Deng’s viewpoint. Though he advocated legal reform as a tool of modernization, Deng was adamant that the rule of law not be allowed to limit the CCP’s power.
To be sure, Deng recognized some of the pathologies of the party-state. With leadership positions allocated – often for life – on the basis of personal connections, rather than merit, he understood that the system suffered from gross inefficiency, risk aversion, and a lack of technical expertise.
But Deng was convinced that administrative reforms could resolve these issues. What he did not anticipate was how difficult it would be to overcome resistance from within the CCP to any diminution of its powers.
The slow pace of reform frustrated Deng so much that, in the late 1980s, he asked the reformist premier Zhao Ziyang to lead a secret high-level task force to examine options for more radical changes – this time, directly targeting the political system. But when the group asserted that progress toward modernization would require the incorporation of some democratic principles and the rule of law, Deng immediately quashed the initiative. His view that modernization required keeping power concentrated in the hands of a single party failed to anticipate the threat that a predatory state would pose to sustained development.
Herein lies the tragedy of Dengism. It gained credibility from the fact that its creator dismantled a cruel and destructive system, and left behind a more prosperous and humane China. But that credibility has been used to justify the maintenance of a system that is now hampering China’s continued progress.
Dengism’s greatest intellectual failure is its inability to account for the potential of unchecked power to nurture greed and corruption among ruling elites. Its greatest political failure is its resistance to the democratic reforms needed to constrain that power.
During Deng’s rule, Dengism’s inherent contradictions and limitations were less apparent. After all, the Chinese people had been repressed for so long that economic reforms alone represented a huge step forward. Indeed, by creating space for individual creativity and entrepreneurship, they unleashed a historically unprecedented period of rapid growth that lifted millions of Chinese out of poverty.
But the lack of political reform meant that there was nothing to stop the ruling elites from appropriating a disproportionate share of the new wealth. Recent revelations of systemic corruption at all levels of government demonstrate that the gravest threat to China’s long-term economic success is the unchallenged, unruly party-state.
The good news is that President Xi Jinping seems to recognize this problem. Beyond taking up Deng’s mantle in pursuing market-oriented economic reforms, he has been directing a bold anti-corruption campaign since coming to power. In July, he launched a formal investigation into one of the Chinese Communist Party’s most senior figures, Zhou Yongkang – a testament to his commitment to rooting out abuse of power.
Xi’s desire to become China’s next great reformer may well be why his government has been investing so much energy in lauding Deng’s achievements. One hopes that he continues to emulate Deng, without allowing his approach to become distorted by Dengism.
by Agrimoney.com
Olam International's Ukraine grain business has "completely dried out" because of the country's political crisis, the group said, as it unveiled concerns over Africa's ebola outbreak too.
The Singapore-based agribusiness giant - in follow-up comments to its announcement of a 1.5% rise to Sing$48.5m in underlying earnings for the April-to-June quarter – said that a drop in grain trading profits was one of the factors behind its sluggish growth.
Grain volumes fell, in part because of asset disposals, with Olam revealing it had sold a stake in its South African grain trading operation besides the $68m sales to Japan's Mitsubishi Corp, as announced in June, of 80% of its Australian business.
"That has meant lower volumes as well as lower ebitda [earnings before interest, tax, depreciation and amortisation] in grains which is a choice that we have made," said Shekhar Anantharaman, Olam director for finance and business development.
Olam, which said it had reaped a "significant gain" on its Australian disposal, has yet to reply to an Agrimoney.com request for further information on the South Africa deal.
'Completely dried out'
However, the company had also seen a drop in grain volumes thank to a "choice which has been fostered upon us", Mr Shekhar said, highlighting the "Ukrainian-Russian crisis".
In the April-to-June quarter, "certainly, that part of the volume has not happened which is obviously a concern," he told investors.
"The Ukraine business has completely dried out in the last four months and that is still a concern for us for the next year."
In fact, Ukraine's overall grain exports in June and July, the first two months of 2014-15, rose 48% to 4.7m tonnes, according to agriculture ministry data, although the country's unrest, and in particular the movement of pro-Russian rebels towards the port of Mariupol, have raised market concerns.
The comments add Olam to agriculture groups such as egg producer AvangardCo, US-based Cargill and poultry group MHP reporting some losses to the Ukraine crisis.
Mr Shekhar added that the Olam "would like to stay on a Russia - it's an important part of our business so the Russian business is still happening".
'Serious issue'
While Olam highlighted that its West African flour milling business had performed better than expected, it highlighted the potential threat there too should the ebola epidemic spread beyond current epicentre, in Sierra Leone, Liberia and Guinea, to which is has only small investments.
In Nigeria, where six people have died of the virus, Olam has "very significant exposure in operations", including in milling, chief executive Sunny Verghese said, adding that the group had imposed a series of measures to protect its own staff and products.
These included a ban on travel in the three most affected countries, and travel to Nigeria "only if it is absolutely required," Mr Verghese said, adding that the group was holding daily "crisis committee" meetings on ebola, with further in-country sessions.
"It is a serious issue and requires to be treated very seriously," Mr Verghese said.
Market reaction
The comments came as the group expanded on its results, which showed a drop in headline earnings of 44% to Sing$31.8m for the latest quarter, reflecting one-off charges such as a loss on disposal of timber assets in Gabon.
Mr Verghese said he was "pleased" with Olam's progress in revamping itself in line with a strategy of debt reduction and operational shake-ups which was drawn up after the group was targeted by short-selling group Muddy Waters.
After the results, Maybank Kim Eng termed the performance "in line" with expectations, and restated a "hold" recommendation on Olam shares, which it said were trading at a 15% premium to those in comparable companies.
However, OCBC restated a "sell" rating on the share, for which it estimates Sing$2.38 as fair value, saying that "current valuations appear slightly stretched".
Olam shares on Monday closed down 2.6% at Sing$2.58 in Singapore.
How bullish and bearish forces align for stock indexes, forex and other global markets, both technical and fundamental outlooks, likely top market movers. Despite all the headlines, neither economic data nor the Russian invasion of Ukraine moved markets. Here's what did.
The following is a partial summary of the conclusions from the fxempire.com weekly analysts' meeting in which we cover outlooks for the major pairs for the coming week and beyond.
We look at the technical picture first for a number of reasons, including:
Charts Don't Lie: Dramatic headlines and dominant news themes don't necessarily move markets. Price action is critical for understanding what events and developments are and are not actually driving markets. There's nothing like flat or trendless price action to tell you to discount seemingly dramatic headlines - or to get you thinking about why a given risk is not being priced in.
Charts Also Move Markets: Support, resistance, and momentum indicators also move markets, especially in the absence of surprises from top tier news and economic reports. For example, the stronger a given support or resistance level, the more likely a trend is to pause at that point. Similarly, a confirmed break above key resistance makes traders much more receptive to positive news that provides an excuse to trade in that direction.
Overall Risk Appetite Medium Term Per Weekly Charts Of Leading Global Stock Indexes
(click to enlarge)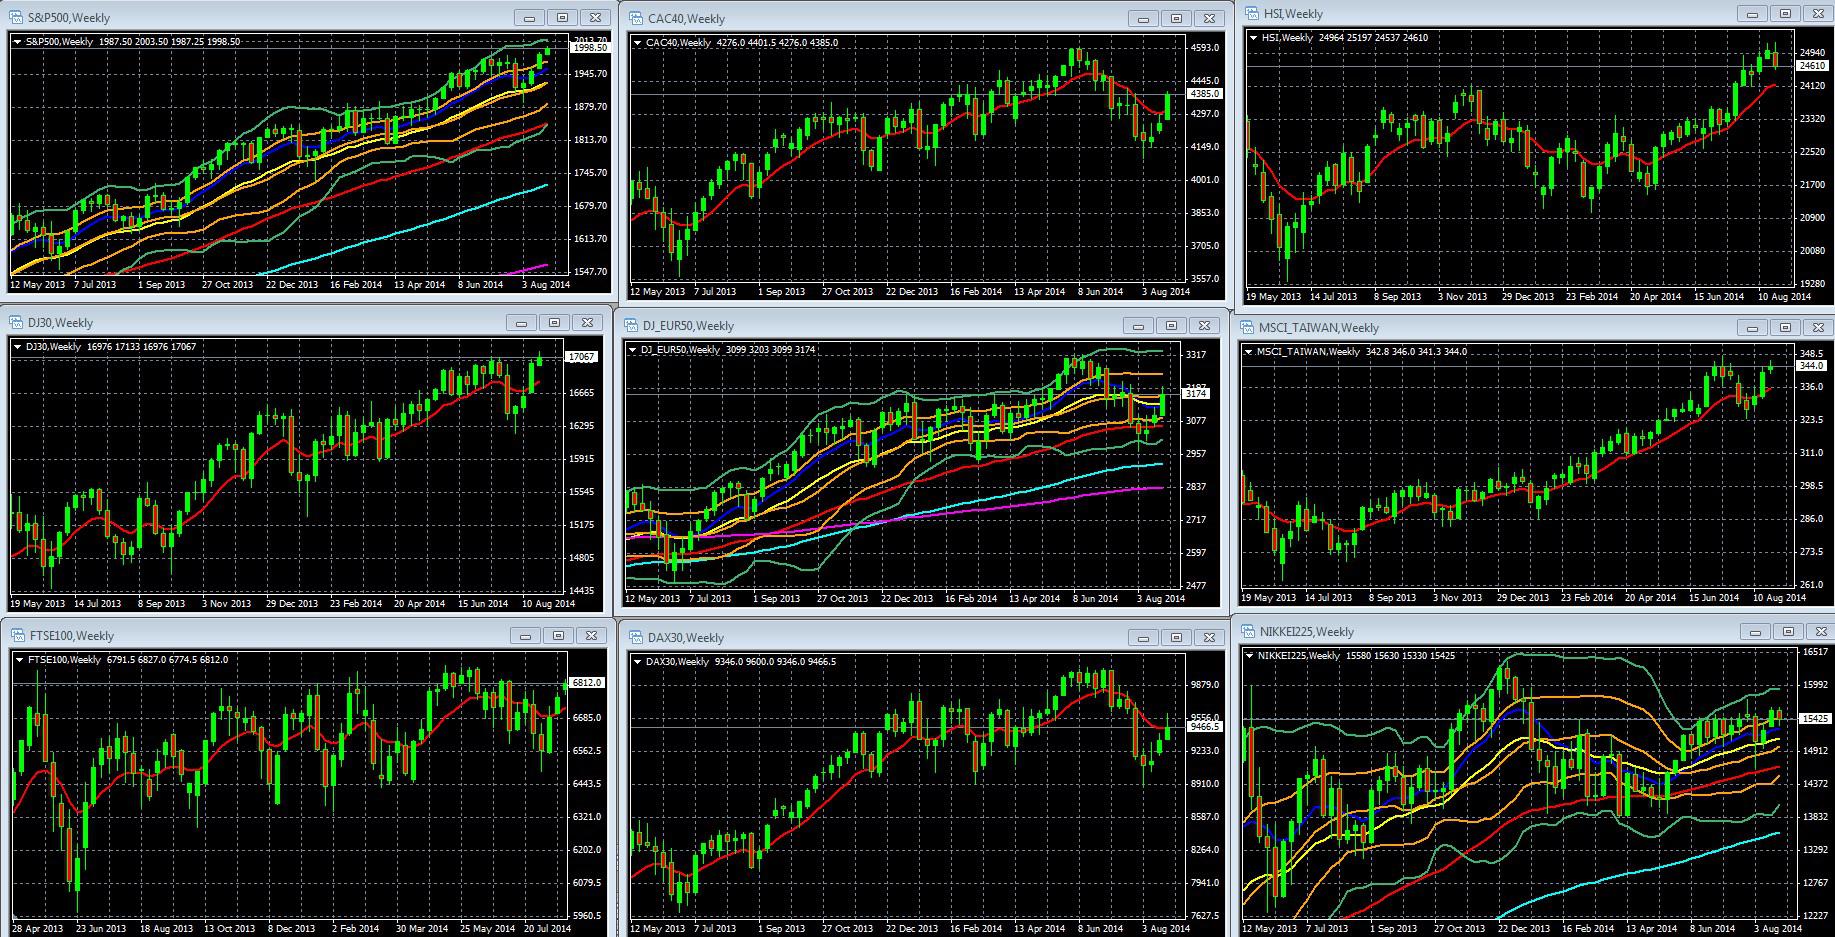
Weekly Charts Of Large Cap Global Indexes May 12 2013 To August 29 2014: With 10-Week/200-Day EMA In Red: LEFT COLUMN TOP TO BOTTOM: S&P 500, DJ 30, FTSE 100, MIDDLE: CAC 40, DJ EUR 50, DAX 30, RIGHT: HANG SENG, MSCI TAIWAN, NIKKEI 225
Key For S&P 500, DJ EUR 50, Nikkei 225 Weekly Chart: 10-Week EMA Dark Blue, 20-WEEK EMA Yellow, 50-WEEK EMA Red, 100-WEEK EMA Light Blue, 200-WEEK EMA Violet, DOUBLE BOLLINGER BANDS: Normal 2 Standard Deviations Green, 1 Standard Deviation Orange.
Source: MetaQuotes Software Corp, www.fxempire.com, www.thesensibleguidetoforex.com
02 Aug. 31 11.06
For Europe, the week brought more evidence of deterioration in both economic data and the Ukraine crisis. Nonetheless, European stocks made their third straight weekly advance. As a result they
· Broke or are close to breaking their 2-month old downtrend lines.
· Moved firmly into their double Bollinger® band neutral zones, signaling a bottoming is in as momentum is now firmly neutral rather than negative.
· Closed the performance gap with Asia and the US
So if everything is getting worse why did European stocks rise? For the same reason they've advanced in other regions in the face of sustained periods of bad fundamentals. It's another week of the "bad news equals good news trade." For those somehow still unfamiliar with this phenomenon, it means that because bad news implies more central bank stimulus is coming, stocks rise because that new cash injection into markets is expected to prop up stock prices.
The bad news equals good news trade needs to things to work:
· Consistently bad economic data showing stagnant or declining growth. Check.
· Investors interpret central bank comments to mean that they will add new stimulus programs if things don't turn around soon, or that such programs are already in the pipeline and that it's just a matter of weeks before they're announced. Check, ever since Draghi's impromptu Jackson Hole comments in which he admitted that deflation was not merely temporary but rather a longer-term problem.
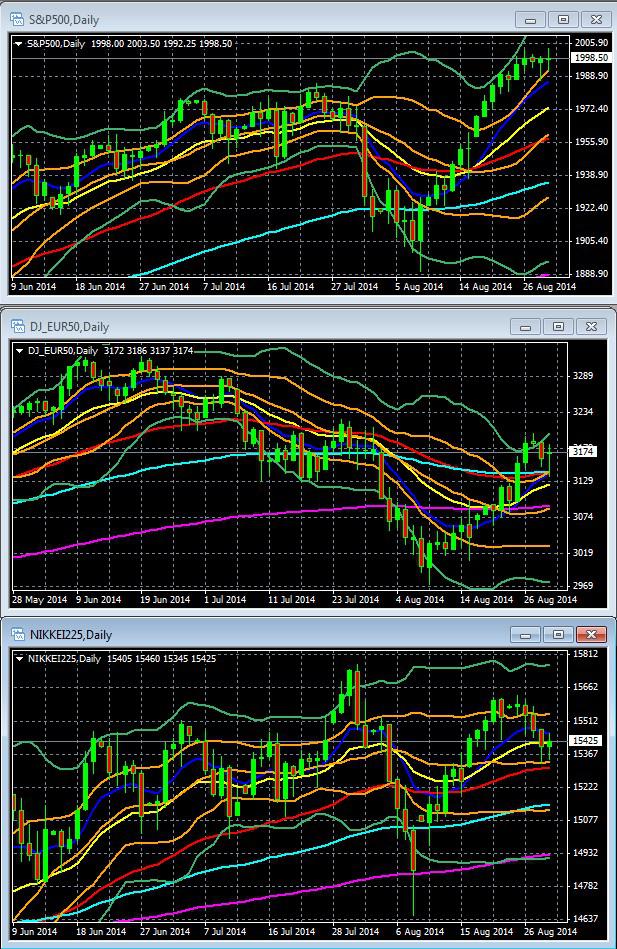
Key For S&P 500, DJ EUR 50, Nikkei 225 Daily Chart June 9 2014 to August 29 2014: 10-Week EMA Dark Blue, 20-WEEK EMA Yellow, 50-WEEK EMA Red, 100-WEEK EMA Light Blue, 200-WEEK EMA Violet, DOUBLE BOLLINGER BANDS: Normal 2 Standard Deviations Green, 1 Standard Deviation Orange.
Source: MetaQuotes Software Corp, www.fxempire.com, www.thesensibleguidetoforex.com
03 Aug. 31 12.22
For the US and Europe, the big gains came early in the week on rising hopes for new ECB stimulus, fueled by ECB President Draghi's remarks that deflationary forces were proving more persistent than previously thought.
For the rest of the week, global stocks stayed in flat, tight trading ranges.
The big lesson here is that speculation on ECB easing was the big market mover, overriding data as well as news of Russia's increasingly overt invasion of Ukraine.
This is a key lesson because:
On Saturday Reuters reported that ECB Executive Board member Benoit Coeure had reinforced new ECB easing expectations, saying the bank was prepared to further boost funding to banks in order to encourage lending.
This alone could give global indexes, particularly European ones, a boost early in the week.
It also puts added focus on Thursday's ECB meeting and press conference. Although most analysts don't expect the ECB to announce new measures yet, this event would still be the likely venue for the ECB to feed or dampen stimulus speculation.
Germany has usually been the chief opponent of new stimulus, but a string of bad German data last week has raised suspicions that German leaders will become more receptive to it as their own economy shows signs of weakening. In particular we saw,
· A steep decline in German retail sales
· An increase in unemployment
· A deterioration in consumer, business and investor confidence
Together all of these indicate fading momentum in the Eurozone's largest economy. The cause isn't the Russian/Ukraine conflict, because even if there were material sanctions in effect, Russian exports represent only 1% of German GDP.
Instead, the problem for Germany and most of the EU is restrictive fiscal policy, that is, not enough spending. Low inflation remains a problem but Friday's increase in core CPI growth could give Mario Draghi enough reason to leave monetary policy unchanged at this week's ECB event. With the first TLTRO program expected in September, (and old LTRO loan repayments minimizing any net addition of liquidity until November or December), the central bank would probably prefer to see how the new TLTRO works before increasing stimulus further.
However, that doesn't mean the ECB won't try some "verbal stimulus" by raising expectations for some kind of new asset purchases. For example:
· -The ECB could announce ABS purchases, with the actual dates and details to follow later.
· -It could lower its GDP and inflation forecasts, both of which are due out next week.
· -It can simply continue with more of its usual statements of concern about EU stagnation and its willingness to do more to help, though there is cause to wonder if its ammunition is running low.
o ---Interest rates are already near zero
o ---QE's benefits, beyond inflating asset prices, remain unclear from the experiences of the US and Japan
o ---Encouraging lending helps only if there is actual demand for loans. That in turn requires optimism about the future. Business need to believe expansion is coming, and households need to have confidence in that their incomes will be stable and growing. However GDP continues to stagnate and most member states need to cut spending (another GDP drag) if they're to keep up with EU mandated debt/GDP reductions. In other words, the ECB alone cannot do enough to make up for a lack of economic reforms in the EU.
Everything that has real influence over global asset prices and rates these days falls into one of three categories:
1. Economic data from the US, Europe, or China (ok, occasionally Japan or the UK).
2. Speculation about changes in policy, and ultimately, benchmark interest rates, from one of their central banks.
3. Geopolitical tensions, with the Russia/Ukraine conflict the only one seen as having potential to really hurt the global economy, mostly through the damage it does to the already shaky EU. Mideast turmoil hasn't affected energy prices and the "China versus all of its neighbors" tensions remain on slow simmer, so both remain irrelevant for investors.
Looking at last week's price action in global equities, one big screaming lesson stands out that everyone needs to learn. Speculation on major central bank policy changes, particularly from the ECB, Fed, and PBoC, (and thus key data most likely to influence them) is overriding all else.
Last week's data should have global indexes, at very least in Europe. Ditto Russia's now overt direct invasion of Ukraine. Yet the only thing that moved most global indexes was rising speculation of new ECB easing.
This isn't so surprising. Last week's data merely confirmed and supported the current outlook for the major economies. New economic sanctions against Russia appear to be coming, but the West remains vague on both their timing and extent. So markets have reason to doubt if and when these will materially impact anything.
It follows from the above that the big scheduled events for this week are those that tell us the most about policy changes from the central banks of the biggest economies. That means the scheduled events with the most market moving potential are:
Thursday's ECB meeting, rate statement and press conference. As noted above, while we don't expect new policy to be announced, at least not in any meaningful detail, it's quite possible that the ECB will want to offer something that suggests it's taking an active role in solving the mess that EU leaders have failed to resolve. The ECB meeting has the most market moving potential of any event on the calendar, because its policy is in flux. It will ease further, the only question is when and how. That means a big surprise here could move markets more because it could change expectations about ECB policy, EU liquidity, the Euro, interest rates, etc. the most.
The Fed continues to see too much slack in the labor market to allow for any material tightening beyond a minor rate increase sometime in the coming year, so the US August job reports have the most potential of any other calendar event to influence speculation on the pace and scope of Fed tightening. Unless this one really surprises and the ECB meeting does not, this has a bit less market moving potential because Fed tightening is happening more slowly than ECB easing. Therefore no matter what the result from the jobs reports, it's less likely that these will move expectations on policy changes as much as a surprise from the ECB meeting. Also, the ECB meeting will produce comments directly from the ECB itself, whereas the US jobs reports not as telling as a direct communication from the Fed itself.
Note that as always, reports earlier in the week that serve as leading indicators for the Friday official jobs reports could also be short-term market movers if they surprise up or down. Chief among these are:
The ISM manufacturing and non-manufacturing PMI surveys, particularly their jobs components. Services are the biggest employers by far, so the non-manufacturing PMI Thursday is more important.
The ADP non-farms payrolls report, a privately compiled version of the official report. ADP changed its methodology back in October 2012 in an effort to make the ADP report better predict the actual official BLS version. The ADP version continues to be a good indicator of general direction, but less effective in predicting the actual result. See here for details. Still, positive or negative surprises have been influential in the past, at least for the two days between the ADP report and official NFP release.
See below for other calendar events that could influence most global asset markets. Events that would influence a narrow range of assets or only regional indexes are omitted, so this summary would not be suitable for those dealing with currencies or bonds which tend to be more influenced by country or region specific news. For example, we omit most Bank of Japan or England events, although these would be of importance to investors in JPY or GBP currency pairs or those bond markets.
How Much Longer Will The Bull Market In Equities Last?
The short answer, obviously, is that few see signs that it will end any time soon, except for the perma-bears. That said, by definition, crashes are unanticipated by almost everyone.
Bulls
The most compelling piece on the bullish side was Cullen Roche's summary of David Rosenberg's bullish forecast here, mostly because not only does Rosenberg focus on data that isn't as likely to be distorted by the prevailing unique levels of central bank intervention and low rates (unlike analyses based on historical valuation metrics), he's also a converted bear. That willingness to admit fault and stick to what the data tells him earns credibility.
Deutche Bank economist Torsten Slok argues that the stocks shouldn't fall because stocks don't fall unless there's a recession, and the normal causes of a recession aren't present. These include:
Bursting bubbles in capex (as in 2000) or consumption (2007-8) or when monetary policy is too tight, that is, well above its neutral level of about 3.75% on the US 10-year treasury note. He notes, similar to what we've said in the past, that with the Fed planning on a very gradual rate of increase, that could take about 5 years.
See here for further details.
We disagree with Slok's assumption that stocks necessarily rise and fall with recessions, however the rest of his argument makes sense. As we've said all along, global stocks have continued to rise despite poor economic data. The key constants of the post March 2009 lows have been:
· Stimulus that keeps rates so low that yield seekers are pushed into equities
· Lack of a contagion threat
Agree or not, that HAS been the reality of the bull market. The only material pullbacks occurred when one of these was in doubt (EU crisis, taper tantrums, etc.).
Bears
Given the long bull market, supported by continued low rates from central banks and no contagion threats, recent bearish arguments are variations on:
Valuations are high by historical standards. True, but ultra-low rates make today less analogous given that investors have few options for yield, so investors are accepting higher valuations.
The rally is getting old by historical standards. Again, true, but it's far from record setting and while the conditions that created the rally remain it's hard to accept that there's a time limit on the bull market as long as the twin pillars of low rates and no contagion threats remain in place.
SocGen's Albert Edwards is arguing that with the end of QE, that will bring the end of the low rates that fund corporate stock buybacks, which he contends are a major prop of stock prices.
Below he shows the correlation between corporate borrowing and stock buybacks. The unstated implication is that the buybacks began at the same time as the bull market, which in turn suggests they're a key component of it.
(click to enlarge)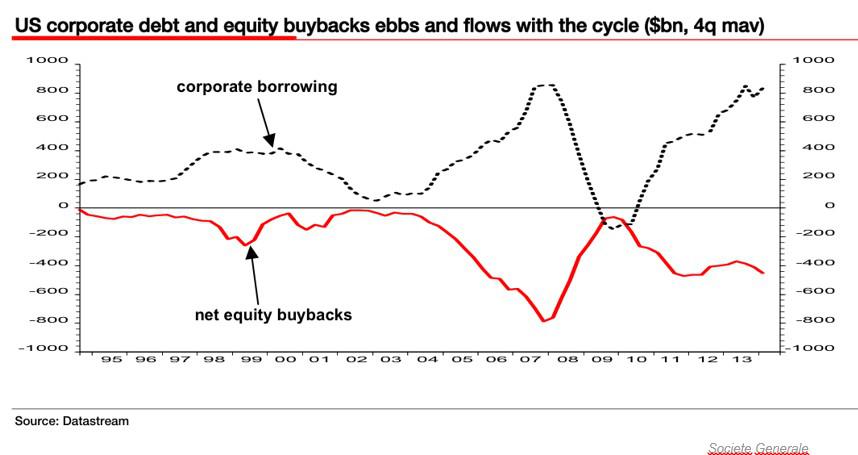
Via Business Insider here
04 Aug. 31 16.40
Below he shows the proportion of stock purchases from corporate buybacks, shown by the purple bars.
(click to enlarge)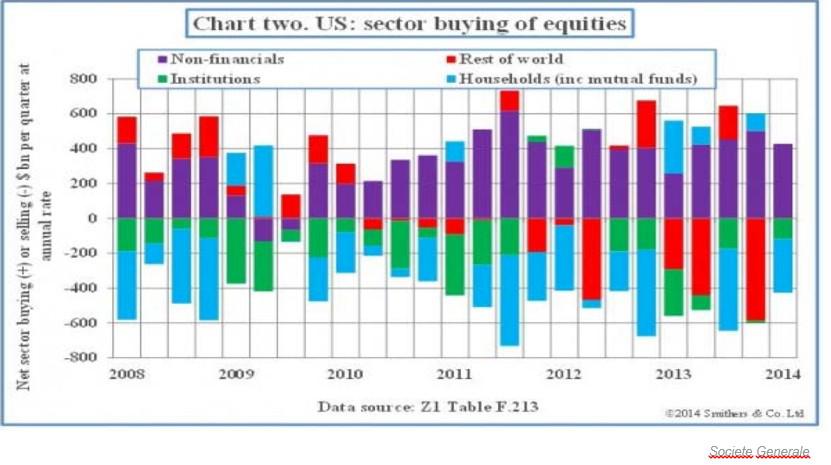
Via Business Insider here
05 Aug. 31 16.41
Edwards then asserts that the end of US QE, combined with an anticipated slowing of corporate profits, will end the buybacks and so cut demand, and prices, for stocks.
My problems with this thesis include:
The end of QE doesn't necessarily bring a material spike in interest rates, particularly when the Bank of Japan and ECB are moving towards further easing. That added liquidity should to some degree compensate for whatever effects come from planned tightening by the Fed and Bank of England.
Echoing many analysts, Citi's top economist Willem Buiter is forecasting that a big policy divergence among some of the world's leading central banks. In essence, he predicts:
· The economies of the EU and Japan, both burdened with low growth and inflation, will cause their central banks to start "major" new QE programs in late 2014 or early 2015.
· Meanwhile, the slow but steady recoveries in the US and UK will bring their central banks to begin some kind of gradual tightening at some point in 2015. Indeed the latest meeting minutes of both the Fed (two weeks ago) and BoE (last week) suggest show signs that these two banks are edging towards tightening.
This has significant implications for many kinds of global markets.
The most obvious effects are being seen, and will continue to be most obvious, in currency markets. Currencies trade in pairs, so literally, everything is relative. That is, even minor but persistent differences in economic performance can create significant long-term trends as long as the relative differences continue and continue to give one currency a higher benchmark interest rate than the other.
That rate difference would also be quickly seen in bond markets, as bonds from nations in tightening modes yield more and attract more demand. It's in the bond markets where the really interesting effects and questions come. Here are just a few:
First, will falling rates in the EU and Japan offset the effects of rising rates in the UK and US for global growth, stocks, and emerging market assets?
Remember how in early 2014 emerging market assets and currencies were hit hard by the mere hint of coming Fed rate hikes? These would have cut demand and prices for emerging market currencies, stocks and bonds because they would lose some of their yield advantage over US assets. It also forced their bond yields and borrowing costs up, which in turn hurt their growth prospects.
Will US And UK Tightening Undermine Easing Policies For The ECB and BoJ?
An equally significant question is whether rising rates in the US and UK, or at least the expectation of them, will force global rates higher and undo the very easing that the EU and Japan are trying to accomplish? Remember, bonds operate in a global market.
If investors can get higher returns on US and UK bonds from both currency appreciation (currencies rise as their benchmark rates rise) AND higher bond yields, why would they buy EU and Japanese bonds? They wouldn't, not until EU and Japanese bond prices fell and thus their yields rose enough to compete with bonds of the US and UK.
Sure, for a while the ECB and BoJ and just keep buying up their own bonds to keep their bond prices and yields stable. However even if we assume that the ECB would ultimately be allowed to do that (we do, see here for details) along with Japan, that's not a sustainable policy, as such unrestrained money creation (let's avoid technical definitions of money printing) risks creating a Weimar-like hyperinflation.
Theoretically if the US and UK hike slowly enough, with some kind of policy coordination with the ECB and BoJ, maybe they could avoid that mess. Frankly I lack the background and analytical skills to even attempt an answer.
I haven't even considered the impact of Chinese central bank policy, which could easily revert to easing mode despite intentions to move towards tightening.
Do you have any thoughts, dear readers?
Other than the above mentioned events, here's a quick rundown of other potential market movers.
Monday
China: Manufacturing PMI (official data focused on big state owned firms), HSBC final manufacturing PMI (privately compiled, focused on smaller privately owned firms). Both are relevant for the EURUSD because China's status as leading global growth engine means top-tier reports like these influence overall risk appetite, with which the EURUSD usually moves (albeit not recently given ECB easing, bad EU data, and Russian tensions, all of which are undermining the EUR more than other assets).
EU: Italian manufacturing PMI
US: most markets closed for Labor Day
Tuesday
US: ISM manufacturing PMI (its labor component is seen as a leading indicator of the big monthly US jobs reports on Friday)
Wednesday
China: Non-manufacturing PMI, HSBC services PMI
EU: Spain, Italy, EU services PMI survey, EU retail PMI survey,
US: factory orders, Beige book
Thursday
EU: German factory orders, ECB rate statement and press conference (will it indicate new easing is coming?)
US: Trade balance, weekly new jobless claims, ISM non-manufacturing PMI (its jobs component is an even bigger leading indicator of the Friday monthly jobs reports than the mfg. PMI as services are a bigger employer)
Friday
EU German industrial production
US: NFP jobs report, unemployment rate, avg hourly earnings
Biggest Questions
1. Will Russia escalate? If so, will the West continue to delay imposing meaningful sanctions and thus allow markets to largely ignore the conflict?
2. Will the ECB September 4 meeting indicate new EUR dilutive easing coming sooner than expected?
3. Will key EU and US top tier data continue with the "US outperforming the EU" theme, and if so, will that raise expectations for faster ECB easing and/or Fed tightening? Again, it's changes in sentiment on central bank policy direction that move global stocks in general, and the EURUSD in particular, more than anything else these days. Also, Fed policy is no longer viewed as being on automatic pilot after the last FOMC meeting minutes for July suggested that the timing of the first rate hike is under discussion.
4. Will Friday's US jobs report feed expectations for faster Fed tightening? If so, will US bond rates remain low anyway as safe haven demand keeps rates low.
5. If indeed there is a coming divergence in central bank policies, with the Fed and BoE tightening while the ECB and BoJ are easing, what will be the net effect on global interest rates and markets?
6. Can the ECB, with its limited tools, continue to keep the EU crisis in hibernation, even as so many member states that are too big to bail out run unsustainably high debt levels that are likely to grow worse, as we discussed recently here?
Follow Us