Sunday, September 7, 2014

The Exaggerated Death of Inflation

by Kenneth Rogoff

uk inflation fall to 1.6%

'Inflation is not the theoretical curiosity many analysts believe it to be. It could return.' Photograph: Nick Ansell/PA

Is the era of high inflation gone forever? In a world of slow growth, high debt, and tremendous distributional pressures, whether inflation is dead or merely dormant is an important question. Yes, massive institutional improvements concerning central banks have created formidable barriers to high inflation. But a significant part of a central bank's credibility ultimately derives from the broader macroeconomic environment in which it operates.

In the first half of the 1990s, annual inflation [PDF] averaged 40% in Africa, 230% in Latin America, and 360% in the transition economies of eastern Europe. And, in the early 1980s, advanced-economy inflation averaged nearly 10%. Today, high inflation seems so remote that many analysts treat it as little more than a theoretical curiosity.

They are wrong to do so. No matter how much central banks may wish to present the level of inflation as a mere technocratic decision, it is ultimately a social choice. And some of the very pressures that helped to contain inflation for the past two decades have been retreating.

In the years preceding the financial crisis, increasing globalisation and technological advances made it much easier for central banks to deliver both solid growth and low inflation. This was not the case in the 1970s, when stagnating productivity and rising commodity prices turned central bankers into scapegoats, not heroes.

True, back then, monetary authorities were working with old-fashioned Keynesian macroeconomic models, which encouraged the delusion that monetary policy could indefinitely boost the economy with low inflation and low interest rates. Central bankers today are no longer so naive, and the public is better informed. But a country's long-term inflation rate is still the outcome of political choices not technocratic decisions. As the choices become more difficult, the risk to price stability grows.

A quick tour of emerging markets reveals that inflation is far from dead. According to the International Monetary Fund's April 2014 World Economic Outlook [PDF], inflation in 2013 reached 6.2% in Brazil, 6.4% in Indonesia, 6.6% in Vietnam, 6.8% in Russia, 7.5% in Turkey, 8.5% in Nigeria, 9.5% in India, 10.6% in Argentina, and a whopping 40.7% in Venezuela. These levels may be a big improvement from the early 1990s, but they certainly are not evidence of inflation's demise.

Yes, advanced economies are in a very different position today, but they are hardly immune. Many of the same pundits who never imagined that advanced economies could have massive financial crises are now sure that advanced economies can never have inflation crises.

More fundamentally, where, exactly, does one draw the line between advanced economies and emerging markets? The eurozone, for example, is a blur. Imagine that there was no euro and that the southern countries had retained their own currencies – Italy with the lira, Spain with the peseta, Greece with the drachma, and so on. Would these countries today have an inflation profile more like the US and Germany or more like Brazil and Turkey?

Most likely, they would be somewhere in between. The European periphery would have benefited from the same institutional advances in central banking as everyone else; but there is no particular reason to suppose that its political structures would have evolved in a radically different way. The public in the southern countries embraced the euro precisely because the northern countries' commitment to price stability gave them a currency with enormous anti-inflation credibility.

As it turned out, the euro was not quite the free lunch that it seemed to be. The gain in inflation credibility was offset by weak debt credibility. If the European periphery countries had their own currencies, it is likely that debt problems would morph right back into elevated inflation.

I am not arguing that inflation will return anytime soon in safe-haven economies such as the US or Japan. Though US labour markets are tightening, and the new Fed chair has emphatically emphasised the importance of maximum employment, there is still little risk of high inflation in the near future.

Still, over the longer run, there is no guarantee that any central bank will be able to hold the line in the face of adverse shocks such as continuing slow productivity growth, high debt levels, and pressure to reduce inequality through government transfers. The risk would be particularly high in the event of other major shocks – say, a general rise in global real interest rates.

Recognising that inflation is only dormant renders foolish the oft-stated claim that any country with a flexible exchange rate has nothing to fear from high debt, as long as debt is issued in its own currency. Imagine again that Italy had its own currency instead of the euro. Certainly, the country would have much less to fear from an overnight run on debt. Nevertheless, given the huge governance problems that Italy still faces, there is every chance that its inflation rate would look more like Brazil's or Turkey's, with any debt problems spilling over faster price growth.

Modern central banking has worked wonders to bring down inflation. Ultimately, however, a central bank's anti-inflation policies can work only within the context of a macroeconomic and political framework that is consistent with price stability. Inflation may be dormant, but it is certainly not dead.

See the original article >>

Calm before the Storm

by Marc Chandler

The present is a fleeting moment between the past and the future. The economic news stream in the week ahead is light.  This will allow investors to contemplate last week's ECB announcements and adjust positions ahead of the critical events of the following week. These include the FOMC meeting, the launch of the TLTROs and the Scottish referendum. 

Draghi has once again demonstrated a boldness that surprised the market.  Recall his track record. He reversed Trichet's rate hikes almost immediately upon taking office.  He nearly single-handedly ended the existential crisis facing euro by aligning the ECB with the preservation of the monetary union.  He brandished what former US Treasury Secretary Paulson may have called a "big bazooka" (Outright Market Transactions), whose use has not been triggered, and may never be used.  He created a facility that lent cheap funds to member banks for three years, which helped drive down bond yields, and created the conditions that allowed financial institutions to return to the market. 

Facing lowflation, which aggravates debt servicing pressure, he led the ECB to do something that no other major central bank has done.  Namely charge banks for the privilege of leaving funds with the central bank. Even Japan, that wrestled with deflation for several years never took such a bold step. 

Now he is leading the ECB into a long-term asset purchase program that it seems clear the Bundesbank opposed. The debate about whether it is tantamount to quantitative easing is nonsensical. Whatever one wants to call it, the ECB balance sheet is going to expand, and the composition will change.  Let's not forget the Federal Reserve never called its program QE.  It was credit easing. 

The fact of the matter is that the institutional arrangement and rules of engagement are different for the ECB, a central bank that has no Treasury to work with, a single bond market like Federal Reserve or the Bank of England.  That the ECB will buy asset-backed securities and covered bond is not so different from the Federal Reserve buying mortgage-backed securities.  The Bank of Japan buys a wider range of assets, including commercial paper, corporate bonds, ETFs and  REITS,

It is not clear how much the ECB's balance sheet will expand. Draghi suggested one trillion euro, which would put it back near its peak.  In effect, last week, alongside the rate cuts, Draghi committed the ECB to an asset purchase program without providing much in the way of details. These will be announced in October, perhaps to give officials time to monitor the participation of the initial TLTRO facility. 

There are the usual naysayers.  Many think that EMU was flawed to begin with and whatever ails members can best be addressed by leaving the common currency.  They have consistently under-estimated Draghi's resolve.  In their economic determinism, they have under-appreciated the political commitment. Others argue it does not go far enough, though here too, the political constraints under which Draghi operates, is often not sufficiently appreciated.   The model is not the strong-leader variety seen at the Federal Reserve, the Bank of Japan and the Bank of England (the newest to independence, and least we forget former Governor King was outvoted more than once). 

The fact that Draghi has led the ECB over Germany and the Bundesbank's objections is noteworthy. It arguably strengthens the institution rather than weakening it.  On the other hand, it seems politically naive to expect Germany to attempt to assert its will.  However, there does not seem to be much public resistance to the fact that starting next year, the Bundesbank will not be voting at every policy making meeting, for which there will be fewer. 

The question many investors are asking is whether the ECB's measures will work?  The answer depends on what one means by work.  The anticipation of the TLTRO and ABS purchases has already helped drive peripheral interest rates lower.  The cost of business borrowing in Spain and Italy has trended lower in recent months. There has been a preliminary improvement in the second derivative of bank lending.  The decline in the euro and base effects suggest inflation may soon bottom.  The core rate already appears to be stabilizing. 

What about the real economy? High unemployment in many countries, including some core countries like France, depresses demand.  The French and Italian economies are particularly worrisome.  On the other hand, the contraction of the German economy in Q2 was a bit of a fluke in the sense that it most likely will not be repeated in Q3.  Last week's significant upside surprise from factory orders and industrial output will likely spilled over and help lift the region's aggregate figure that is due at the end of the week.

Demand might not be amenable to monetary policy alone.  This is behind Draghi's call on governments to use the fiscal flexibility.  Although some officials in France and Italy saw it as an endorsement for their case for greater forbearance from the EU, in the context, Draghi seemed to be addressing the creditor countries. He specifically called on France and Italy to (finally) implement the much-needed structural reforms. 

Perhaps because of the media's focus the subsequent conversation between Merkel and Draghi, many missed the Die Zelt story at the end of last week that reported a fiscal package to support the German economy is being cobbled together.  The measures include faster depreciation for capital expenditures to reduce taxes and spur investment, more public investment and the end of the tax on utility use.  It is not clear what will trigger the implementation of what Die Zelt referred to as "emergency measures."

Many observers also did not appear to recognize that Japan was moving down a similar path. Opinion has heavily favored the BOJ to expand what it has a called qualitative and quantitative easing.  BOJ Governor Kuroda has given no sign that this is something being contemplated. 

Monetary policy is doing its job.  Base money has exploded.  The yen has begun weakening again. Inflation, Kuroda says, is half way to its objective.  The immediate headwind to the Japanese economy was not monetary policy, but fiscal policy, in the form of the April 1 retail sales tax hike.   It seems only reasonable for a fiscal policy response, which is what we have advocated. 

Last week, Finance Minister Aso reportedly strongly hinted, for the first time, that the Abe government would submit a supplemental budget for the current fiscal year.  There were no details announced.  However, effecting psychology and arguably behavior, the retail sales tax is to be hiked in October 2015 from 8% to 10% (it was 5% at the start of the 2014).  We suspect that while anticipation of the first leg of the tax hike spurred consumption, the anticipation of the second leg will not.

It is as if the Q1 14 economic jump reflected the two-part tax hike over the next 18-months. Whatever real gain in wages may be forthcoming, they will be eaten away by the retail sales tax.   Neither Kuroda nor Aso has suggested that the next year's tax hike should be forgone, though Abe has indicated an official decision will be made before the end of the year.   

The immediate challenge for the UK is not economics.  Last week's non-manufacturing PMI jumped, and although the economy has slowed in late Q2 and into Q3, it continues to operate at a level that puts it at the top of the high-income countries this year.  That said, there are some preliminary signs that the house prices may be peaking.  

The July industrial and construction output figures due out in the week ahead (Tuesday and Friday respectively) are unlikely have much impact. The market's focus is on the Scottish Referendum on September 18.   The latest YouGov poll, published by the Sunday Times, shows the "yes" camp, which has experienced some momentum in recent weeks, has taken a narrow lead (51%-49%).  In order to do so, it overcame a 22-percentage point deficit.  It is the first poll that puts the independents ahead.  This will weigh on sterling when trading opens in Asia.  

Turning to the US, the disappointing jobs growth was duly shrugged off by investors.  It is historically subject to significant revisions, and as a signal of the overall economy, it is contrary to most of the other economic data.  The economy appears to be expanding at a little faster than a 3% pace here in Q3. 

There are two reports in the week ahead that will attract attention.  The JOLTS (Job Openings and Labor Turnover Survey) has taken on somewhat greater significance since Yellen has guided investors away from the unemployment rate and toward a broader range of metrics.  At the end of the week, the US will report retail sales.  A 0.4% headline is expected where the surge in auto sales is checked by the decline in gasoline prices.   The measure used for GDP calculations, excludes auto, gasoline and building materials rose 0.1% in July, and the consensus expects a 0.3%-0.4% rise in August. 

In terms of Fed policy, we do not attach much value on the string of high-frequency economic data. The Fed will conclude QE next month, and a rate hike is still more than six months out.   The immediate focus is on next week's FOMC statement and whether it will soften or drop references to a "considerable period" that rates will remain low.   This would not be surprising, but there need not be a sense of urgency, and this may be expressed by referring to the importance of amorphous "data."

The inability of the bond market to rally on the back of weakest job growth of the year is a potential signal that US yields may have bottomed.  This risk, in turn, may point to a consolidation or pullback in the US equity market.  The BOJ's ongoing operations and the ECB's measures more than offset the end of QE in terms of global liquidity.  In the current environment, liquidity is a key driver, and my continue to underpin asset prices, and risk-taking more generally. 

See the original article >>

UK In "Full Panic Mode", Rains Brimstone, Bribes On Scotland As "Yes" To Independence Poll Crosses 50%

by Tyler Durden

All pundits who over the past few months have been saying the possibility of Scottish independence as a result of the September 18 ballot, is at best a pipe dream got a rude wake up call overnight, when Scottish YouGov poll for the Sunday Times put the "Yes" (for independence campaign) on top for the first time since polling began, with No below the majority cutoff line for the first time, at 49, when undecided voters are excluded, and even when including undecideds "Yes" is still ahead by two points at 47-45. As the Spectator reports, "in the space of four weeks, "No" has blown a 22-point lead."

According to Bloomberg, "the shift to an outright lead for supporters of independence may further roil financial markets after the pound weakened last week when the pro-U.K side’s support narrowed to six percentage points." Granted, today's news may be GBP-negative, but Bloomberg seems to still operate under Old Normal assumptions whereby any news, bad or gad, is anything but great for stocks. Expect the S&P to hit new all time highs on this latest development which will be promptly "priced in" and spun as pent-up reunification.

The usual commentariat, which until recently was swearing the Yes vote has zero chance, is stunned :

“For a positive message to catch up so much in a month is totally unprecedented,” said Matt Qvortrup, a senior researcher at Cranfield University in England and author of “Referendums and Ethnic Conflict.” “This is pretty revolutionary stuff in referendum terms. We’re ringside to history.”  The Sept. 18 ballot on Scottish independence is dominating the U.K. after door-to-door campaigning on both sides intensified last week and as traders and investors no longer rule out a dramatic victory for nationalist leader Alex Salmond."

Others were more direct and to the point:

The Spectator's Fraser Nelson had this to say:

Make no mistake, the UK government will now be on full panic mode. This eclipses everything: the country is 12 days away from dissolution. We’re seeing an almost perfect rerun of what happened in Quebec in October 1995 when the ‘yes’ pulled into a lead at the last minute. Then, Canadians (who had ignored the debate until then) suddenly took notice, realising that their country was falling apart. Seven days before the poll, a massive unity rally in Montreal was organised (details here) by a fisheries minister acting on his own initiative. God knows such initiatives are needed now.

UK politicians, naturally, were not happy, starting with the head of the UK Treasury, Chancellor of the Exchequer George Osborne, for whom any change from the status quo is very much unwelcome:

Chancellor of the Exchequer George Osborne said a program for increased devolution to Scotland if it votes No, offering Edinburgh more control over taxes, public spending and social policy, will be announced in the “next few days” as the London government responds to the shift in the polls.

“It’s clear that Scotland wants more control over the decisions that affect Scotland,” Osborne said in a televised BBC interview. “The timetable for delivering that will be put into effect the moment there is a ‘no’ vote in the referendum. Then Scotland will have the best of both worlds. They will both avoid the risks of separation but have more control over their own destiny, which is where I think many Scots want to be.”

Osborne also reiterated his opposition, which is shared by all major parties in Westminster, to currency union with an independent Scotland. “No ifs, no buts, we will not share the pound if Scotland splits from the rest of the U.K.,” he said.

His predecessor quickly chimed in: enter Alistair Darling.

‘The polls may conflict, but the message I take from them is clear: If you want Scotland to remain part of the UK family you have to vote for it on 18 September. Separation is forever. These polls can and must now serve as a wake-up call to anyone who thought the referendum result was a foregone conclusion. It never was.  It will go down to the wire. Now is the time to speak up and speak out.

‘We are hitting the streets, knocking on the doors, making the calls in unprecedented numbers and we are hearing the people of Scotland respond positively to our vision of Scotland securing the best of both worlds. That means more powers for Scotland without taking on all the risks of separation.

‘We relish this battle. It is not the Battle of Britain – it is the battle for Scotland, for Scotland’s children and grandchildren and the generations to come. This is a battle we will win.’

It only got more panicky from there:

With campaigning in its final days, the opposition Labour Party is trying to keep its supporters onside in a traditional heartland and vote against independence. Former Prime Minister Gordon Brown, now a Labour legislator, will tour the country making the case for the union.

“I want to share our resources with the rest of the United Kingdom, and that will mean better pensions, better health care, more jobs and better security,” Brown, a Scot, said in an interview with Sky News. “Whatever government is in power temporarily, you’ve got to look at the long term picture. You’ve got to look 50 years ahead, 100 years ahead. This is an irreversible decision.”

But perhaps realizing that dazzling them with glass beads and cheap promises won't work, UK's Prime Minister went "all the way" and pulled a nuclear Hank Paulson, threatening Scotland with outright death and destruction if it votes to secede. From Bloomberg:

Scotland will be more vulnerable to terrorist attacks in a “very dangerous and insecure world” if it votes for independence on Sept. 18, U.K. Prime Minister David Cameron said.

Being part of a union gives Scots the protective benefits of being part of a larger country, Cameron told reporters at the end of the North Atlantic Treaty Organization’s summit in Newport, Wales, yesterday.

With terrorist threats and other threats, isn’t it better to be part of a United Kingdom that has a top-five defense budget, some of the best intelligence and security services anywhere in the world, that is part of every single alliance that really matters in the world in terms of NATO, the G-8, the G-20, the European Union, a member of the security council of the UN?” Cameron said. “All those networks and abilities to work with allies to keep us safe. Isn’t it better to have those things than separate yourself from them?”

Because how else can Scotland protect itself than by aligning with the nation that, together with the US, provided weapons to these "terrorists" in the first place.

And while everyone else demanded a continuation of the status quo, and is "stunned" at the Scottish people for not appreciating the "clear benefits" that a union provides, one person who was absolutely delighted was Scottish National Party leader Alex Salmond who said he expects more the 80 percent turnout in independence referendum on Sept. 18 after a poll for the first time gave a lead for his party’s ‘Yes’ campaign. “We’re encouraged by the clear panic in the ‘No’ campaign,” Salmond said in a BBC interview.

"They’ve failed to scare the Scots, now they’re trying to bribe us. That won’t work either."

But they'll keep on trying: just recall "Scottish Independence 'Yes' Vote Is A "High Risk" Event, Citi Warns." Sure enough, here comes Citi with the postmortem released moments ago, with a note titled: "Sterling Is Set for Negative Surprise After Scottish Poll"

  • Recent history would suggest that a move for the pound toward 1.56 vs USD or lower cannot be excluded if Scotland leaves the union, Citigroup writes in client note today.
  • Outright lead in pro-independence campaign in latest YouGov survey will keep investors anxious about the outcome of the referendum on Sept. 18
  • Referendum authorities may conduct more polls in remaining week and a half; fact is, of the 86 polls conducted since 2012, only two put ’’Yes’’ vote in the lead
  • Better U.K. data this week, such as July industrial and manufacturing production, may be of little comfort
  • Carney testimony to Treasury committee hearing on Sept. 10 could highlight political and economic risks for GBP from the referendum

And from Berenberg:

  • Risk that Scotland will vote for independence is real and rising; recent movements have been further and faster than anticipated, Rob Wood, U.K. economist at Berenberg writes in client note.
  • Still expect a no vote; yes campaign lead is within margin of error and latest poll is not matched in other polls, could be an outlier
  • Scotland is re-running the 1995 Quebec independence referendum, which went down to wire before ending in tight vote against splitting from Canada
  • A Yes to independence could cause serious short-term pain over uncertainty on currency, EU status; Scotland may be forced to austerity
  • May raise risk of U.K. exit from EU without pro-EU Scotland
  • A close No vote would keep alive chances of another referendum in 5-10 years, could mean additional powers for Scotland, kickstarting changes to U.K. regional governance

Etc.

Of course, everyone knows that the end result of the "vote" will be arbitrated by the proverbial, if not literal Diebold, which we somehow doubt will allow such an earth-shattering outcome as Scotland being allowed to determine its fate, to take place. Because if they can, suddenly it becomes an option for the rest of Europe, a continent where as Mario Draghi has explained time and again, there is far too much political capital invested in allowing the peasants to decide their own fate.

In the meantime, however, what better excuse than to grab the popcorn, sit back and enjoy an all-time classic.

See the original article >>

A Macro Tailwind For Stocks

By James Picerno

There’s a growing chorus of warnings from the punditocracy that the US stock market is at risk of correcting. It’s easy to understand what’s motivating the advice: a powerful bull market that’s been pushing higher for five years with few sustained declines of late. The market’s also fairly valued, perhaps over-valued to a degree. It stands to reason that the longer the market rises, the bigger the risk that equities may suffer a sizable setback. Adding to the potential for trouble: various geopolitical risks (think Ukraine and the ISIS threat in Iraq) and a new phase of macro weakness in Europe. No one should dismiss these factors, but for the moment the US market draws strength from a fundamental source: economic growth.

A stock market that corrects, perhaps sharply, isn’t unusual in a period of economic expansion and so this remains a possibility. The S&P 500 touched an all-time high on Friday, which means that the arrival of surprisingly bad news going forward may be a tempting excuse to sell. But any slide in equity prices will probably be limited if the macro trend remains positive. Indeed, the market’s been climbing in recent years, albeit with temporary corrections, because the economy has been recovering. It’s been an uneven and slow recovery by many standards relative to history, but Mr. Market’s primary focus is one of a binary nature: Is the economy expanding or contracting? To the extent that the data favors the former, prices will have a potent source of support. As such, any drop of consequence will likely be a buying opportunity rather than a prelude to an extended bear market.

The challenge, of course, is deciding in real time if the economy’s still on a growth track. For the moment, however, the analysis is relatively easy, thanks to a wide spectrum of encouraging numbers. The monthly profile of US data through July certainly looks upbeat, as I discussed a few weeks ago. Meantime, this week’s initial peek at the August trend, although preliminary, only strengthens the view that macro risk is low. Indeed, the ISM Manufacturing Index jumped to 59.0 in the August reading, a three-year high.

Positive momentum, in short, appears to be quite healthy.

“The manufacturing sector is just on fire right now,” Brian Jones, an economist at Societe Generale, tells Bloomberg. “You’ve got increased demand for workers, and the more people working, and the more money they are making, the more money they’ll spend.”

The stock market has been anticipating no less for some time. The crucial fuel for any bull market in stocks is economic growth, and so the buoyant reports in recent months for most of the key indicators has encouraged buying. At some point the cycle will turn—the catalyst will be a weakening of the macro trend. History suggests that there will be plenty of false signals between now and then and so separating the head fakes from the genuine article is essential. That’s harder than it sounds for several reasons, such as unexpected data revisions, short-term noise, and other factors. Rest assured that the media will further complicate the task with an array of conflicting headlines and vague and largely unsubstantiated claims by various self-appointed experts–such as this gem, for instance. Confusion, it’s safe to say, will continue to reign supreme as a general proposition when you use the usual suspects as a resource.

sp500.04sep2014

Convincing signals that the business cycle is turning lower will arrive eventually, but after the fact. The challenge is keeping the delay to a minimum. Clarity on this front won’t come easy–it never does. The only solution is to analyze frequently and across a broad, carefully selected mix of indicators.

For now, it looks like the trend is our friend, perhaps to an increasingly bullish degree as far the macro data goes. That doesn’t mean that a bull-market correction can’t squeeze us in the meantime. But until and if the economy makes a major U-turn, the fundamental driver of higher prices still looks intact until further notice.

See the original article >>

QE3's Ominous End Looms For Stock Markets

by Adam Hamilton

Summary

  • The Fed’s third quantitative-easing campaign is due to end in late October. QE3 has massively boosted the stock markets, driving their extraordinary levitation of the past 18 months or so.
  • Once QE3 ends, so does the Fed’s implied backstop of stocks. Any selloff can’t be met with rate cuts thanks to ZIRP, and a new QE4 is extremely risky politically.
  • So the overdue stock-market selling pressure is likely to cascade with the Fed no longer available to arrest it, like the major corrections after QE1 and QE2 ended.

The Federal Reserve's third quantitative-easing campaign is on track to wind down in late October. At that point the Fed will likely stop printing new money to buy bonds, a sea-change shift with ominous implications for the stock markets. Their entire surreal levitation during QE3 mirrored the huge growth in the Fed's balance sheet from QE3's bond monetizations. When they cease, another major selloff is likely.

QE3's impact on the global financial markets has been vast beyond belief. The Fed launched QE3 in September 2012, just before the important United States elections. This goosed the US stock markets in that critical final couple months ahead of the elections, right when they were on the verge of selling off dramatically. Odds are very high that the Fed's brazen market manipulation gave the election to Obama.

In the 28 presidential elections since 1900 prior to that 2012 one, the stock markets rallied in September and October 16 times. The incumbent party won 15 of those elections! And during the 12 times when the stock markets fell in September and October, the incumbent party lost 10. The Fed choosing to launch a stock-market-boosting QE campaign in those pre-election months forced stock markets higher.

If the S&P 500 (SPX) had dropped as it was set to do in September and October 2012, Obama would've almost certainly been a one-term president. The Fed's colossal market and political manipulation was no accident. Since QE2, Republican lawmakers had been highly critical of the Fed's money printing to buy bonds. The low interest rates that spawned enabled Obama's record debt-fueled spending binge.

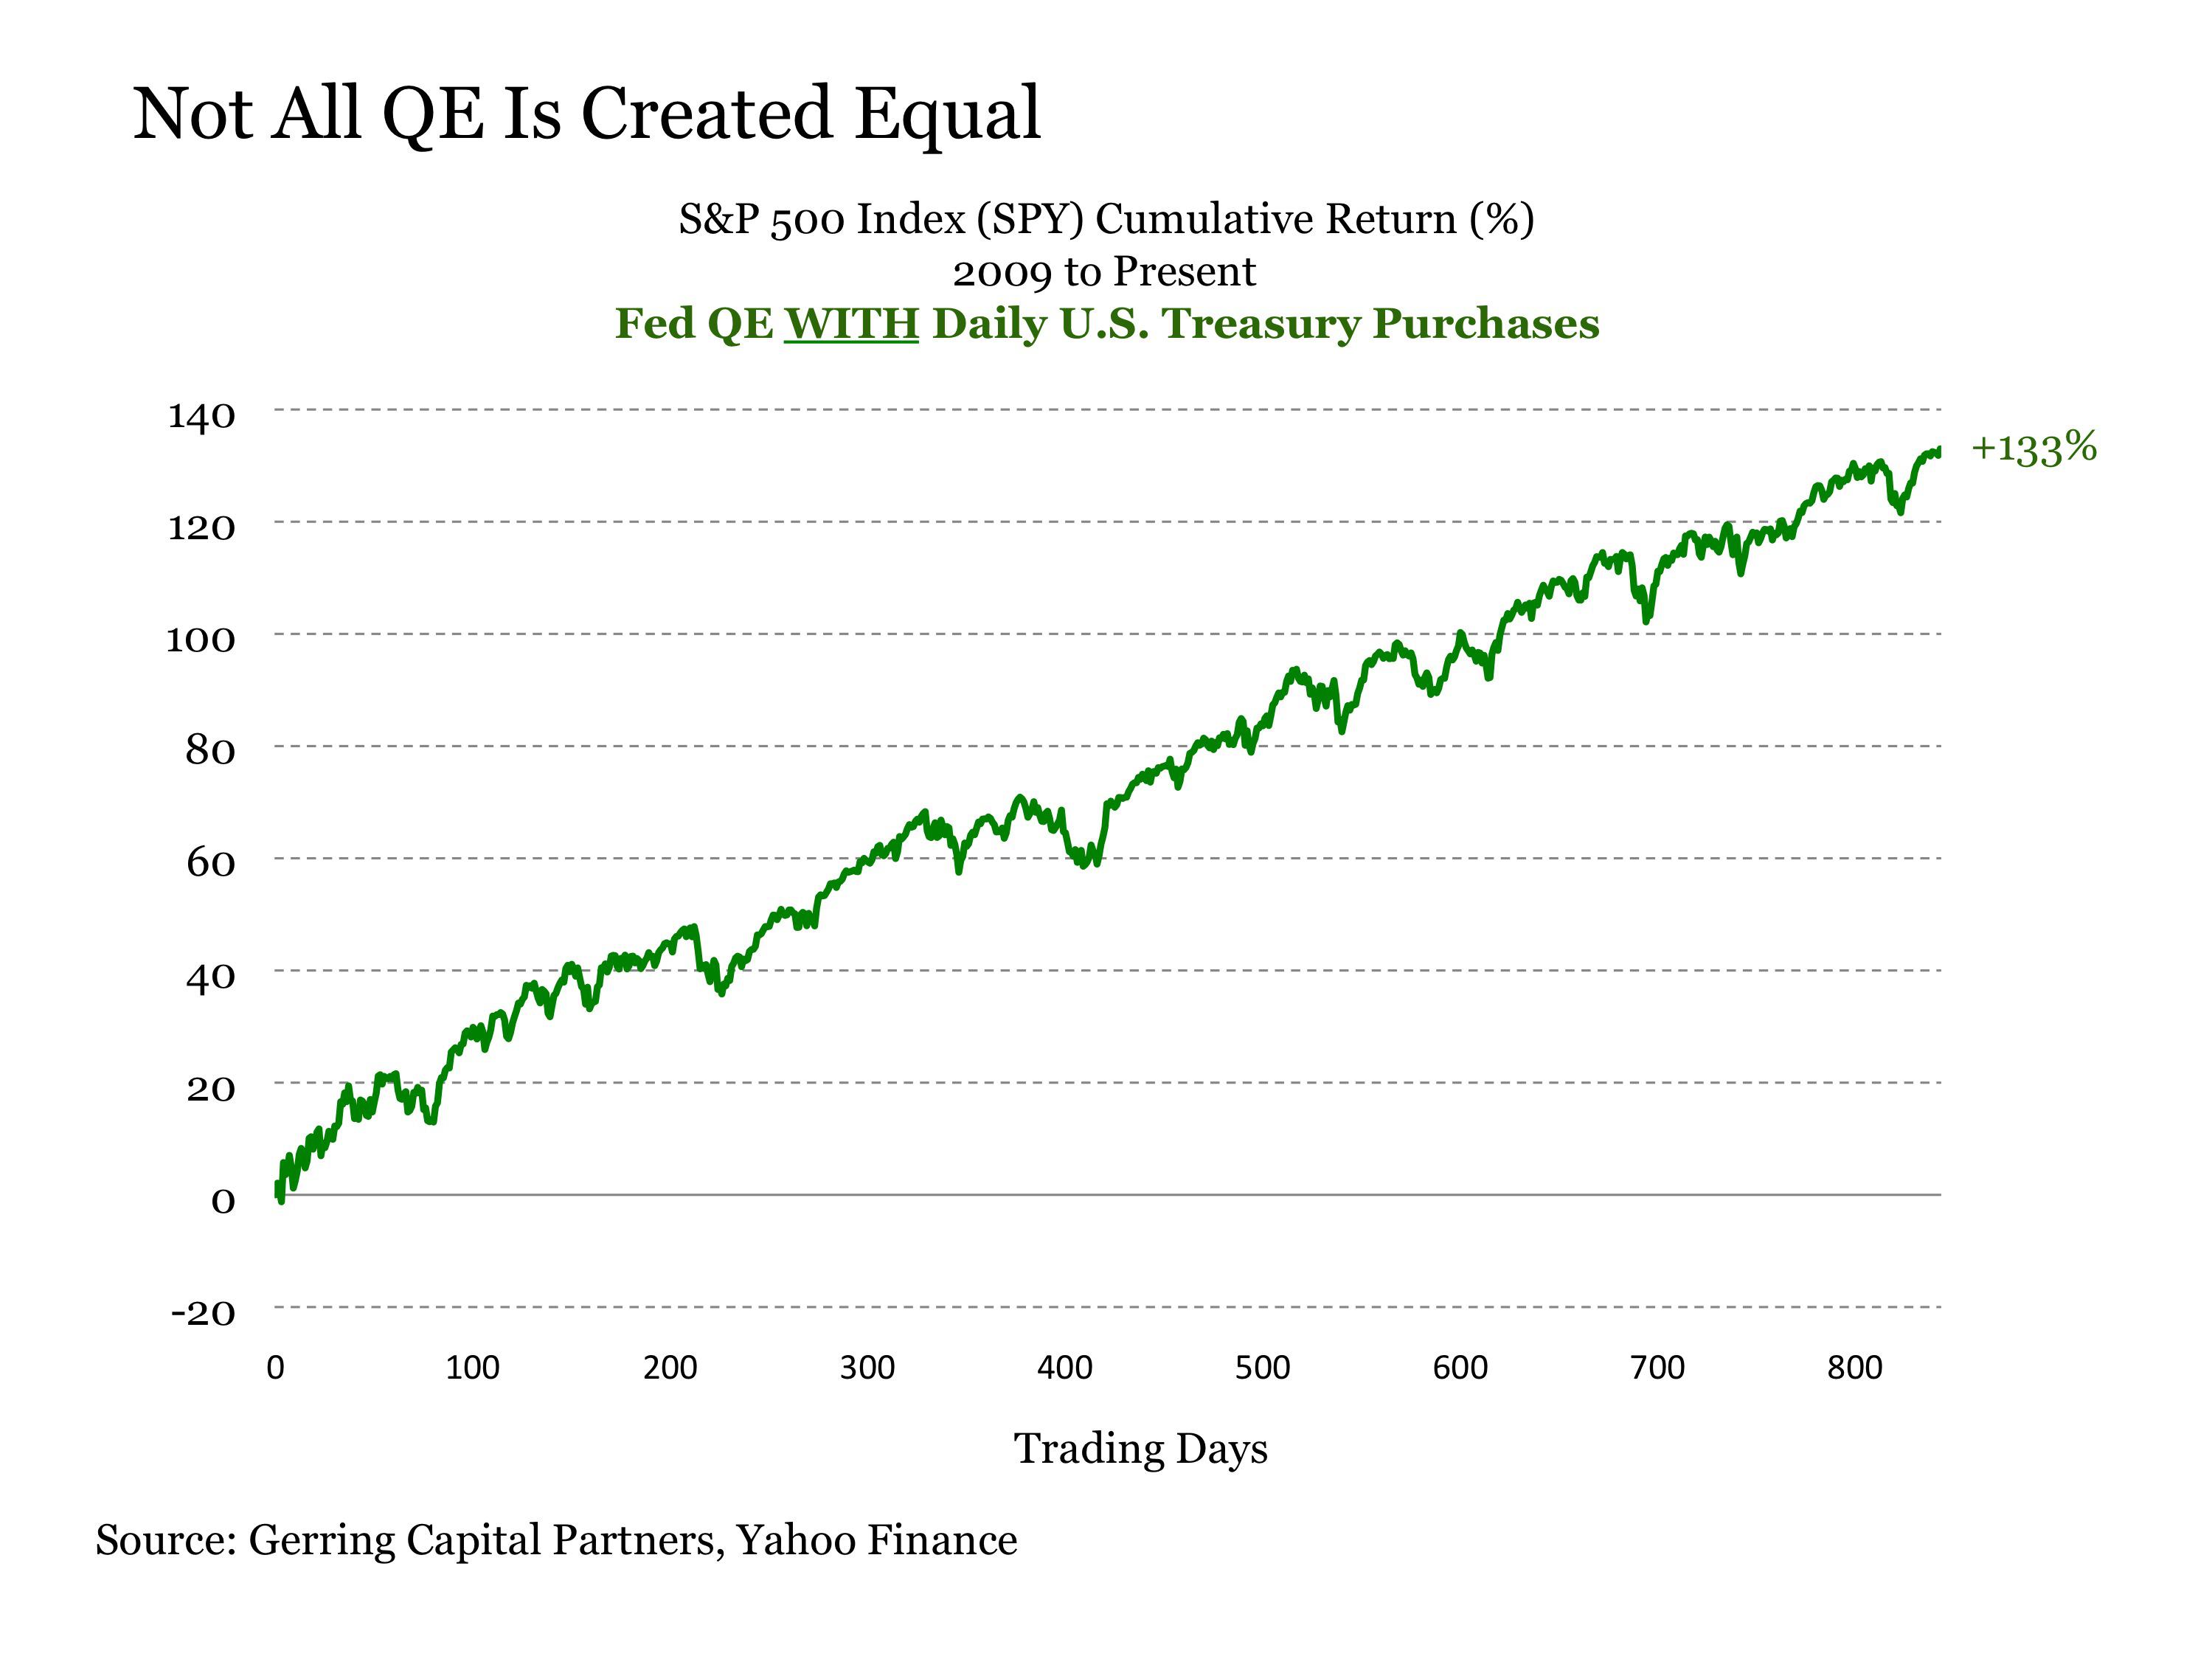
Since the Fed faced serious challenges to its independence all the way up to its very existence from a Republican president and Congress, it massively intervened in the markets to sway an election. And QE3 just got worse from there. The Fed expanded it to include direct monetizations of US Treasuries a few months later in December 2012. That forced rates lower, farther fueling Obama's epic deficit spending.

QE3 was far different from QE1 and QE2, which were finite from their births. QE3 was the Fed's first open-ended debt-monetization campaign, with no prescribed limits. This potentially unlimited scope of QE3 helped create an exceedingly unfortunate side effect in the stock markets. Since QE3 had no defined end, stock traders figured it would be around to backstop stock markets more or less indefinitely.

Led by uber-inflationist Ben Bernanke, the Fed's dovish communications fanned this popular belief among traders. Over and over during QE3 the Fed implied that it was ready to act, in effect to increase the scale of QE3's monthly money printing to buy bonds, if the stock markets slid. This incessant Fed jawboning left stock traders utterly fearless, as they figured the Fed would arrest any major stock-market selloff.

So every dip was quickly bought, leading to the stock markets soaring. The SPX blasted 29.6% higher in 2013, the only full year of QE3! And this flagship index is up 39.5% since QE3's birth. And it wasn't like the stock markets were low before the Fed hatched its QE3 scheme. As of the day before, the SPX had powered 112.3% higher over 42 months in a very large cyclical bull. Stock markets were already lofty.

Healthy stock bulls take two steps forward followed by one step back, major uplegs are followed by sharp corrections. These corrections, SPX selloffs between 10% and 20%, are essential as they help keep sentiment balanced. They bleed off greed before it grows too excessive and pulls too much future buying forward, killing the bull. The Fed's implied backstop with QE3 short circuited this natural and crucial process.

When QE3 was launched just before those November 2012 elections, it had already been 11 months since the end of the last SPX correction. Typically they happen about once a year or so on average. And since QE3's debt monetizations have been in force, the necessary sentiment-rebalancing selloffs have become smaller and farther between. Today the SPX is up to an insane 35 months since its last correction!

Provocatively the two previous full-blown corrections of this mighty cyclical stock bull cascaded right after QE1 and QE2 ended. When QE isn't in force, the Fed's implied backstop vanishes. So traders are not as quick to buy stocks indiscriminately, and sellers aren't scared away. The Fed's Federal Open Market Committee is on track to end QE3 at its upcoming October 29th meeting, an ominous omen for stocks.

Without QE3, the Fed can no longer backstop stock markets or even claim it can do so. Thanks to Ben Bernanke's disastrous zero-interest-rate policy that's robbed savers blind since December 2008, the Fed can't cut interest rates if stock markets fall. And ramping up a QE4 is very unlikely if the Republicans regain control of the Senate in this year's elections, as they could potentially vote to revoke the Fed's very charter!

The implications of a post-QE world are vast for the stock markets. To better understand why, you need to grasp the mammoth scope of the Fed's third quantitative-easing campaign. This chart shows the Fed's balance sheet since 2008 when QE was initially born. This data is stacked within the Fed's total balance sheet (orange), with US Treasuries (red) sitting on top of mortgage-backed securities (yellow).

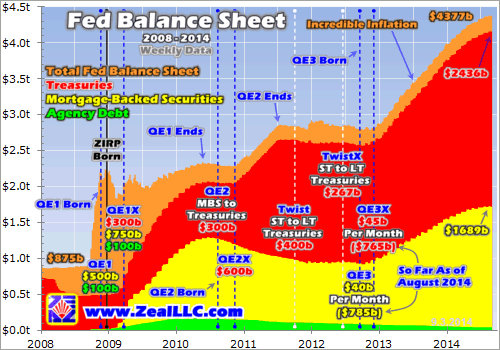
I've written comprehensive essays outlining the history of QE, what the Fed did when and why it decided to act. But for our purposes today, let's focus on the big picture. Prior to QE1's birth during 2008's once-in-a-lifetime stock panic, the Fed's balance sheet averaged $875b in the first 8 months of that year. Today that number has ballooned an astounding 5.0x to $4377b. QE has quintupled the Fed's balance sheet!

When central banks buy bonds, they do so by first creating the money necessary for the purchases out of thin air. It is pure inflation. And when bonds are bought with this new money, it is transferred to the bond sellers to spend immediately as they see fit and the bonds are transferred to the Fed's balance sheet. So the $3502b in bonds the Fed has purchased so far equals the money it has printed for QE.

The Fed's modus operandi for its three QE campaigns, and an intervening "twist" operation in the middle, has been very consistent. The Fed, ever cognizant of political pressure and withering attacks from Republicans who hate money printing, first launches each campaign at a relatively modest scope. And then soon after once the initial political storms blow over, it greatly expands the scale of its bond buying.

QE1 initially started at $600b, but then was soon expanded to a staggering $1750b total. Soon after it ended, QE2 started at $300b but was shortly tripled to $900b. Twist, the Fed selling the shorter-term Treasuries it held to buy longer-term ones to manipulate long interest rates lower, was also expanded. And QE3 followed this template, $40b in monthly buying shooting up to $85b total just a few months later.

QE3 was unique in its open-endedness, the Fed set no limits to its size up front as it did with QE1 and QE2. QE3 ended up running full-steam for all of 2013, boosting the SPX to its massive late-bull gain last year. But last December, the Bernanke Fed finally decided it better start slowing its epic monetary inflation before the inevitable resulting price inflation got out of control. So it started "tapering" QE3.

At every meeting since then, the FOMC has continued to slice away another $10b of new monthly QE3 buying starting the following month. And with QE3 down to just $25b per month today, the Fed only has room to do two more tapers since it has talked about taking the final $15b away at one time to avoid an undue trader fixation on that last $5b. And that full QE3 tapering should happen at the FOMC's late-October meeting.

At that point, QE3 will have grown to $800b in mortgage-backed securities and $790b in Treasuries purchases for a total of $1590b. This won't quite reach QE1's supreme $1750b girth, but it sure dwarfs QE2's $900b. It's the Treasuries portion of QE3 that is the key component. That ran $300b in QE1 and $600b of new buying in QE2, so QE3's massive $790b of buying easily takes the QE Treasuries crown.

All market interest rates key off of the "risk-free" yields of US Treasuries. So when the Fed prints money to buy Treasuries, it effectively pushes down interest rates for the entire markets as its artificial demand forces Treasury yields lower. In addition, the money printed and paid to the Obama Administration to buy Treasuries is immediately spent. So it is directly injected into the real economy, driving price inflation.

The Fed has been the dominant buyer of US Treasuries during the QE era since the 2008 stock panic, purchasing $1956b worth. This works out to just over 25% of all the Treasuries issued since the end of the US government's fiscal-year 2008! Without the Federal Reserve buying up a quarter of all the debt the Obama Administration's extreme overspending has burdened America with, rates would be far higher.

The extraordinary stock-market levitation spawned by the Fed's implied backstopping during QE3 blasted US stocks up to dangerously-high valuations. And the primary reason euphoric stock traders have rationalized them away is bond yields remain super-low thanks to the Fed's brazen interest-rate manipulations. But once QE3 ends, so does that downward pressure on Treasury yields and interest rates.

As rates rise, which is inevitable with a quarter of the world's demand for Treasuries vanishing, stocks are going to look more and more overvalued relative to bonds. That alone is going to eventually lead to some serious selling pressure reemerging in the stock markets. And once a material selloff gets underway and the Fed's implied backstop through QE3 is gone, that overdue selling is going start cascading.

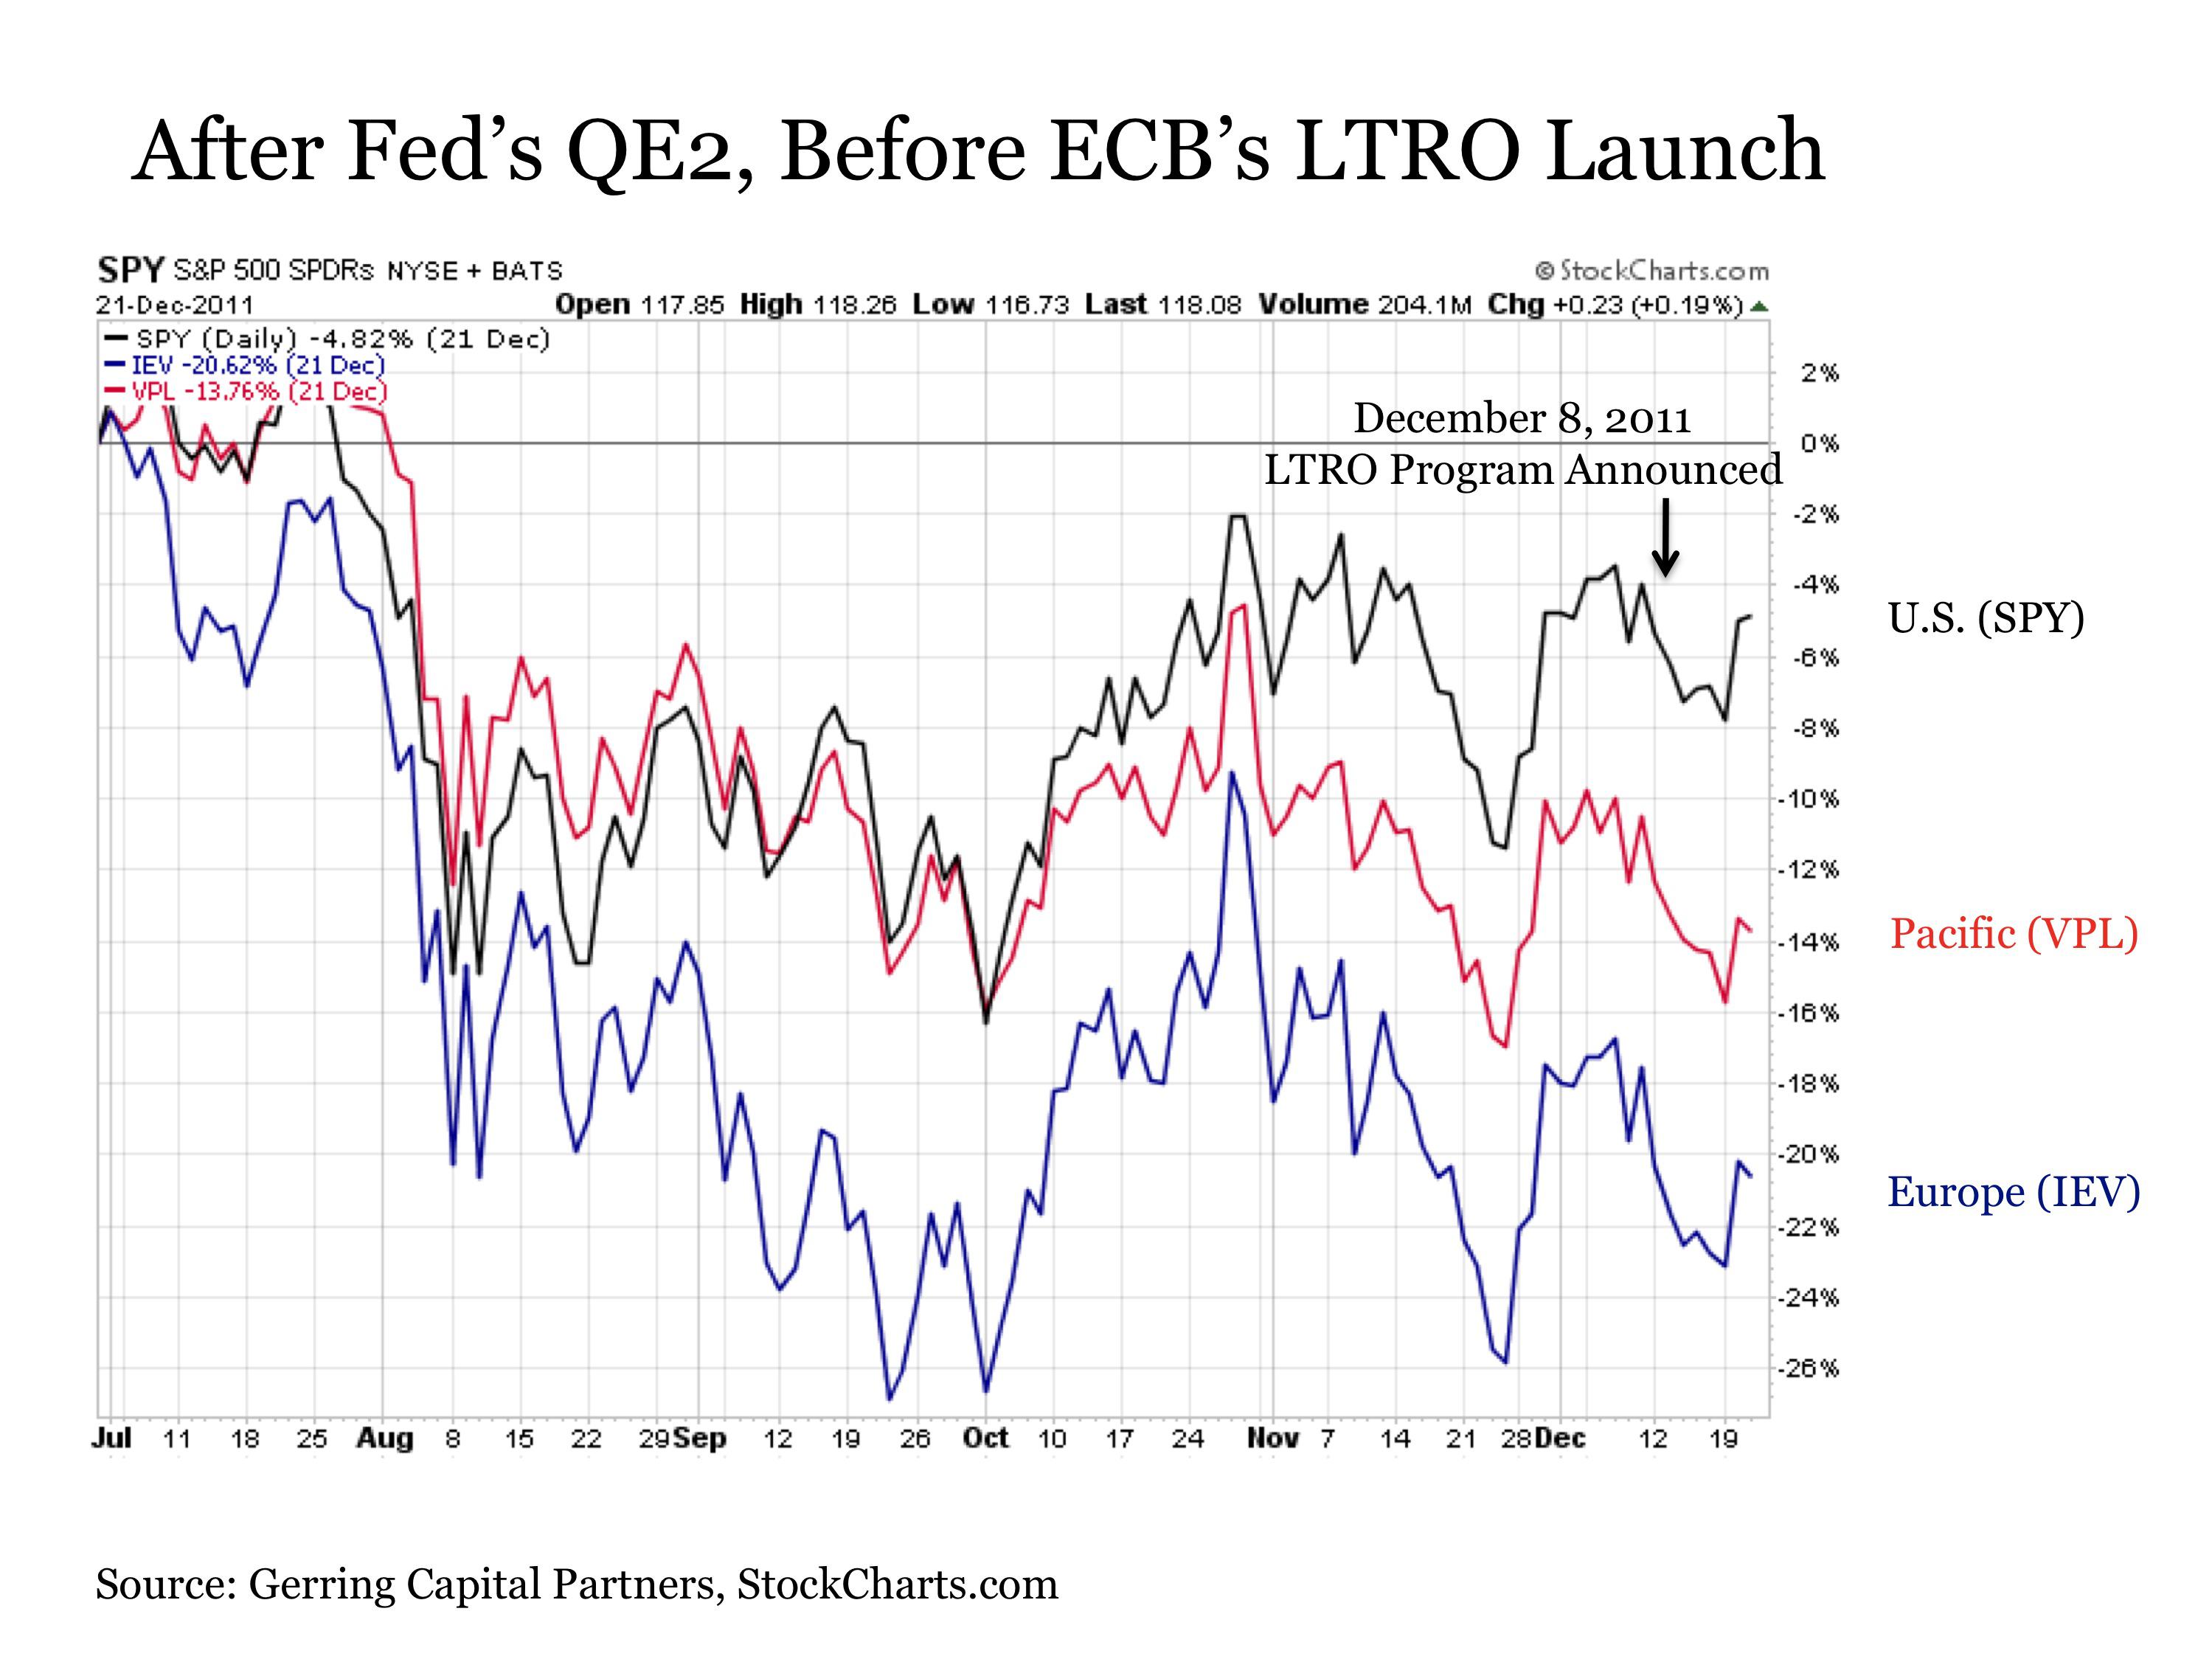
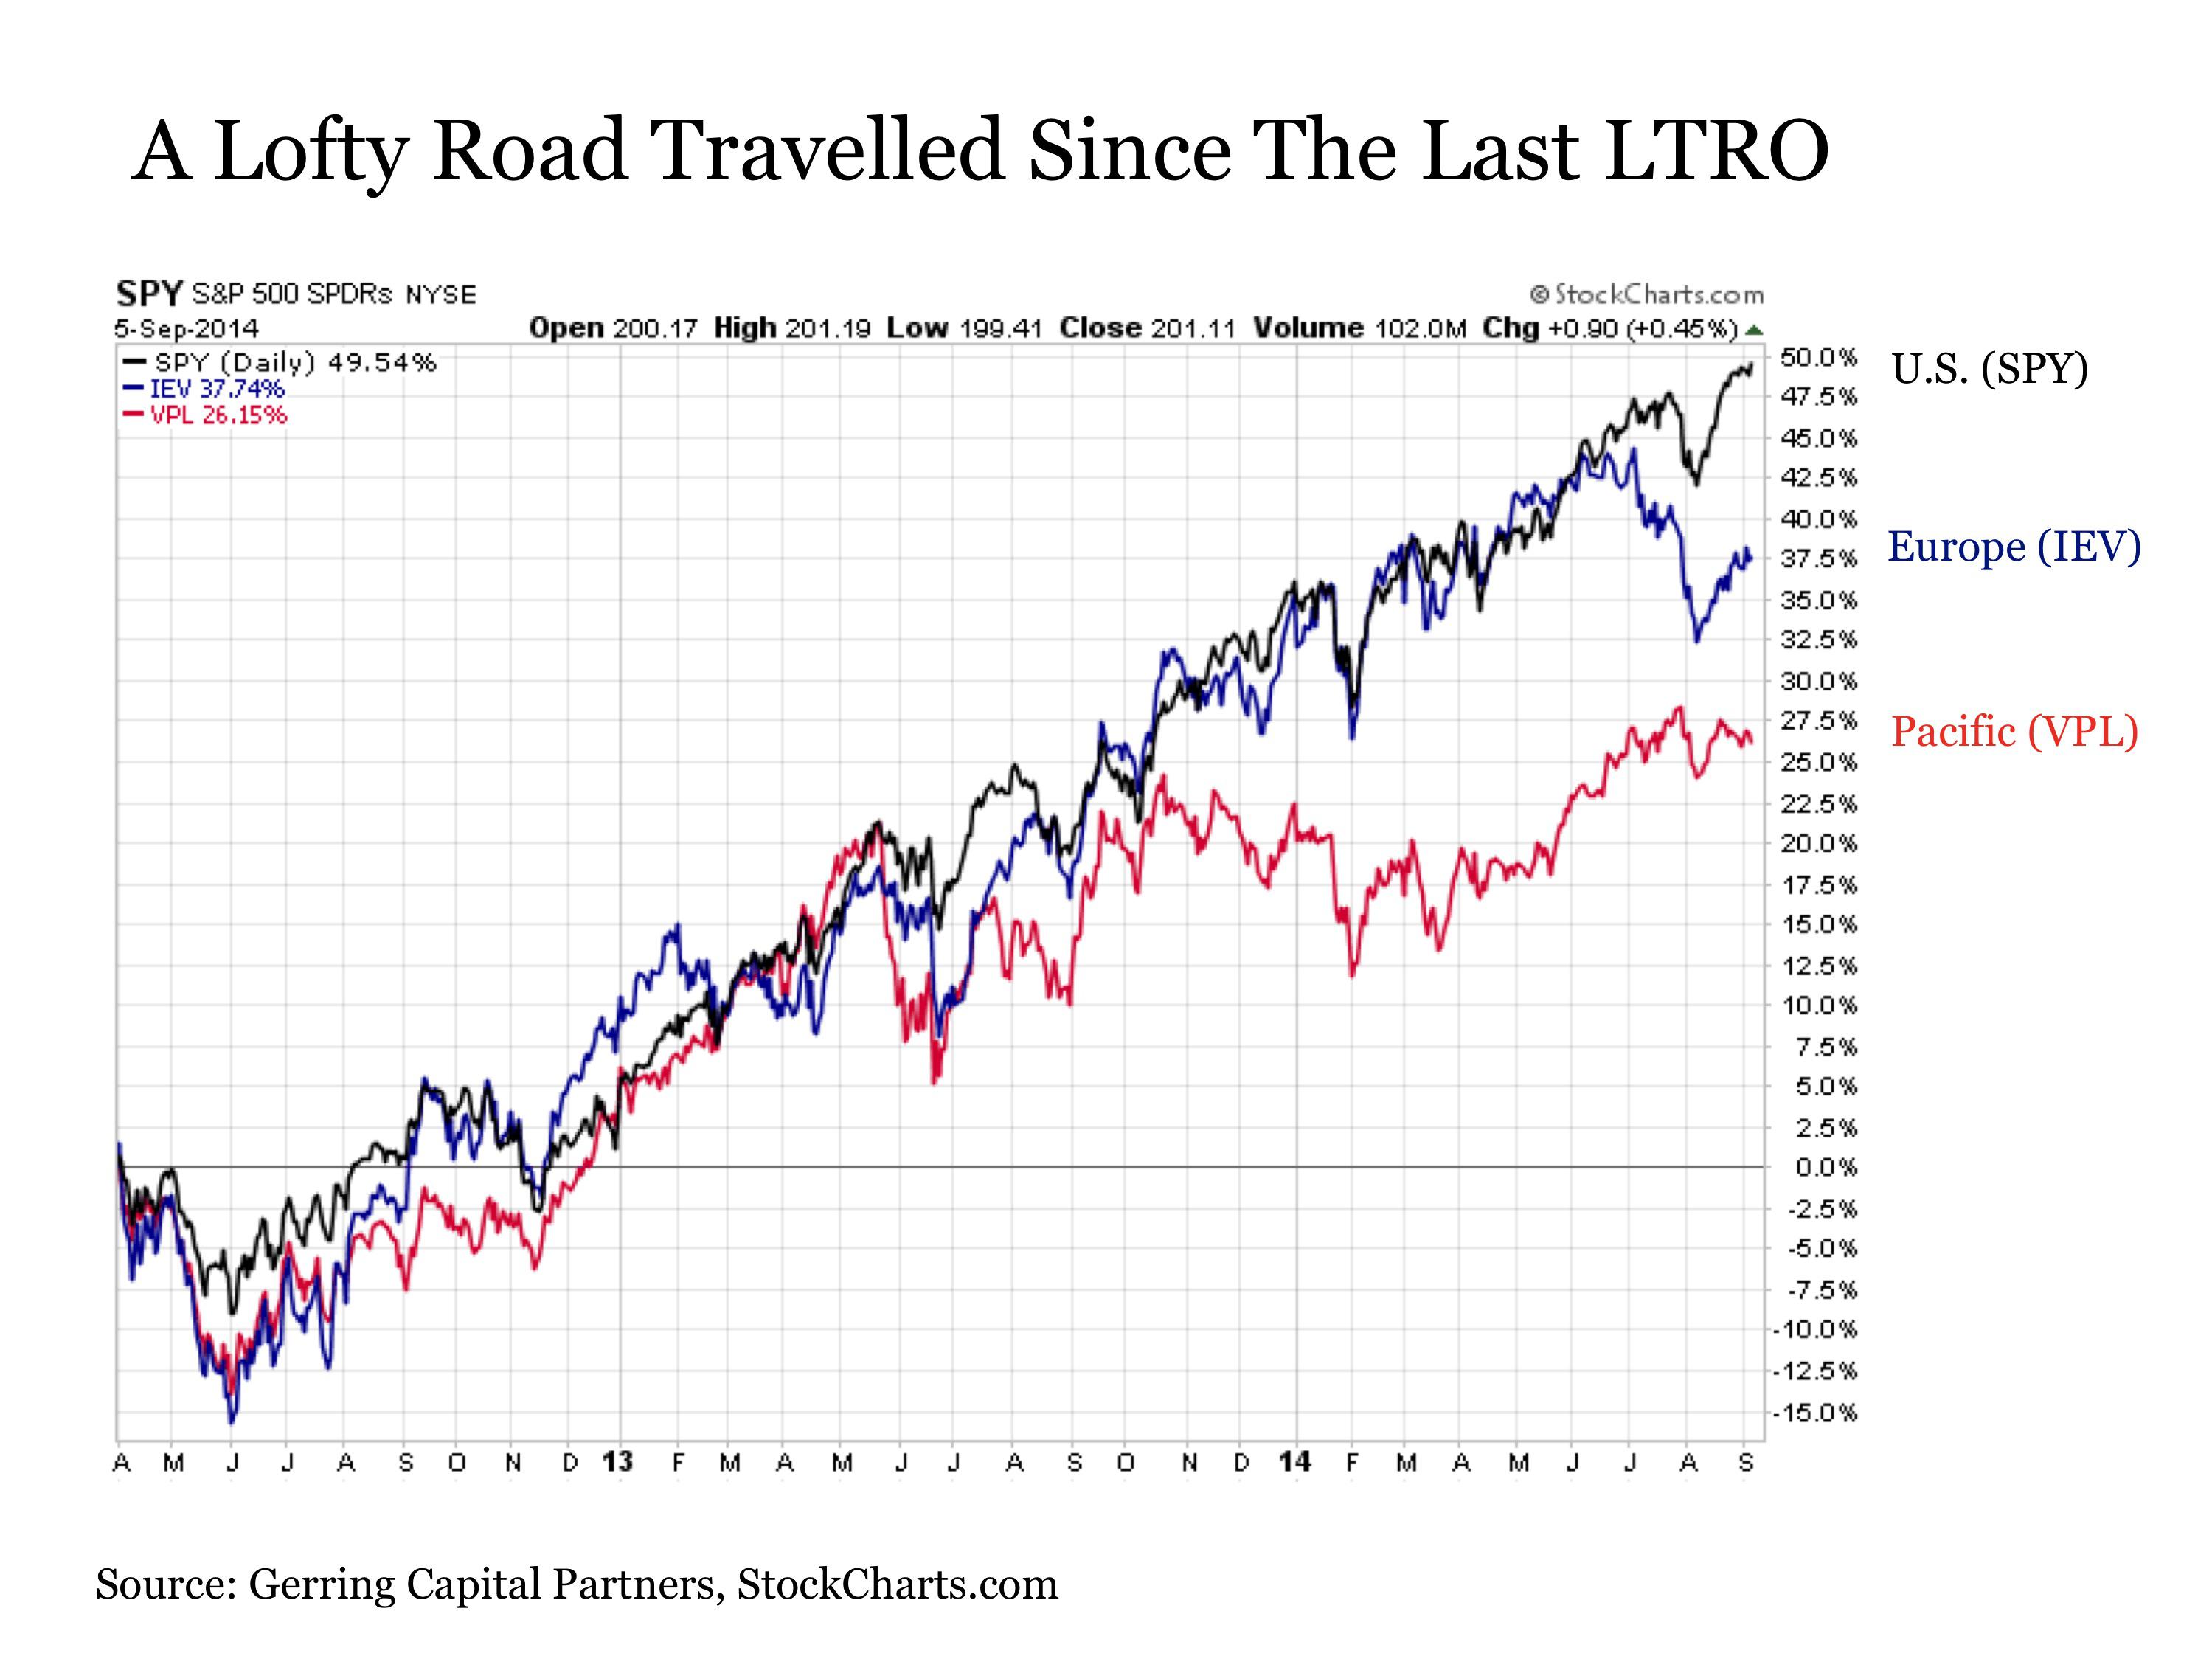
Prudent investors and speculators today don't have to guess about what the end of QE3 means for the lofty Fed-inflated US stock markets. We have the precedent of the ends of QE1 and QE2. This next chart looks at the flagship S&P 500 stock index superimposed over the Fed's balance sheet. And out of all the many thousands of charts I've created over the years, this probably tops the heap as the scariest.

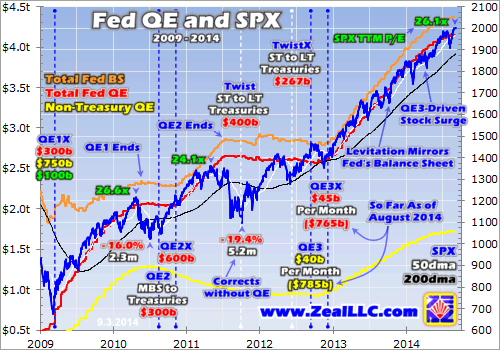
The stock markets are forever cyclical, so after the last cyclical bear that climaxed after 2008's stock panic a new cyclical bull was justified and inevitable. I was one of the few contrarians who called for that bull right at the March 2009 bottom when bearishness and despair were suffocating. Nevertheless, this bull had a very high correlation with the Fed's balance sheet. When QE was underway, stocks powered higher.

But whenever the Fed tried to wean complacent traders off the QE drug, the stock markets corrected hard. Right as QE1's massive bond monetizations were ending, the SPX tumbled 16.0% in 2.3 months in this bull's first correction. Provocatively the stock markets weren't able to regain their footing until the Fed quickly stepped in to announce QE2. The timing of that mushroomed the Fed-backstopping-stocks notion.

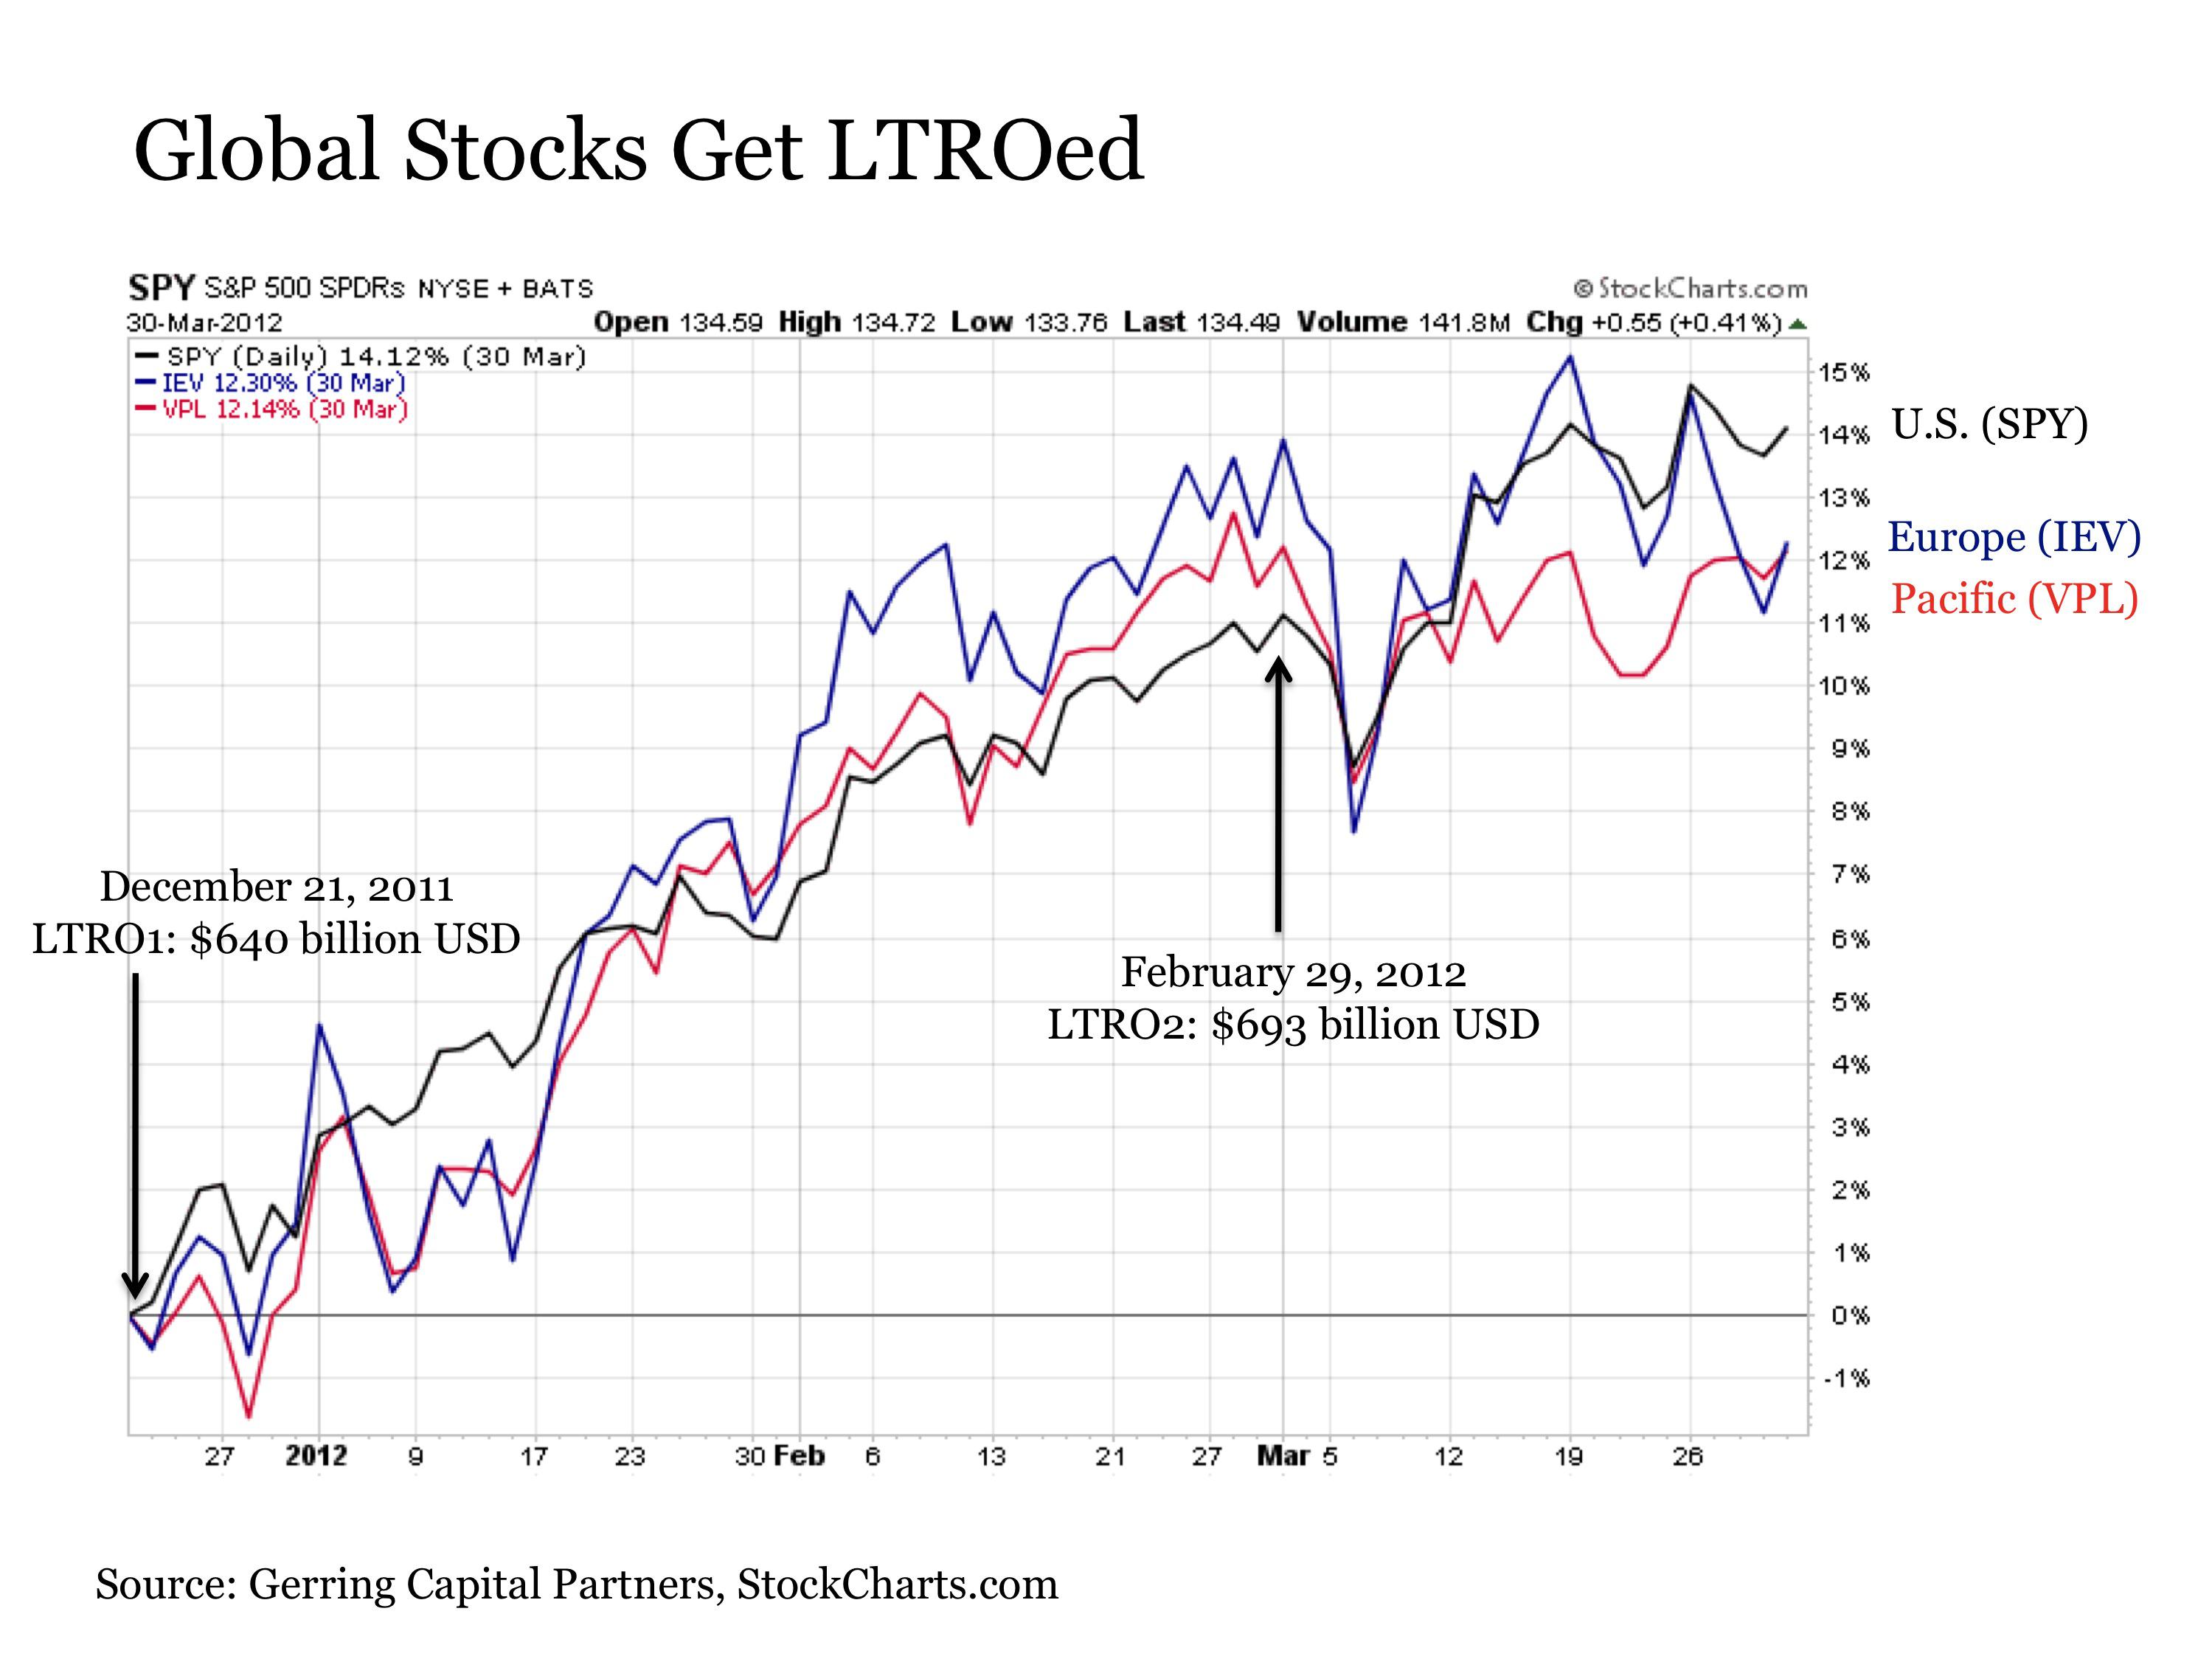
Then during the QE2 money printing and bond buying the stock markets again climbed relentlessly without any correction-grade hiccups. But again the moment those QE2 debt monetizations ceased and the Fed's balance sheet stopped rising, the SPX plunged again. This second and latest correction of this cyclical bull hammered 19.4% off the SPX in 5.2 months. This almost hit the 20% cyclical-bear threshold!

And once again it looked like the SPX didn't bottom naturally, but through Fed intervention. The low of that last correction happened just as the Fed was announcing its Twist campaign to twist the yield curve by selling shorter-term Treasuries it owned to buy longer-term ones. This helped boost the SPX again into another major upleg, which was running out of steam and looking toppy in late 2012 as the US elections neared.

The SPX had actually stalled out in April 2012, without a single new high seen until September 2012 after first the European Central Bank and then the Federal Reserve announced new campaigns to buy bonds. After 5 months of zero upside progress before the ECB and the Fed's QE3 announcement, would US stock markets have rallied into the 2012 elections without the Fed's help? Odds are no way.

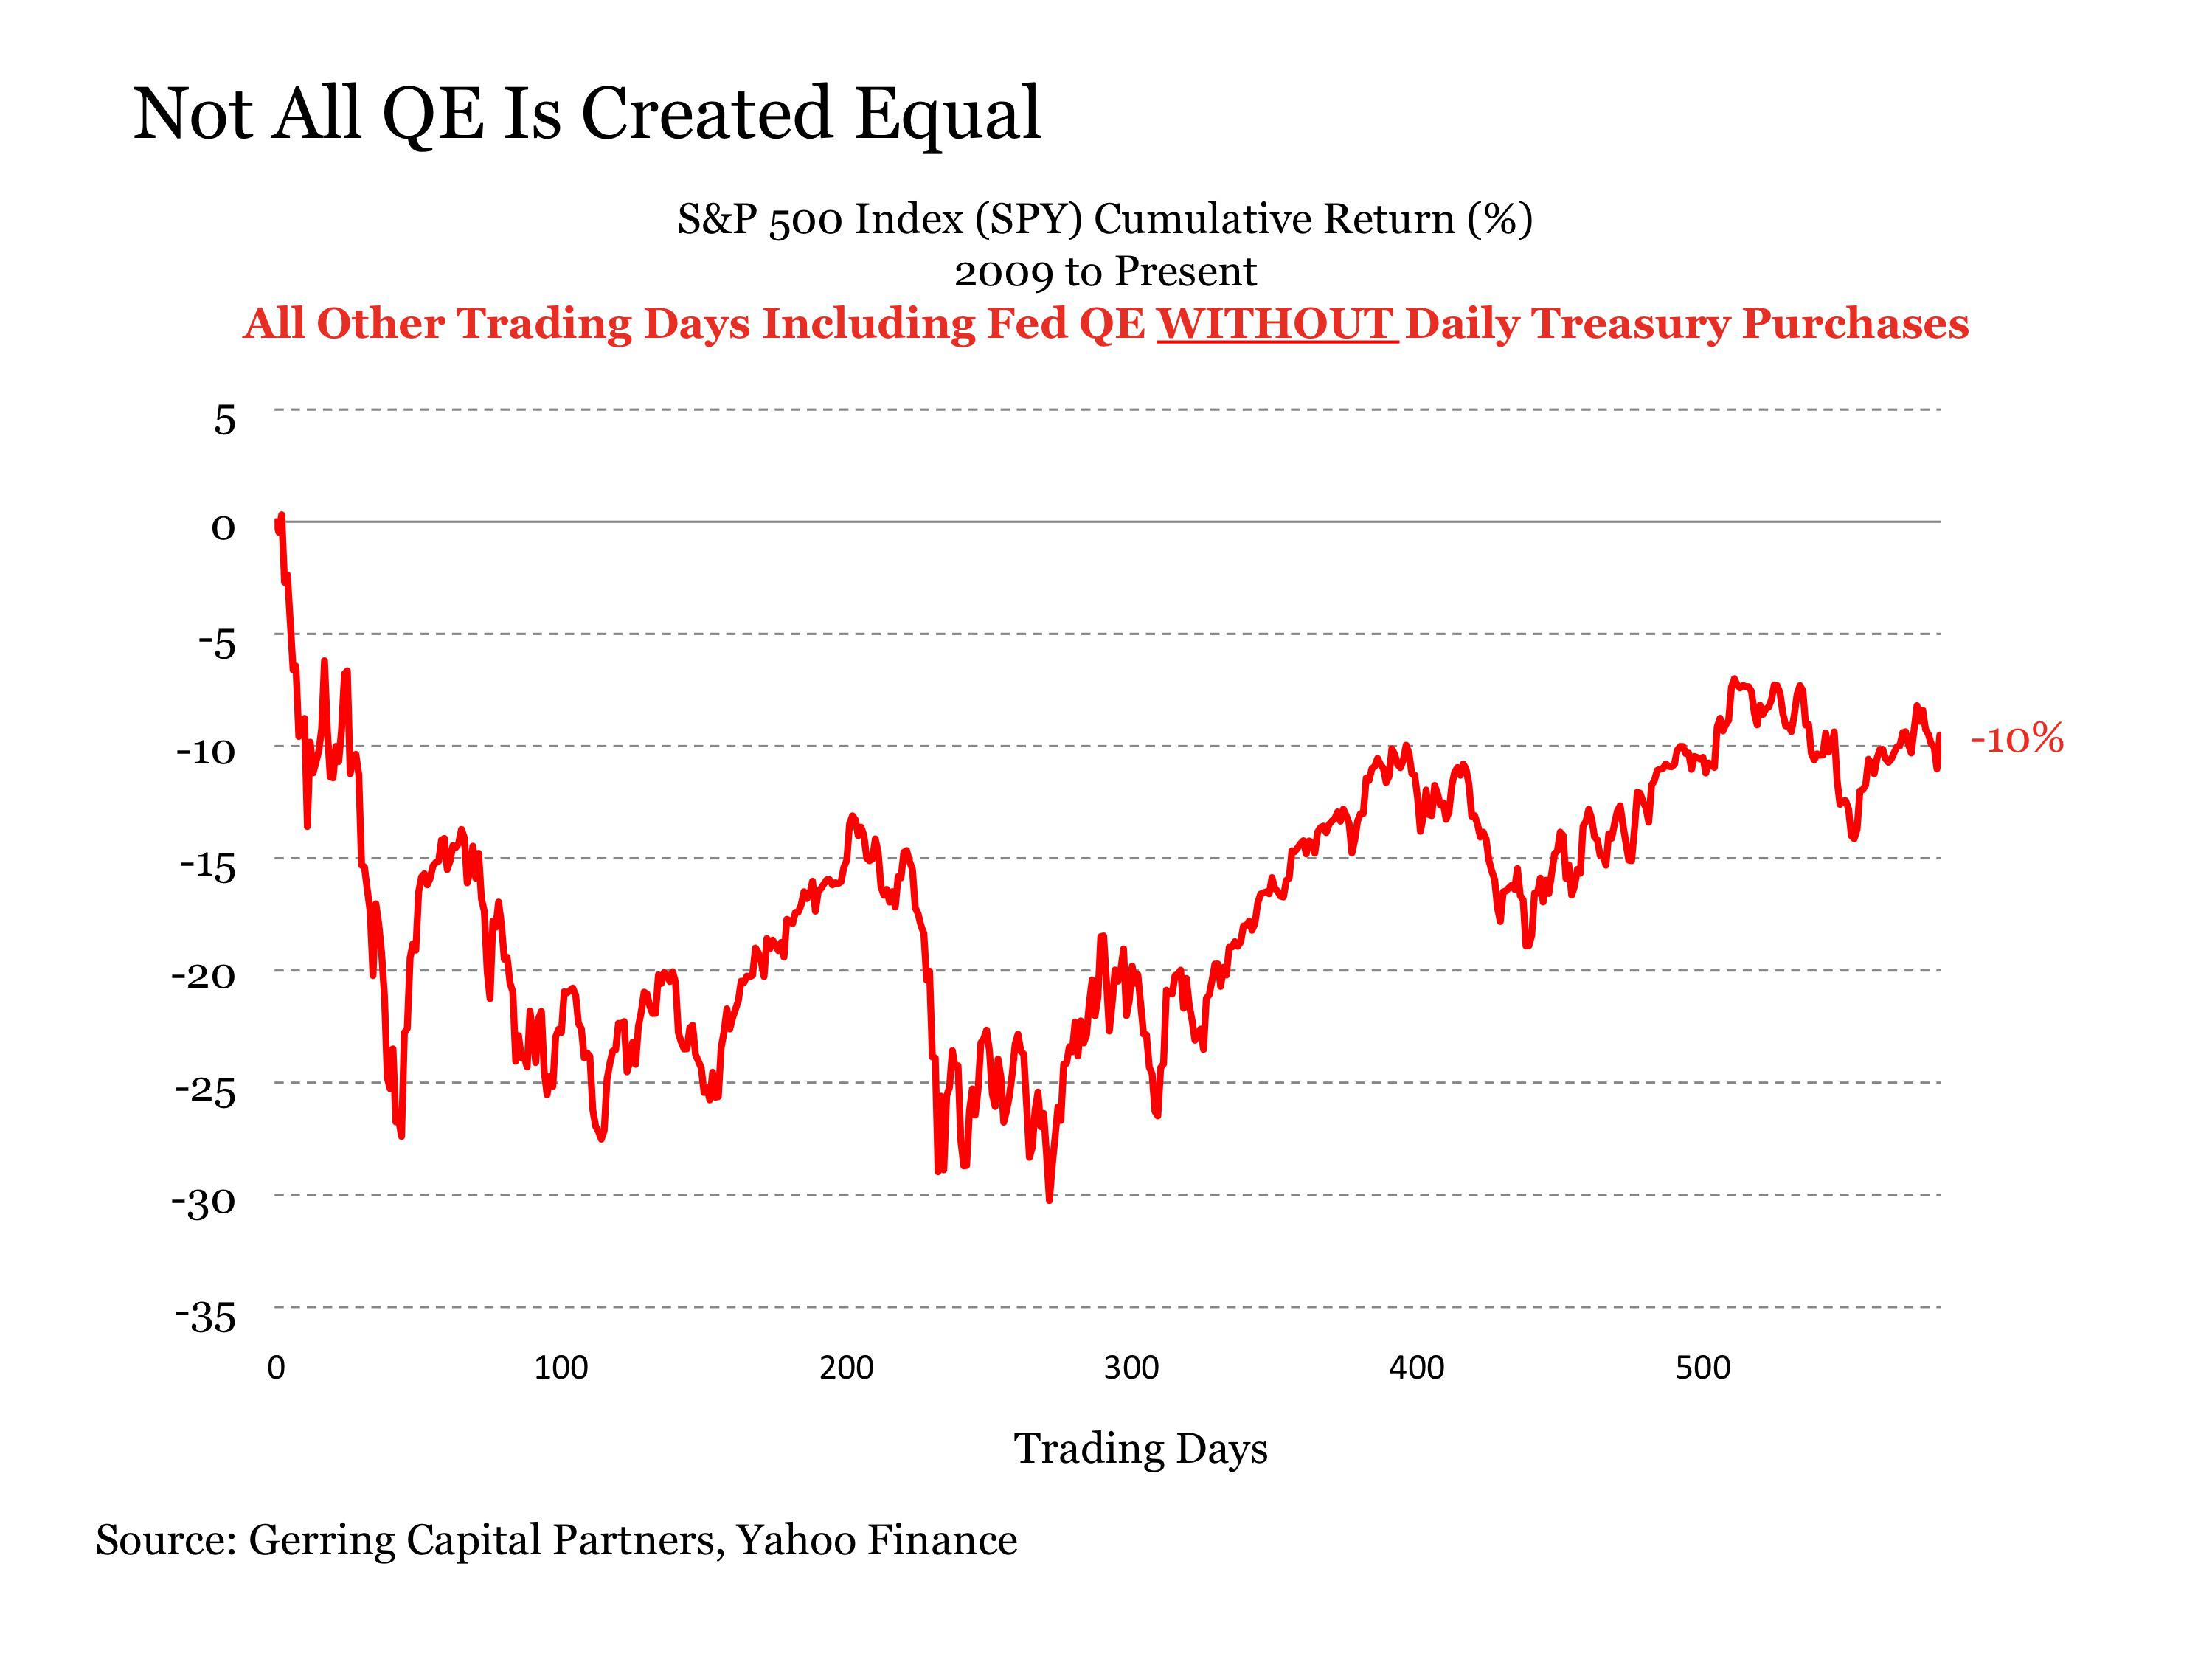
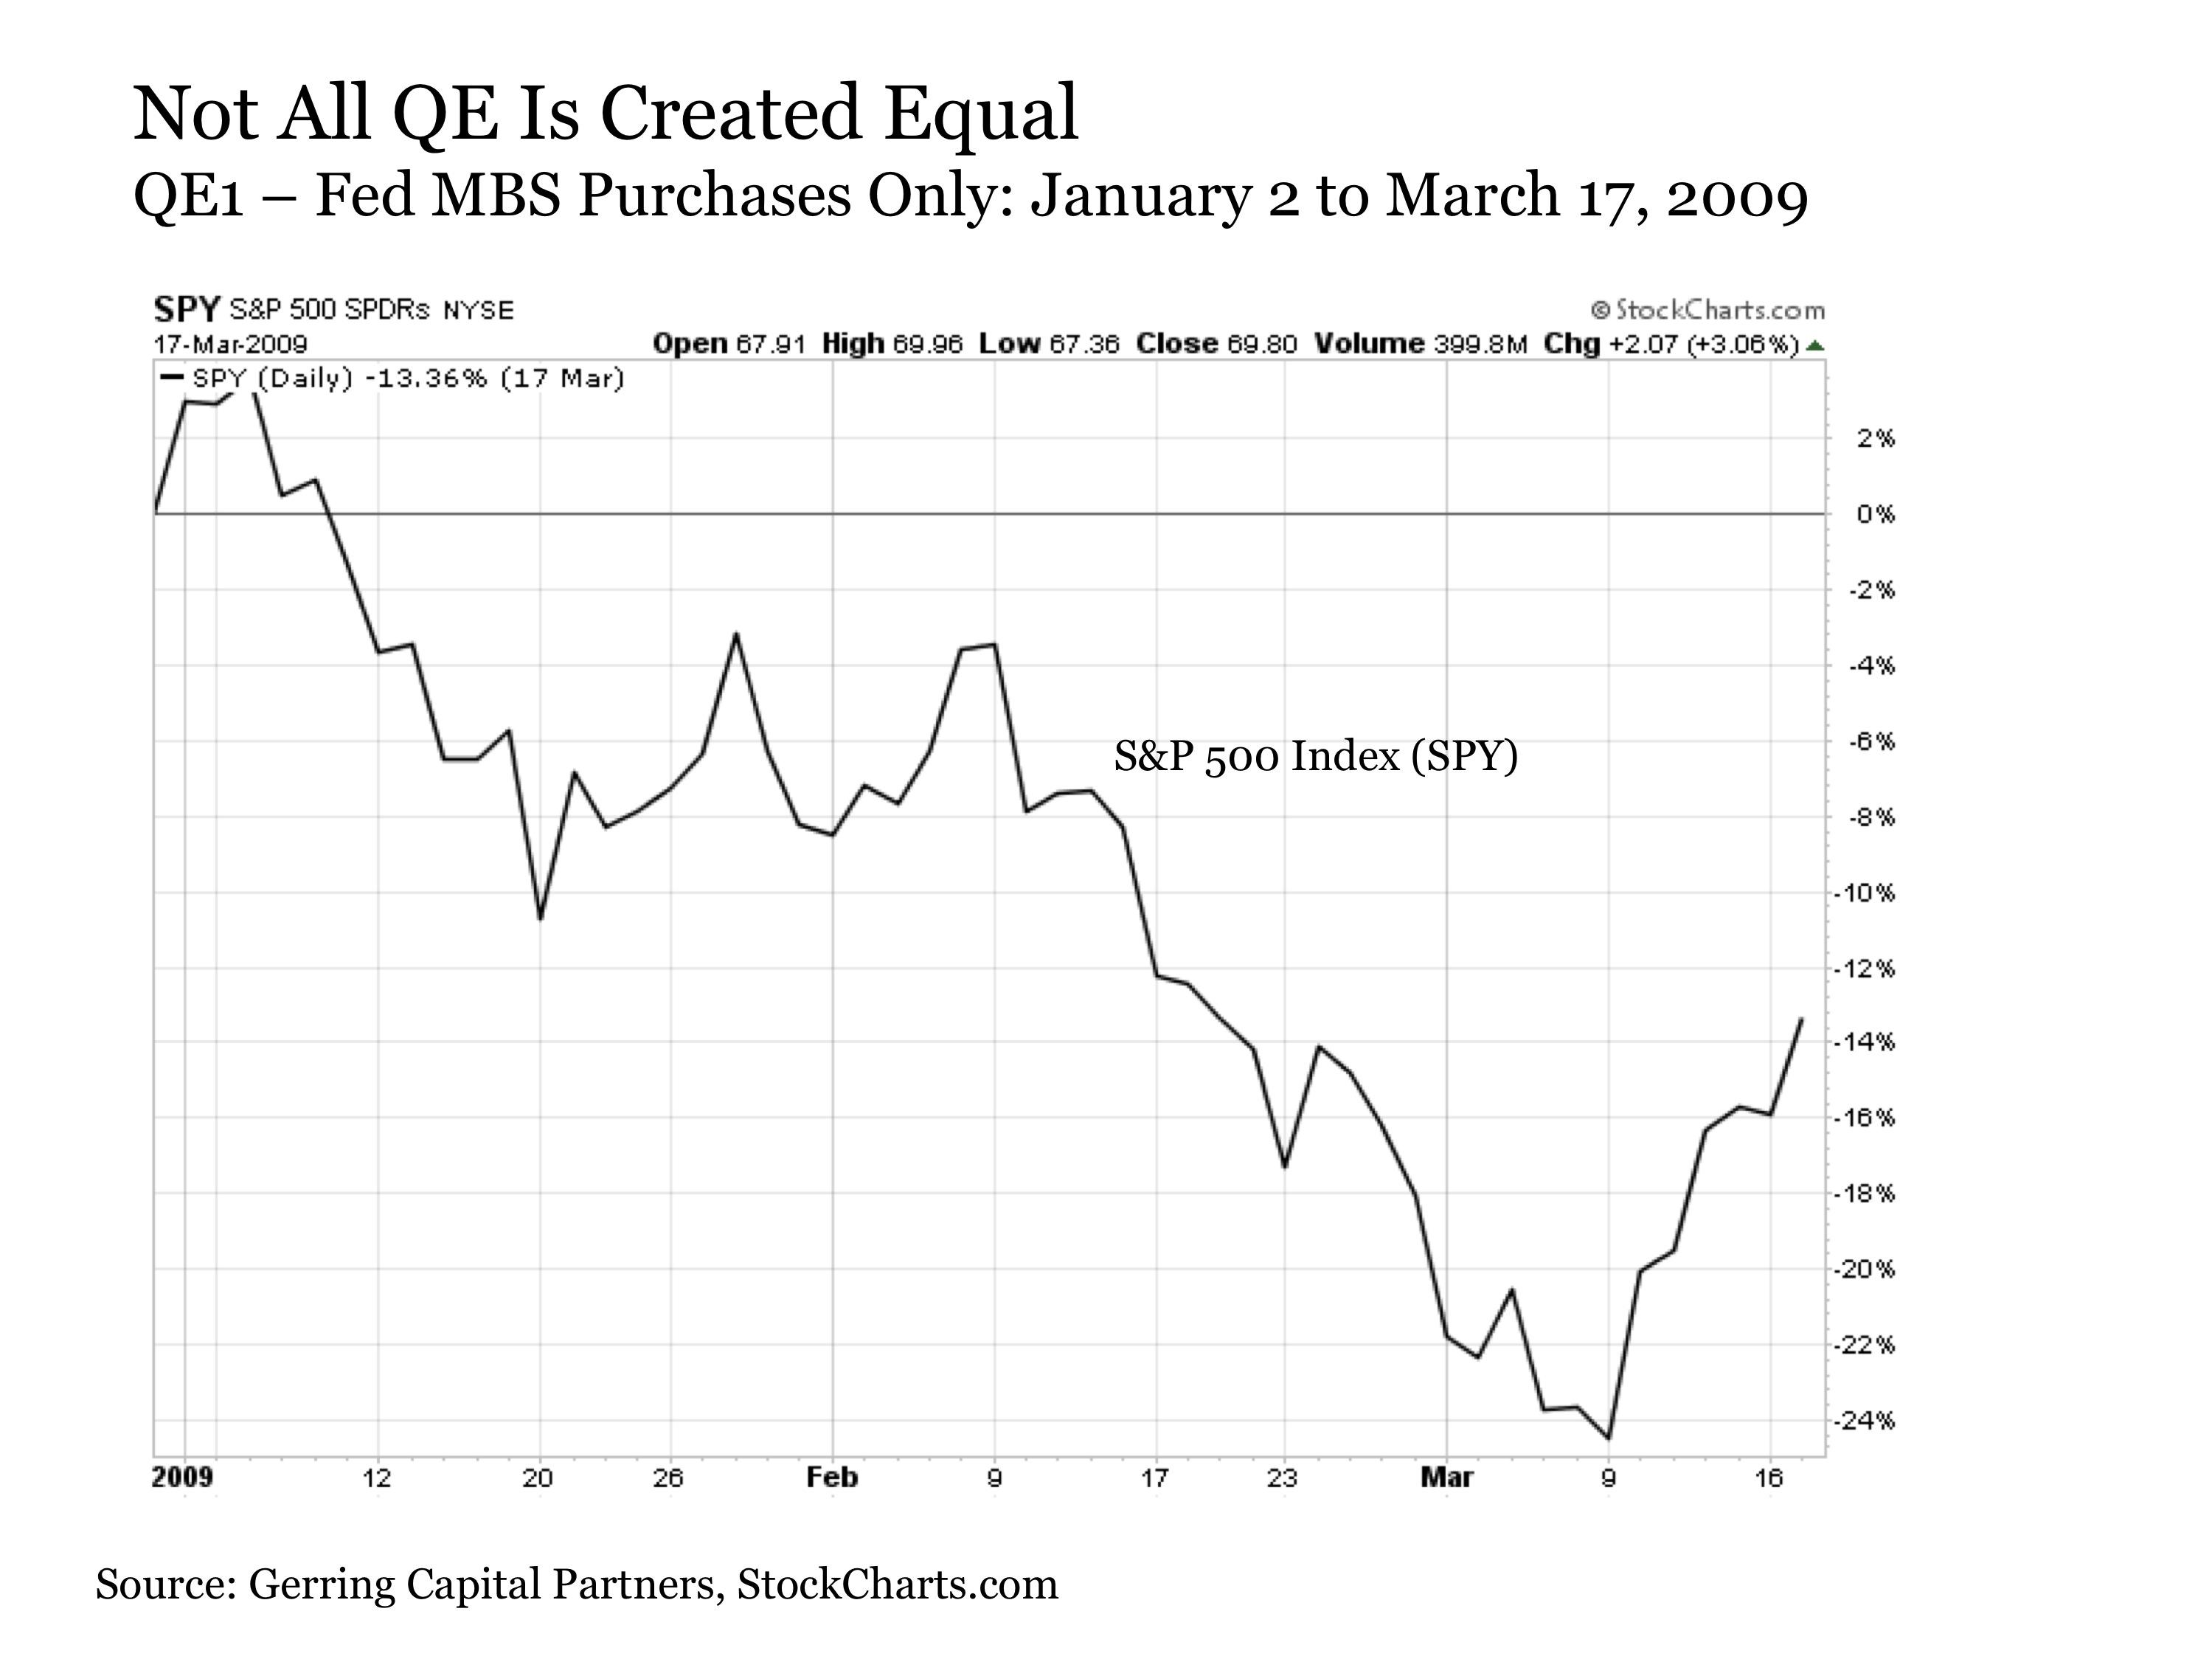
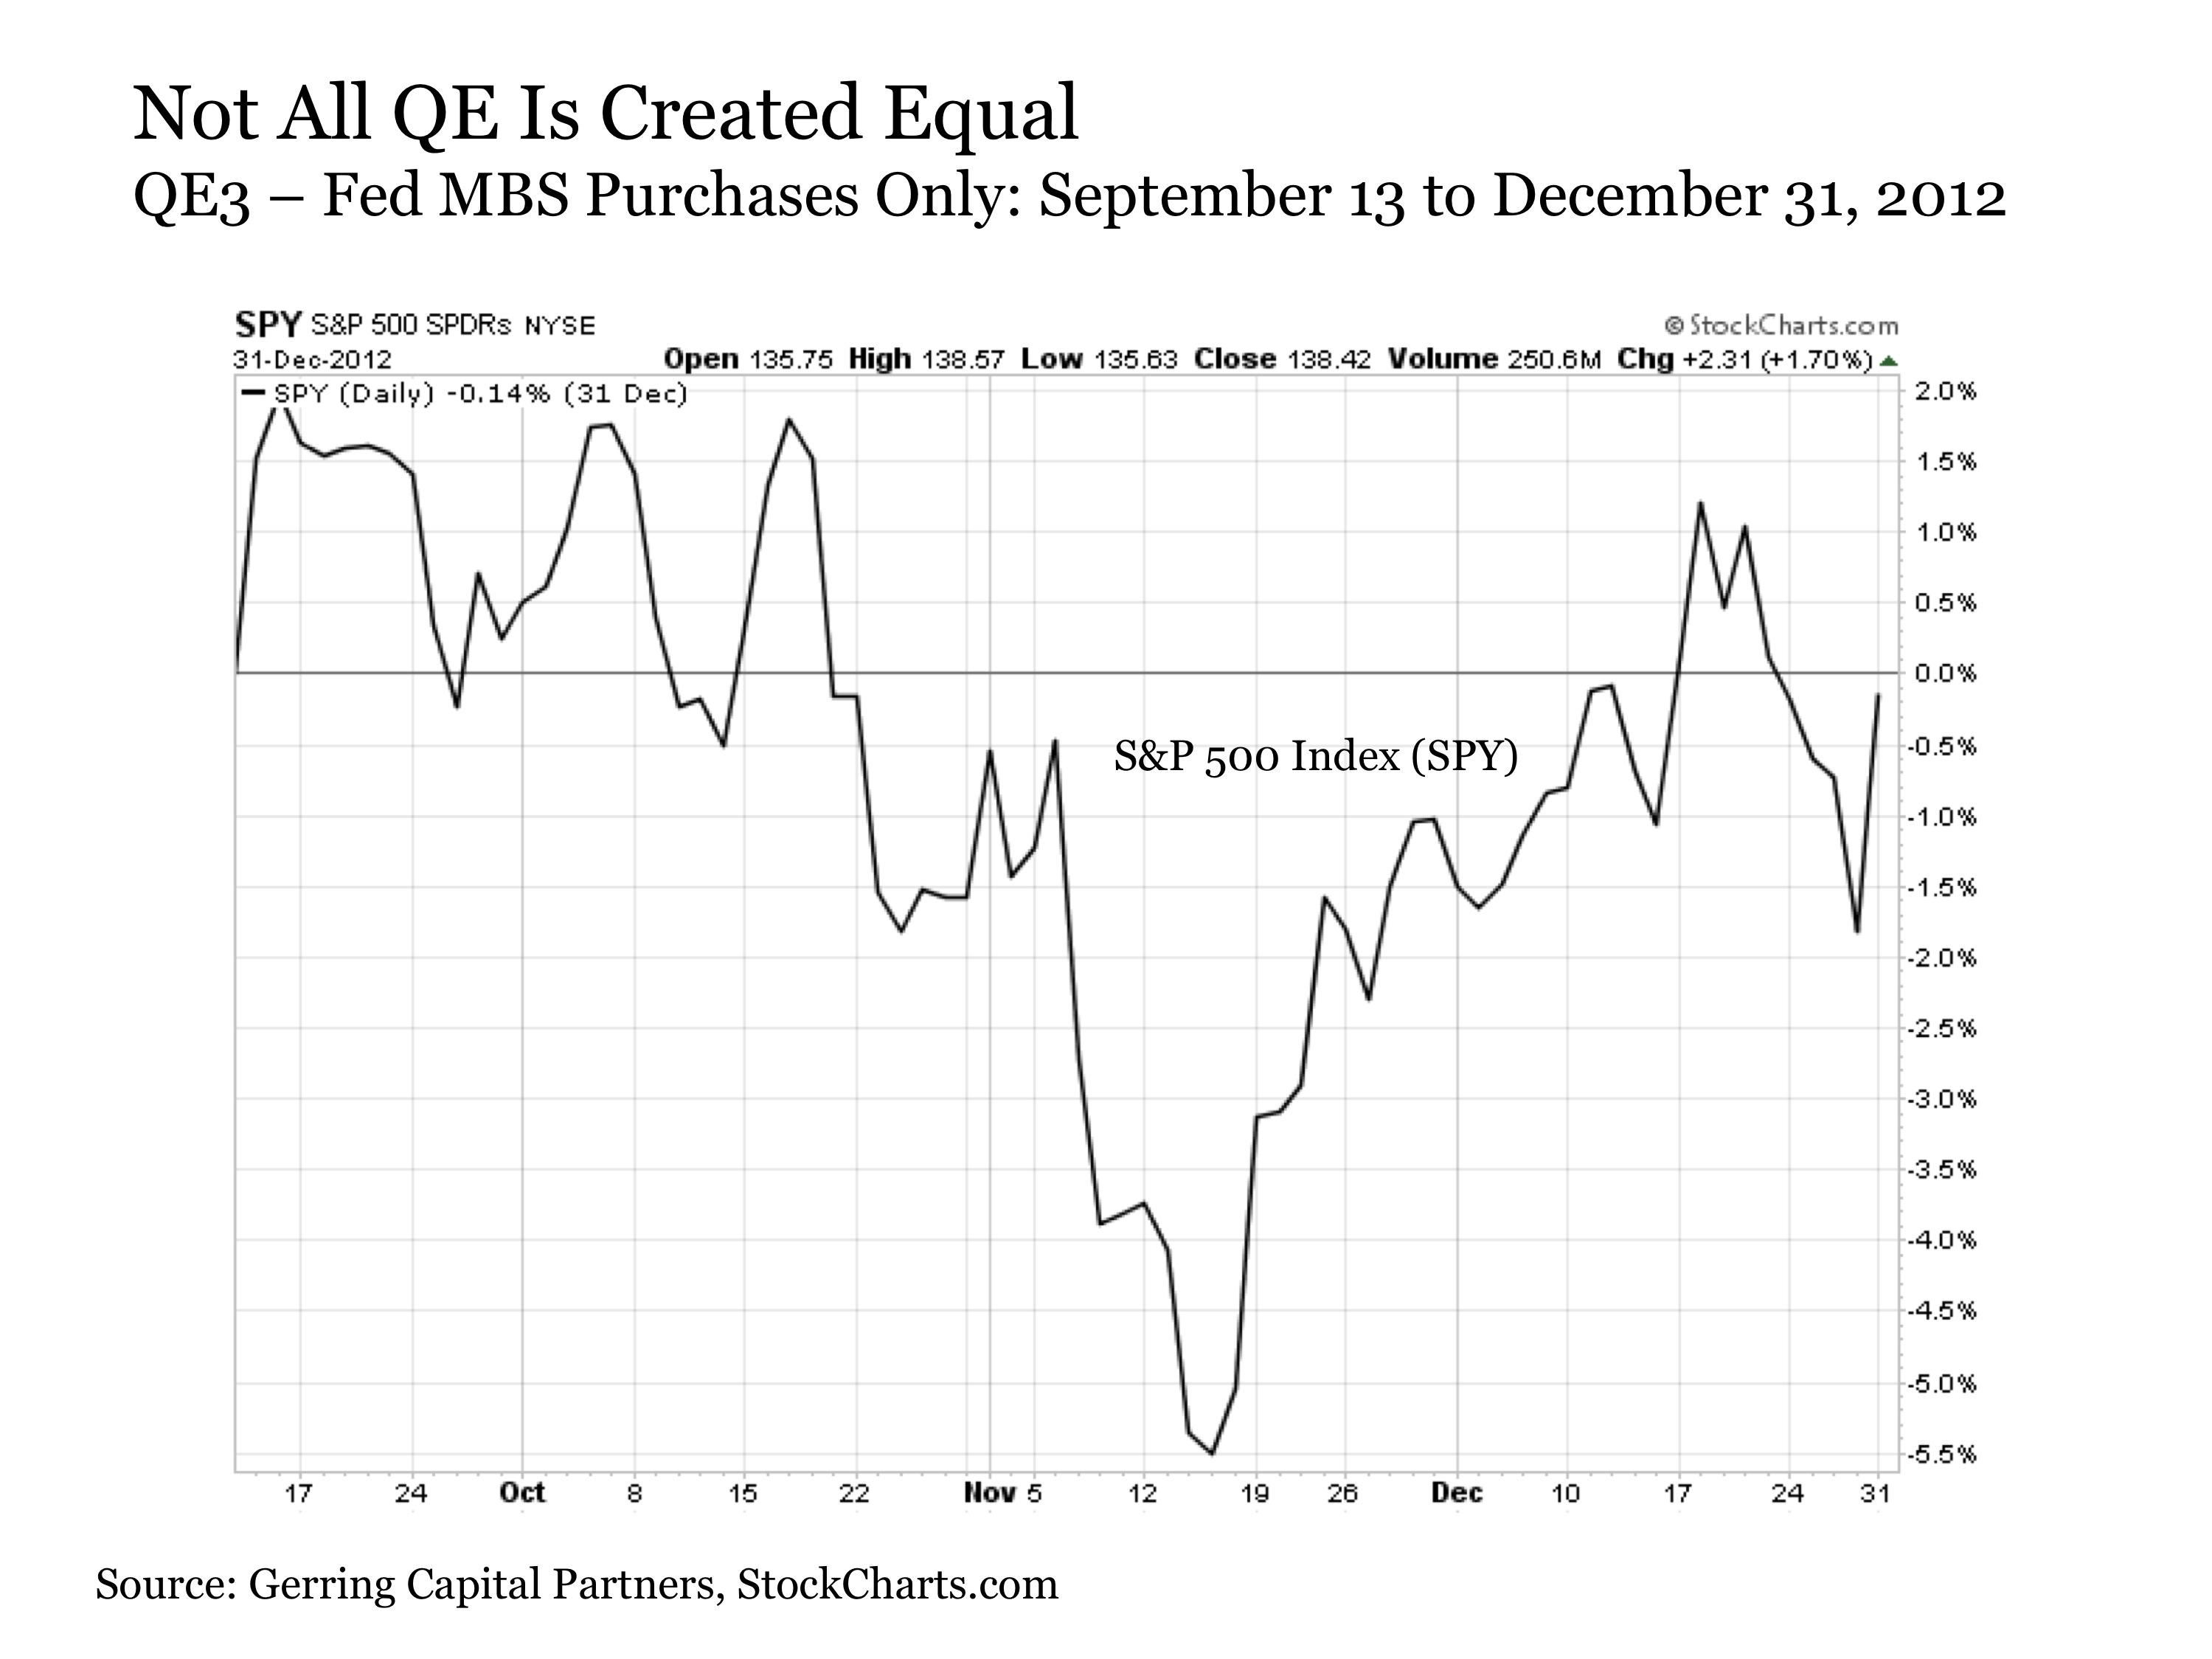
As Treasury monetizations are far more potent than mortgage-backed-bonds ones, the stock markets were weaker after QE3's initial MBS buying and the resulting Obama win. But once the Fed expanded QE3 to include Treasuries in December 2012, the SPX started levitating. It soared in a very tight trading range mirroring the Fed's ballooning balance sheet, with no material selloffs to rebalance sentiment.

This chart implies the entire reason the SPX rallied from 1500, the secular-bear resistance it would have almost certainly naturally topped at without the Fed's manipulations, was QE3 and its accompanying dovish jawboning. In my decades of trading, I've probably never seen a more ominous chart than this SPX levitation perfectly tracking the Fed's soaring balance sheet. The SPX/QE3 correlation is just stellar.

If the ends of QE1 and QE2 both sparked major corrections, why shouldn't the end of the far-larger (in Treasury terms) QE3? Back in mid-2010 and mid-2011 when those earlier quantitative-easing campaigns ended, the stock markets where nowhere near as high and euphoric as they are today. Yet stocks still corrected hard when the Fed's inflationary tailwinds, and implied backstopping, were removed.

Provocatively today's lofty stock-market valuations are similar to those seen at the major SPX toppings as QE1 and QE2 ended. When all 500 SPX component companies' individual trailing-twelve-month price-to-earnings ratios are averaged, they reveal the SPX trading at 26.6x near the end of QE1 and 24.1x near the end of QE2. The latest simple-average read for this metric as August 2014 ended was 26.1x!

This is dangerously high, as 28x is actually the historical threshold for a bubble! Add these extreme overvaluations on top of the prevailing extreme euphoria and complacency, cyclical-bull-topping technicals, and a greatly overextended cyclical bull, and it is hard to imagine the end of QE3 not spawning a major selloff! It is actually far more likely to cascade into a new cyclical bear than stay a mere correction.

Again the stock markets are forever cyclical, cyclical bulls are always followed by cyclical bears. The average size and duration of a cyclical bull within a sideways-grinding secular bear like we've seen in the stock markets since 2000 is a doubling in 35 months. Today's bull has nearly tripled, up 196.1%, in 66 months! It is far too big and far too old, meaning a selloff's highest-probability outcome is the next cyclical bear.

Cyclical bears tend to cut stock prices in half over a couple years or so, they are dangerous beasts not to be trifled with. And once QE3 is done, there is no more Fed backstop in place to motivate traders to instantly buy every minor dip. With short rates zero-bound thanks to ZIRP, the Fed has no room to cut interest rates to arrest a stock-market swoon. And again QE4 is very unlikely in this political environment.

The election-year stock-market studies I've seen are for the major presidential election cycles, not intervening midterm elections. But the results are likely similar. Rising stock markets make Americans feel better about everything, so we are more likely to vote for incumbents for more of the same. But we feel worse when stock markets are weaker, making us more prone to kick out the bums in hopes for change.

So if the stock markets are weaker in September and October 2014, the odds grow that the Republicans are going to retake the Senate. They already have an edge, as Obama and the Democrats are very unpopular for a variety of reasons including the disastrous and punishingly-expensive Obamacare burdens on Americans. Republican voters skew older and whiter too, more likely to vote in midterm elections.

The major corrections when QE1 and QE2 ended actually began a little earlier in anticipation, and it is reasonable to expect stock traders to start selling ahead of QE3's rapidly-approaching end too. And since the Fed won't risk the political wrath of the Republicans who will likely soon control the full Congress again, it isn't going to launch a QE4 soon. So any stock selloff won't have any hope of a Fed rescue!

Thus the end of QE3 is exceedingly ominous for these lofty stock markets. A major SPX selloff, whether it is merely a 20%ish correction or a new cyclical bear, will drive devastating losses in everything from the high-flying momentum stocks to the conservative SPX-tracking ETFs like SPY (NYSEARCA:SPY). And it has been so long since we've seen any material selloffs that the resulting hit to complacent and euphoric sentiment will be massive.

How can you protect yourself in this coming swoon? Buy gold. The entire precious-metals sector was abandoned and left for dead during the Fed's QE3-driven SPX levitation. But alternative investments will return to vogue in a big way once normal stock-market behavior including selloffs resumes. The gains coming in the beaten-down precious-metals sector will be vast as flight capital floods in looking for safe havens.

The big risk of serious inflation igniting thanks to QE's huge monetizations remains too, which will act like rocket fuel for gold. Even when QE3's new buying ends soon, the Fed will still have $3.5t of bonds stuck on its balance sheet! That means $3.5t of new money injected into the economy that could start bidding on goods and services and driving up prices any time until the Fed can unwind its QE bonds bought.

The bottom line is the Fed's third quantitative-easing campaign is due to end in late October. QE3 has massively boosted the stock markets, driving their extraordinary levitation of the past year-and-a-half or so along with the Fed's jawboning. Once QE3 ends, so does the Fed's implied backstop of stocks. Any selloff can't be met with rate cuts thanks to ZIRP, and a new QE4 is extremely risky politically for the Fed.

So the overdue stock-market selling pressure is likely to cascade with the Fed no longer available to arrest it. Major stock-market corrections emerged as both QE1 and QE2 ended, and the stock markets are far more extreme today as QE3 winds down. And once again this end-of-QE selling is likely to start in anticipation of the actual event, an ominous omen for stocks that mirrored QE3's Fed balance-sheet growth.

See the original article >>

Why A Market Correction Now Would Be The Best Scenario

by Sy Harding

Nobel Laureate in economics Jeremy Siegel says he is still not concerned with valuations and has upped his previous projection of 18,000 for the Dow by year-end to "possibly 19,000".

However, Nobel Laureate in economics Robert Shiller is very worried, noting that the market is 65% overvalued based on the Shiller CAPE 10 P/E ratio, the market's main fuel now being "irrational exuberance".

Newsletter writers and retail investors are very bullish, while corporate insiders and famous billionaire investors are increasingly pessimistic.

For instance, George Soros has significantly increased his positions in put option bets against the S&P 500, while Warren Buffett is holding a record amount of cash.

Billionaire investor Sam Zell says, "Something has to give here. The stock market is at an all-time high, and economic activity is not."

Peter Schiff, economist and CEO of Euro Pacific Capital, says, "The 2008 market collapse was not the real crash. The real crash is coming."

Jim Paulsen of Wells Capital Management, one of the biggest bulls during the last five years, is now telling clients to "shift out of U.S. stocks and into international markets."

They are not only concerned about the high market valuation and age of the bull market. They speak of how the extremely aggressive actions of the Fed over the last five years resulted in only an anemic economic recovery. Yet the market, always looking ahead, will soon have to begin anticipating those actions being reversed; the unloading of the unprecedented $4 trillion in mortgage-backed securities and U.S. Treasury bonds on the Fed's balance sheet, raising the record low interest rates back to normal, and so on.

Their concerns are well-founded.

However, if we could get a normal (and overdue) 15% to 20% correction now, to cool off stock valuations and investor euphoria, the next bear market - and yes there is always a next bear market - could be postponed for several years.

The worst scenario would be if we do not get a normal correction now, allowing the excesses the 'smart money' is worried about to become even more extreme.

History also chimes in with a warning about the danger of not having a correction now; that warning coming from the Four-Year Presidential Cycle.

Most investors are aware of the cycle's basic pattern; serious corrections usually take place in the first or second year of presidential-terms, and the third and fourth year are almost always positive.

However, few may be aware of its more sinister sub-pattern, which is when a president is in his second term, as President Obama is, and there is not a correction in the first two years of that second term.

In an administration's first term, a major goal is to be re-elected. Therefore, the pattern is that they prefer that any potential problems for the economy or stock market take place in the first or second year of the term, and do little to prevent it. They then pull out all the stops in the third and fourth year to make sure the economy and market are strong again when election time rolls around.

As Jeremy Grantham, CEO of international wealth management firm GMO, says,

"All markets tend to drop in the first two years of a presidential cycle. The key for people to remember is that whoever is president has astonishingly little effect, whereas the cycle itself, the desire for the incumbent party to get re-elected, is clear in the data. The precipitating factor is economic housecleaning by officials in Washington. Presidential Administrations want to correct imbalances in the economy in the first two years of their term, so they will have breathing room in year-three to stimulate the economy and set things up for the next election. An unintended consequence is that the stock market usually falls in the first two years of the cycle."

However, an administration in its second term, unable to be re-elected again, seems to have less interest in the next election. They tend to try to keep the economy and market growing through the last two years of their first term, and then all the way through the four years of their second term.

It does not usually work out well, since it raises the risk of having the market become even more over-heated and over-valued in the third and fourth year of their second term.

For instance, the last three presidents to serve two terms were Reagan, Clinton, and Bush Jr. All three experienced corrections in the first or second year of their first term, and strong markets in the last two years.

However, after being re-elected, they did not allow a cooling off in the first two years of their second term, instead striving to keep the strong economy and market of the last two years of their first term going for another four years, all the way to the end of their second term.

In all three cases, the result was not good.

The 1987 crash took place in the third year of Reagan's second term. The 2000-2002 bear market began at the beginning of the fourth year of Clinton's second term. The 2008 financial meltdown began in 2007, the third year of Bush Jr's second term.

So far, the Obama administration, in the second year of its second term, is seeing the same pattern.

Investors are hoping for no correction and a strong market in 2015 and 2016.

Given the high valuation levels, high levels of investor bullishness, the concerns of so many 'smart money' billionaires, the unusual length of time without even a normal 10% to 20% correction, there is high risk of a significant correction.

That might be the best scenario since the risk is much higher for something worse later if a normal correction does not take place now.

See the original article >>

Are You Positioned For ECB Stimulus?

by Eric Parnell

The European Central Bank (ECB) brought fireworks to their latest press conference this past Thursday. Not only did ECB President Mario Draghi announce a cut of its main lending rate to the "lower bound" of 0.05%, he also revealed that the central bank's intent to enter into its own form of quantitative easing (QE) by purchasing asset backed securities (ABS) and covered bonds at totals estimated between $500 billion to $1.3 trillion as early as October. This targeted long-term refinancing operation (TLTRO) is being done with the stated objective of trying to more directly promote lending activity to small and mid-sized businesses across the euro zone. Given that we have seen so many of these monetary stimulus programs initiated by global central banks over the past few years, it is reasonable to consider whether a portfolio strategy is well positioned for this latest ECB stimulus plan.

Of course, we have seen the ECB engage in long-term refinancing operations once before. Back in December 2011, then newly seated President Draghi announced the first LTRO that resulted in the ECB not necessarily purchasing assets outright but instead making low interest loans to European banks in exchange for collateral from the banks. Over $1.3 trillion worth of loans were distributed to European banks in two major tranches first on December 21, 2011 and again on February 29, 2012.

It is worth noting that in the months leading up to the ECB's LTRO stimulus program, global stock markets including those in the U.S. (NYSEARCA:SPY), Europe (NYSEARCA:IEV) and Asia (NYSEARCA:VPL) were struggling. Following the completion of the U.S. Federal Reserve's QE2 stimulus program at the end of June 2011, global stock markets retreated in varying degrees by double-digits through October and struggled to regain their footing into December.

(click to enlarge)

But from the day that the ECB initiated their LTRO program right before Christmas 2011, global stock markets exploded into a uniform and sustained rally over the next three months, posting very similar double-digit advances across the board. Global stock markets clearly found at least some cheer in the ECB's stimulus plan.

(click to enlarge)

This seemingly notable response from global stock markets to the ECB's LTRO raises a natural question. Should we expect to see a similar positive response from global stock markets upon the launch of the upcoming TLTRO by the ECB? Taking this one step further, does the TLTRO effectively represent a passing of the QE baton from the Fed to the ECB and with it the juice to keep pushing global stocks to new highs?

Not All QE Is Created Equal

To begin with, attempting to draw conclusions about the response by global stock markets to the upcoming TLTRO based on observations about the past LTRO is clouded by several factors.

First, the ECB's LTRO is just one past instance that took place over a relatively short period of time and does not represent a sufficiently large sample size to draw any definitive conclusions.

In addition, all else is not being held equal in these instances, as global economic and market conditions are decidedly different in late 2014 than they were in late 2011. More specifically, stocks have risen a long way from where they were in early 2012. Back then, stocks as measured by the S&P 500 Index were trading at 14.5 times trailing 12-month as reported earnings, which is far more reasonable than the 19.4 times as reported earnings that stocks are trading at today.

(click to enlarge)

Lastly, the TLTRO program being carried out today is structured differently than the LTRO program that came before it in late 2011 and early 2012. As a result, one should be cautioned in attempting to draw any concrete conclusions on how global markets might react to TLTRO based solely on observations about the past LTRO.

Instead, it is worthwhile to stand back more broadly and explore how the various stimulus programs instituted by global central banks over the last several years have influenced global markets along the way.

The first observation that can be made about these collective stimulus programs by global central banks is that not all QE is created equal. Market performance during the post crisis period suggests that exactly how QE is implemented may have a meaningful effect in determining whether the stock market response is positive, indifferent or negative.

More specifically, two characteristics about these monetary stimulus programs have stood out more than any other in terms of the stock market impact in the over 1,400 trading days since QE was first initiated in the midst of the financial crisis. The first is the periodicity of how these asset purchases are carried out and subsequently how this liquidity is injected into the financial system. The second is the specific assets being purchased from the banks.

For example, the U.S. Federal Reserve has implemented various forms of stimulus since the outbreak of the financial crisis. The following is a chart of the S&P 500 Index over the 843 trading days when the Fed was actively engaged in daily U.S. Treasury purchases. Overall, the stock market has gained a cumulative +132% over the 843 trading days when the Fed has been purchasing Treasuries on a daily basis. This, of course, is the program that has been scaled down for months and is about to draw to a close.

(click to enlarge)

In contrast, the following is a chart of the S&P 500 Index over the 583 trading days when the Fed was doing anything other than purchasing Treasuries on a daily basis. This includes the Fed doing nothing at all, the Fed engaged in Operation Twist, the Fed announcing to the market that QE is soon coming but has not been officially implemented yet and the Fed actively engaged in QE that includes only mortgage backed securities (MBS) purchases instead. Overall, the stock market has posted a cumulative decline of -10% over the 583 trading days when it was doing anything other than buying Treasuries on a daily basis.

(click to enlarge)

Taking this one step further, one point that is notable about the ECB's proposed TLTRO program is that it is like QE in many ways but the asset purchases are likely to occur in broader tranches instead of daily. While the LTRO did serve global markets well in this regard back in late 2011 and early 2012, the same cannot be said of other stimulus programs where asset purchases associated with QE were lumpy instead of daily. To this point, the two charts below show the performance of the S&P 500 Index specifically during the two periods when the Fed was actively engaged in QE but was purchasing MBS only. The performance is mediocre at best and lousy at worst.

(click to enlarge)

(click to enlarge)

Even if a central bank is fully engaged in outright asset purchases, it does not mean that it is an automatic ticket to a stock market that is steadily floating higher. For example, the Japanese stock market (NYSEARCA:EWJ) has been grinding in a sideways pattern since the Bank of Japan's super aggressive monetary policy experiment was first revealed back in April 2013. Adding to this point, it is worth noting that the Japanese stock market is currently trading below its May 2013 peaks, and this comes despite all of the rampant printing of yen under QE in Japan.

(click to enlarge)

Conclusions

Whether the ECB's TLTRO program serves the purpose of propelling global stock markets to fresh new heights remains to be seen. But recent history has shown that a central bank QE program does not automatically mean that global stock prices are going to rise in response. In fact, it has largely been only one specific type of QE stimulus application in the form of daily U.S. Treasury purchases that appear to have this sustained positive effect on global stocks. Beyond that, other central bank QE stimulus programs have been a wash at best for the stock market.

When considering the specific details about the program that have been revealed so far, it suggests that the stock market impact may be considerably less than many are hoping. The difference this time around is the "T", which is for "Targeted" in "TLTRO". The intent of the program is to effectively bypass the structural obstacles in the European banking system in an effort to get the funds more directly to small and mid-sized businesses.

Put differently, it seems that the ECB this time around does not want to turn over the funds to the banks in a more general way only to find that the capital ends up not going into improving the economy but leaks out into other less productive places (i.e. the stock market). Instead, they are seeking to get as much of the funds as possible directly to the destination that they believe may help stimulate the European economy best. This in the end may leave little left over for leakage into the stock market.

It is also notable that Draghi's announcement came only days after his speech in Jackson Hole where he essentially teed up Thursday's announcement. During his stay in Wyoming, he of course was hobnobbing with those at the Fed that are not only in the process of winding down their own QE stimulus program in the next month, but was hanging with a group that has recently been vocal on topics such as income inequality, potential asset bubbles in selected stock sectors and the need to raise interest rates sooner rather than later. All of these suggest that the Fed may have concluded that a policy approach that moves away from promoting higher stock prices may be more beneficial to the economy as a whole in the future. And it would be hard to believe that at least some of this thinking might not have rubbed off on Mr. Draghi during his stay in Wyoming.

Portfolio Implications & Positioning

Putting all of this together suggests that the benefits for global stock markets resulting from the ECB's TLTRO program may end up being much less than investors may currently be anticipating. But whether the program does provide a boost to share prices in the end or not, the history of central bank stimulus including QE since the financial crisis has shown that when stocks are benefiting, they are typically doing so universally across the globe with U.S. markets either matching or outperforming along the way. In the end, this suggests that sticking to one's existing stock strategy and focusing on high quality stocks trading at discounted valuations where possible should provide a portfolio with exposure to any spillover benefits on global stock markets if such effects do indeed come to pass. In short, no need exists at least at this point to modify one's existing stock strategy in any meaningful way in response to the ECB's latest policy actions, as current allocations should provide sufficient exposure at least for now.

See the original article >>

Speed Of The Fed Exit And Stock Returns

by Evariste Lefeuvre

Summary

  • There is a link between stock market returns and the pace of tightening of monetary policy.
  • I use a "exit speed" indicator to highlight this relationship.
  • Interestingly, the correlation is highly dependent on the ability of the Fed to drive the long end of the yield curve.

While the ECB has entered a long lasting status quo, the Fed is preparing to bring several years of unconventional monetary policy to an end and start tightening. Mid-2015 should be when the Fed starts raising the level of Fed Funds. Of course more disappointing job data or a sharp appreciation of the USD could have an impact on the timing, but there is no coming back: the Fed will tighten next year.

While the "dots" provided by the Fed give us a sense of the terminal value of Fed Funds rates, there is still a lot of uncertainty on the speed of the tightening. For instance, the Fed might have to speed up or slow down its tightening stance whether it is behind the curve or not (business surveys call for a higher rate of growth for wage of non-supervisory workers in the next six months - see chart below - which may "force" the Fed to act earlier than expected).

Speed is nothing else than the ratio of distance to time. To assess the impact of the speed of monetary policy tightening on stock indexes, I divided the change in Fed Funds rates by the length of the tightening periods.

(click to enlarge)

Then I compared this measure of speed (change in Fed Fund per year) with the annualized return of the S&P 500 over the period. We clearly see that the higher the speed (in Fed Funds per year) of the tightening, the lower the annualized return of the S&P 500.

This would call for a smooth exit, something that an early start of the tightening cycle (that is before wage inflation really kicks in) would facilitate.

The chart has a flow yet. It is based on absolute changes of nominal Fed Funds. The underlying assumption is thus that a 100 basis point increase in the level of Fed Funds has the same impact on equity returns whether Fed Funds stand at 10%, 5% or 1%.

Using the relative change in Fed Funds in my calculation of speed (that is the ratio of the change in Fed Funds to their initial level) would suggest that there is no link between the pace of Fed tightening and equity returns. Yet, I doubt that investors really gauge the Fed actions with such a metric.

Interestingly enough, using real Red Funds (Fed Funds minus inflation) to assess the speed of tightening provides some interesting results. As can be seen below, there is a huge difference in the behavior of real and nominal fed funds when the Fed acts preemptively (1994/95 and 2005/06) or has already lost grip and is running behind inflation (1987/88 and 1999/2000).

(click to enlarge)

With this new metric of speed (based on the adjustment of real Fed Funds), the relationship with equity returns is still relevant but slightly different:

i. A rapid increase in real Fed Funds rates is detrimental to stock market returns;

ii. There is an outlier: the mid-2000 tightening was by far the most rapid, but it did not weight negatively on annualized stock returns. The most likely explanation is the conundrum, a term that describes the period when the long end of the yield curve failed to react to Fed tightening.

The speed of Fed tightening has an impact on equity returns, whether it is gauged through nominal or real Fed Funds rates. The relationship is rather robust, but seems to be dependent on the ability of the Fed to steer the whole spectrum of the yield curve.

If the secular stagnation hypothesis, the regulation trap, the accumulation of reserves by emerging countries are strong enough to offset the upward pressure on the long end of the curve that the end of Fed assets purchases might entail, then the forthcoming Fed tightening will lead to another conundrum. And the current stock market rally might continue, whatever the pace of tightening.

See the original article >>

Performance Nonsense: Why Past Performance Is A Poor Indicator And How To Do Better

by Arete Asset Management

Summary

  • Past performance is not a good indicator of future results because is does not disentangle skill from luck.
  • Active share has been shown to be a very useful indicator; managers whose portfolios differ substantially from their benchmarks tend to outperform.
  • Research shows that a significant minority of active managers do outperform and that investors may be able to identify them with public information.

One of the most widely practiced rituals of the investment industry is discussing past performance. This habit, of individual and institutional investors alike, is facilitated by the widespread availability of performance numbers. Unfortunately, the performance derby that ensues from this orientation serves to distract attention away from issues that matter far more in regards to your welfare.

One of the best thinkers in the industry, Nassim Taleb, addressed the role of performance in response to the question of how to do the most good and the least harm in the investment industry. In the article "Controlled Burns" in the CFA Magazine, Taleb answered: "Try not to compete on the basis of performance but add qualitative elements to show responsibility in managing risks and consciousness of the need to really protect the client's portfolio rather than your own ... When you invest your client's money, you don't invest it just for performance but for robustness. That's what your clients want."

Taleb makes a strong case against using past performance in regards to the goal of robustness, but there is an even stronger one. Past performance doesn't even provide meaningful insight into future returns.

The verdict on past performance isn't new but it is one of many nuggets of investment insight that just hasn't diffused through to the investment public very efficiently. Indeed the evaluation of past performance has been studied fairly rigorously and the logic for its failure is straightforward. According to Mark T. Finn and Jonathan Finn, CFA, "The data problem can be thought of as analogous to an engineering concept called the signal to noise ratio ... The reality is that there is a tremendous amount of variability, or noise, in security and manager returns." [Just One Thing: Twelve of the World's Best Investors Reveal the One Strategy You Can't Overlook, edited by John Mauldin].

Michael J. Mauboussin spoke in similar terms of "signal and noise" in a presentation to the CFA Society of Baltimore about his book, The Success Equation. In it he said, "Outliers exist due to extreme skill and extreme luck combined." He added that, "Where there is luck, there is reversion to the mean." Mauboussin elaborates on his thesis "Seeking portfolio manager skill": "Results, and especially short-term results, cannot distinguish between a good process and a poor process because of the role of luck. So going directly to the results gives little indication about the quality of the decision-making process and the skill of the participant."

These assessments are not just theoretical, but are also corroborated by experience. Finn and Finn report that, "Studies have shown that even managers with the best long-term records commonly underperform the market 40 percent of the time, and it is not unusual for them to have periods of three to five years of sub-par performance." Nonetheless, despite strong evidence to the contrary, it is still common practice for consultants to put managers on watch after three years of underperforming the benchmark.

Mauboussin expands on the discussion by elaborating exactly why performance measures don't work. He explains, "The returns-based approach skips the two steps of reliability and validity and goes directly to the results. It doesn't pause to ask: what leads to excess returns? It just measures the outcome. This approach works in fields where skill determines results and luck is no big deal. For example, if you have five runners of disparate ability run a 100-yard dash, the outcome of the race is a highly reliable predictor of the next race. You don't need to know anything about the process because the result alone is proof of the difference in ability."

Insofar as our goal is to identify the characteristics of managers that have a high degree of skill and therefore the best chance of outperforming, we now have an appropriate analytical framework from which to make assessments. Mauboussin continues: "Now the discussion shifts a bit. The questions become: which measures of an active manager's portfolio reflect skill and therefore reliability? For example, a manager may be able to control the number of holdings, risk, turnover, and fees. Next, of the measures that are reliable, which are highly correlated with the ultimate objective of delivering excess returns? Are there measures that are both reliable and valid?"

The answer is a resounding, "YES!". More specifically, that measure is Active Share. This metric determines the degree to which a portfolio is different from its benchmark. The highest level is 100% and at 0%, the portfolio would be identical to the benchmark. In order to provide some reasonable thresholds, Mauboussin notes that, "Generally, an active share of 60 percent or less is considered to be closet indexing and active shares of 90 percent or more indicate managers who are truly picking stocks."

In a terrific study, "Active Share and Mutual Fund Performance" from the Financial Analysts Journal, Antti Petajisto sheds a great deal of light on active investment management by analyzing the performance of all-equity mutual funds categorized by the magnitude of active share. He found that, "The most active stock pickers [highest active share] outperformed their benchmark indices even after fees, whereas close indexers underperformed."

Managers with high active share have a better chance of outperforming for two predictable reasons. One is that they focus on "best ideas" which can meaningfully impact portfolio performance. The other is that they don't have a lot of overlap with benchmarks that could be replicated with low cost index funds. As Petajisto describes, "The problem is that closet indexers are very expensive relative to what they offer." Now investors have an objective measure to verify the stock picking intensity of their investment managers and therefore to better gauge the value of those services.

As effective as active share is in evaluating the skill of an investment manager, there are plenty of other measures that can help too. In a terrific review of academic literature on the subject, Robert C. Jones, CFA and Russ Wermers highlight a wide variety of useful characteristics in "Active management in mostly efficient markets" from the Financial Analysts Journal. In addition to being a great resource for manager evaluation criteria, the Jones and Wermers piece also provides a useful endorsement of the effort: "This survey of the literature on the value of active management shows that the average active manager does not outperform but that a significant minority of active managers do add value. Further, studies suggest that investors may be able to identify superior active managers (SAMs) in advance by using public information."

Warren Buffett once said, "There is so much that's false and nutty in modern investing practice ... If you just reduced the nonsense, that's a goal you should reasonably hope for." The bad news is that a large proportion of industry participants still focus on past performance like a bad habit. The good news is that you can "reduce the nonsense" by foregoing the distraction of past performance and instead focusing on other more indicative factors. The really good news is that such factors exist. Active share, in particular, is a powerful metric that is making significant headway with sophisticated investors. In short, changing the discussion about performance is one of the simple things you can do to level the playing field and shift the odds in your favor.

See the original article >>

Hot Coffee

by Keith Williams

Summary

  • Numerous reports indicate that major coffee growing regions are endangered by climate change, indicating likely pressure on supply.
  • Coffee drinking is a sign of “trendiness” in emerging markets (e.g. India), which have the potential for dramatic increase in demand.
  • The confluence of diminishing short and long term supply and expanding demand indicates robust times for investment in coffee in both the short and long term.

Agriculture is subject to climate change and agricultural scientists around the world have conducted all kinds of studies. In the US one needs to look no further than a June 2014 report on production of corn.

You know that a topic is warming up (pun intended) when it appears in The Huffington Post. This week there was a story on climate change and coffee.

Coffee is one of the most environmentally sensitive crops. It does not tolerate frost nor does it thrive in hot conditions. Indeed for optimum yield and quality of the most popular Arabica coffee, the temperature needs to be in the range 18-21oC (below 17oC yield decreases and above 24oC quality decreases). Since Arabica coffee is mostly grown in the tropics at altitude, even a small increase in temperature can make the arable area disappear up the mountain. Also higher temperatures encourage growth of a rust fungus which destroys the crop. As a result coffee is one of the most sensitive crops to global warming. A number of recent studies suggest dramatic reduction in coffee producing areas as a result of predicted warming, even in the short term.

So what does this mean for an investor?

In the short term this means a declining supply, indicating increasing prices. The increasing popularity of coffee as a lifestyle experience means that business is booming worldwide. This impacts on companies in the coffee business. Keurig Green Mountain (NASDAQ: GMCR) has already had a remarkable sixfold stock price increase over the past 2 years. With recent increased investment in it by Coca-Cola Co (NYSE: KO) it may well keep going. Coffee Holding (NASDAQ: JVA) is looking interesting. Or a broader investment is possible through iPath DJ-UBS Coffee Subindex (NYSEARCA: JO).

In the longer term it is worth looking at areas where new coffee production might be developed, especially in disease free areas. Australia has a tiny cool climate coffee producing area in Northern NSW, which is ripe for major investment. Look out for a significant Agricultural group which identifies this opportunity. TFC Corporation [ASX: TFC], a substantial play in Indian sandalwood plantations in Northern Australia, gives a sense of the upside of a strategic Agricultural investment in Australia. TFC market capitalisation has trebled to $A700 mill in the last 12 months, with the initial harvests of sandalwood.

So there is something for everyone in the prospects for coffee, whether it be short term in existing coffee industry companies or looking out to where the coffee production industry is going in the future.

Editor's Note: This article covers a stock trading at less than $1 per share and/or with less than a $100 million market cap. Please be aware of the risks associated with these stocks.

Source: Hot Coffee

Additional disclosure: With a degree in agriculture, a PhD in Biochemistry and experience in growing Tech companies (including ASX listing), the author (who lives in Sydney) is interested in exploring the development of a significant coffee investment in Australia.

See the original article >>

Showtime for Apple: Big phones, smart watches and high expectations

by Christina Farr, Alexei Oreskovic and Noel Randewich

(Reuters) - It has been four years since Apple Inc introduced a completely new gadget and the pressure is on for the world's largest tech company to wow at its "special event" in Cupertino, California, on Tuesday.

Apple has fed the high expectations, with promises by executives that the company's best product pipeline in 25 years is being readied inside its secretive facilities. That's a high bar for a company whose hits include the modern, graphic-based personal computer, the smartphone, the iPod and the tablet PC.

Those now ubiquitous gadgets were created under the innovative and famously meticulous eye of Apple co-founder Steve Jobs, who died in 2011. When Chief Executive Officer Tim Cook takes the stage on Tuesday, technology aficionados, investors and rivals will be watching closely to see whether Jobs' handpicked successor inherited the magic touch or whether Apple's winning streak is coming to an end.

"We think Apple’s pipeline is finally going to satisfy those who have wondered if the company has any new products. The stock price has been rallying as investors are beginning to believe that Tim Cook all along was telling the truth that there is an incredible pipeline of products," said Michael Yoshikami, CEO of Destination Wealth Management.

In the last five years, the period beginning July 1 has been the most fruitful for holders of Apple shares, with an average price gain of about 22.5 percent, compared with 11 percent gains seen in the first half of the last five years.

Below are some of the key products and features to look out for at Apple's big event on Tuesday:

iWatch?: Rumors of an Apple smartwatch go back several years, but Tuesday may finally be showtime. The watch, which will reportedly have a flexible screen and come in two sizes, will track its wearer's health and fitness, double as an electronic wallet and of course, display messages.

The watch is not likely to go on sale until sometime in 2015 and Apple may not even reveal its price on Tuesday. But with rivals such as Google Inc and Samsung Electronics Co already entering the smartwatch market, tech-watchers are anxious for Apple to show its cards.

"The market has been waiting for Apple’s product as the real category-defining product," said FBN Securities analyst Shebly Seyfari.

iPhone 6: Smartphones are Apple's bread-and-butter, representing more than half of its revenue, and the company is expected to introduce a pair of new models with bigger screens, a sleeker design and wireless payment capabilities. The iPhone 6 will be available with 5.5-inch or 4.7-inch screens, a step up from the current models' 4-inch screens. There is also speculation that some phones will boast extra-tough screens made from scratch-resistant sapphire material.

Mobile Wallet: Apple has reportedly struck deals with major credit card providers Visa Inc, MasterCard Inc and American Express Co. The partnerships, as well as a special communication chip within the new iPhone and smartwatch, would allow consumers to use their gadgets at stores to buy everything from coffee to blue jeans - changing the shopping experience and extending Apple's reach from the Web to real-world commerce.

Health: Apple's launch of the "HealthKit" data service earlier this year made it clear that it sees its products helping consumers manage personal health information. By incorporating the HealthKit service into the iPhone 6, and by packing its smartwatch with sensors capable of monitoring physical movements and heart rates, Apple could lay the groundwork for a broader push into mobile healthcare.

One More Thing? Apple's Jobs was famous for surprising fans with unexpected products at the end of his presentations. Could Cook preserve the tradition with a peek at a long-awaited Apple television, a rumored bigger iPad or a completely unexpected product?

See the original article >>

Ukraine crisis accelerates Russia-China energy cooperation

By Germain Moyon

Russia aims to boost its economic ties with China, particularly in the energy sector, in the face of Western sanctions over Ukraine but this could prove a high-risk strategy.

On Monday, far from the fighting in Ukraine and the threat of fresh Western sanctions, President Vladimir Putin launched what is hailed as "the biggest construction project in the world" in Eastern Siberia.

The 4,000-kilometre (2,500-mile) "Power of Siberia" pipeline will connect Yakutia's gas fields with the Sea of Japan (East Sea) and also with the Chinese border.

From 2018, the Power of Siberia will for the first time allow Moscow to supply China with natural gas through a pipeline under a contract worth $400 billion over 30 years.

Ending 10 years of difficult negotiations with Beijing, the signing of the contract in May was a major success for Putin, whose annexation of Ukraine's Crimea peninsula and support for other Ukrainian separatist movements have led to the worst East-West standoff since the Cold War.

At loggerheads with the West, Moscow is seeking to refocus its gas and oil exports from Europe -- its main energy market -- towards Asia, and is diligently building an energy alliance with Beijing.

Gazprom CEO Alexei Miller (left), Vladimir Putin (2nd …

Gazprom CEO Alexei Miller (left), Vladimir Putin (2nd left) and China's Vice Premier Zhang Gaoli …

The shift suits China, which needs additional energy supplies to cover its growing domestic consumption.

Europe, shaken by the recent gas dispute between Moscow and Kiev, has also redoubled its resolve to reduce dependence on Russian fossil fuels.

- Record oil to Asia -

Russian gas giant Gazprom's Chinese contract will "provide a launch pad for the company's full-scale diversification into the Asia-Pacific region at a time when it is facing sales pressure in Europe", the Russian branch of Moody's Investors Service noted this week in a report.

But Moody's also warned of "challenges" to the eastward turn, "as China's ability to put pressure on prices and the sheer scale of the required investments could weigh on the future profitability of Russia's oil and gas sector".

An employee tightens a valve at the Bilche-Volytsko-Uherske …

An employee tightens a valve at the Bilche-Volytsko-Uherske underground gas storage facility, the la …

The value of the Russia-China gas contract is being kept confidential, but according to some leaks it was below Gazprom's expectations, while the required investments amount to tens of billions of dollars.

Russia has been more successful in carving out a niche in Asia's oil market -- thanks to a mega contract that the Russian state oil company, Rosneft, signed in 2013 with Beijing.

In mid-August the Wall Street Journal estimated that a record 30 percent of Russian oil exports had gone to Asia since the beginning of the year.

Russia's Energy Minister Alexander Novak said this week that its oil exports to Asia could eventually double, adding that Moscow was in talks with Asian companies willing to invest in liquefied natural gas (LNG) projects in Russia's Far East.

- On Beijing's terms -

Employees look at a pipeline at the new East Poltava …

Employees look at a pipeline at the new East Poltava gas booster compressor station not far from Ukr …

The China National Petroleum Corporation (CNPC) is expanding its Russia presence -- it holds 20 percent in an LNG project planned for the Arctic Yamal peninsula by Russia's Novatek Group and France's Total -- and is working with Rosneft on oil deposits in East Siberia.

This week Putin offered China a stake in the huge Vankor oil field -- considered one of the most valuable in east Siberia.

"If concluded, this deal would represent a major change," the Eurasia Group consulting firm said in a report on Wednesday.

"Rosneft's decision to offer China a stake in the mega Vankor oil field in East Siberia signals that Moscow's bargaining position has been further weakened by (Western) sanctions and that it needs the capital infusion."

The United States sanctions hit Rosneft hard -- forcing the company led by Putin's close ally Igor Sechin to request a bailout from the state to pay off a debt that exceeds $30 billion -- while Brussels restricted Russia's access to some technology aimed at the energy industry.

Russia's oil production -- with hydrocarbons the main source of state revenues -- is running out of steam at the moment and projects needed to revive it require huge investment.

As a result Moscow has little choice but to boost cooperation with China.

But "what Kremlin presents as a strategic partnership is simply a means for China to diversify its supplies", forcing Russia to accept Beijing's terms, Russia's Vedomosti business daily wrote this week.

See the original article >>

Follow Us