Tuesday, July 16, 2013

A loro insaputa

by Tommaso Merlo

Mamma e figlia deportate dallo Stato italiano all’insaputa della politica. Con il dittatore Kazako culo e camicia con Berluscash. E’ solo l’ultima barzelletta di questa deprimente fase storica. Come se gli italiani fossero davvero metà coglioni e metà drogati da una partigianeria politica accecante. Berluscash ha corrotto mezzo mondo a sua insaputa, si è scopato le bambine a sua insaputa, ha evaso le tasse a sua insaputa. Dall’altra parte i dirigenti del Pd hanno distrutto un’intera area culturale a loro insaputa, hanno castrato generazioni di democratici a loro insaputa. Scajola si è fatto la casa, mille comparse di ladri di ogni schieramento si sono arricchite a loro insaputa. Partiti e politici si sono intascati per decenni prebende indegne senza accorgersene. Hanno tradito gli elettori, hanno tradito la Costituzione, hanno tradito le istituzioni, hanno tradito il popolo. Tutto senza saperlo. In pochi decenni la classe dirigente italiana ha mandato in merda un intero Paese e si comportano come se tutto fosse avvenuto a loro insaputa. E dopo tanti anni continuano a mentire, a prenderci in giro, ad usare il loro potere per non rispondere mai del loro operato. Una devastante rapina del nostro futuro tutto a loro insaputa. Si, all’insaputa di sticazzi.
See the original article >>

Stock Market Tops as the Wedges are Broken

By: Anthony_Cherniawski

SPX crossed its lower trendline, as suggested, and is beginning to impulse down. There’s no support until it declines to its 50-day moving average at 1635.59. The cluster of supports are tightly positioned and it may take one attempt to break through, as opposed to the supports being widely spaced, forcing a stair-step decline.

The VIX has broken above its Bullish Wedge. This confirms yesterday’s Master Cycle bottom in the VIX. We will be watching closely to see how quickly the VIX breaks through its resistance zones, which curiously have doubled up at 15.24 and 16.31.

See the original article >>

Italy's First Black Minister Greeted With "Nooses On Lampposts"

by Tyler Durden

While the US has had its share of race-related social issues in recent days, nothing compares to Italy where not only was the country's first black minister (of integration!) of Congolese origin, Cecile Kyenge, compared to an orangutan two days ago by Roberto Calderoli, vice president of Italy's Senate and a senior parliamentarian in the anti-immigration Northern League, but following a visit to the city of Pescara she was met with a "protest" where nooses were hung from lammposts.

And just so the message was not lost, "he nooses appeared on lampposts with posters signed by far-right group Forza Nuova: "Immigration, the noose of the people!" read one of the slogans on the posters. Another said: "Everyone should live in their own country." Nothing like Italy, whose economy has been ravaged by the worst depression in decades, developing its own Golden Dawn movement to really help with integration issues and globalized worker mobility.

From AFP:

Kyenge, who is of Congolese origin, has called for a reform of Italian law to make it easier for children born to immigrant parents to acquire citizenship.

Prime Minister Enrico Letta called for an end to the insults against Kyenge, saying this was a "shameful chapter" for Italy and could lead to a "major clash".

Ever since being named to the cabinet in April, Kyenge has faced a barrage of abuse - particularly from members of the anti-immigration Northern League party.

Northern League MEP Mario Borghezio said her nomination was "bloody stupid" and that she had "a face like a housewife", while one local party activist said the minister should be raped in a vicious Facebook rant about crimes committed by immigrants.

Northern League senator Roberto Calderoli, who has courted controversy for years with a series of racist, sexist and Islamophobic jibes, on Saturday said: "When I see pictures of Kyenge, I cannot help thinking of similarities with an orangutan".

In an interview with La Repubblica daily out on Monday, Calderoli then claimed that he had animalistic comparisons for all the ministers, including ones who looked like a frog, a peacock and a St Bernard's dog.

Letta on Monday said Calderoli's remarks were "unacceptable" and called on Northern League leader Roberto Maroni to put an end to the attacks by his party members "as quickly as possible".

Calderoli is deputy speaker of the Senate and there have been calls for his resignation from centre-left lawmakers and anti-racism campaigners.

Ah, zee political stabeeleetee. Then again, with the "untouchable Don" Mario Draghi, whose own past is checkered beyond comaprison in charge of Europe, courtesy of the Goldman Sachs immunity, not even race war breaking out in Europe will make a dent on the ECB's intentions to centrally plan the future of the continent using peripheral bond yields for the long to very long term future.

And not surprisingly, courtesy of precisely such social distractions, it is the "Mario Draghis" of the world, not to mention Italy's far more "deserving" politicians, that have so far completely avoided even one noose on even one lammpost in all their Gulfstream-chartered, taxpayer-funded jaunts around the world.

See the original article >>

Yuan daily volatility hits record levels

by SoberLook

Over the past few weeks, the daily volatility in the dollar/yuan exchange rate hit record levels.

Yuan FX volatility

China's authorities have tight controls over the yuan's longer term level but they have a more "relaxed" FX exchange rate policy over shorter periods. While the specific transactions causing this volatility are not known, a couple of trends seem to be contributing to larger fluctuations in the exchange rate.
1. Exporters who submitted fake tickets for sold inventory to allow them to take speculative currency positions (particularly with respect to the HK dollar, which is linked to USD) have been precluded from continuing this activity (see post). Some had to unwind positions in the spot market.
2.  Borrowing US (or HK) dollars in order to short them now requires additional collateral, which makes bets against the dollar more expensive. That increased collateral rule went into effect a couple of months ago, but some of these forward trades are just now maturing.
3. The forward and options markets have seen a spike in trading volumes, as investors take bets on China's economic trajectory.

Bloomberg: - Volume in options on the dollar-Chinese-yuan exchange rate amounted to $3.83 billion, the largest share of trades at 19 percent. ... Dollar-yuan options trading was 101 percent more than the average for the past five Tuesdays at a similar time in the day, according to Bloomberg analysis.

And that is also adding to the volatility in the spot market.
Whatever the case, at least some of this volatility underscores the rising uncertainty with respect to not only the direction of the economy, but also to the PBoC's policy and regulatory framework going forward. Furthermore, this is an indicator of increased concerns about China's wealth management products (see story) and the risks associated with potentially unwinding this massive credit market.

See the original article >>

Signs That the Silver Price Has Bottomed

By: Jason_Hamlin

I have not written a public article in several months. This is mainly because I have been waiting for a buying opportunity to develop in precious metals. As a fairly aggressive investor with a high risk tolerance, I took a stab when silver originally dropped to technical support around $27. I have a few small cuts from attempting to catch the proverbial falling knife, but I was quick to release and walked away relatively unscathed.

The waterfall decline from $27 to $18.50 has resulted in many silver investors throwing in the towel and exiting their positions. However, this is herd mentality and every successful investor knows it is almost always a failing strategy. With sentiment near all-time lows and blood still running in the streets, I am doing the exact opposite and wading into the waters once again.

I remain convinced that the long term prospects for precious metals are favorable and the bull market has several more years to run. At this juncture, I also believe we are witnessing an incredible short-term buying opportunity that will probably be the last of its kind. It takes a tremendous amount of courage to go against the herd, but this is where the real money is made.

When silver spiked to $15 in 2006, I was ecstatic with a near tripling in price from my original entry point. New investors looking to enter the sector would always lament that they missed the boat and wished they would have bought earlier. For them, it was too late and so they didn’t buy silver at $15.

In early 2008, silver spiked to $20 and many of the same people hesitated because they believed it was once again too late to buy. With the collapse of Lehman Brothers and ensuing financial crisis, the silver price fell to around $8 and I encouraged these same investors to buy the dip. But they were frozen with fear and kept their cash in CDs and savings accounts paying interest of around 3%.

When the price once again broke out above $20, they were kicking themselves for not buying the dip and decided they had once again missed the boat. Silver then rocketed to around $49 in roughly 18 months, generating an incredible gain of 150% in physical metals and gains of 500% or more in many of the mining stocks that we track.

We’ve all heard this sad story. It is the experience of most investors that are unable to pull the trigger when prices are low and everyone else is selling. They always wish they had bought earlier and end up chasing prices higher, buying at or near an intermediate top. This majority is a gift to the contrarian minority that is happy to relieve them of assets at deeply discounted prices.

So to the investors that have emailed me in the past wishing they had bought earlier, here is my observation of the current state of the silver market… NOW is ‘earlier.’ In 6, 12 or 18 months, I believe you will be looking back at $20 silver and wishing you would have bought earlier. When the fuse is lit under the silver price, the upward momentum can be just as powerful as it was to the downside.

I believe both the fundamentals and technicals are suggesting that silver is at or near a bottom for the current corrective wave. While the June 27 low of $18.50 is most likely the bottom, I am not so naive as to state that the price cannot move lower. Investors are an emotional bunch, easily swayed by comments from politicians and bearded men. And I fully realize that if Western governments and their banking partners masters want lower gold and silver prices, they have the paper mechanisms to do as they please in the short term. In the long term, supply/demand fundamentals always tend to re-assert themselves.

Zombie investing and short-term manipulation aside, here are six signs suggesting that silver has bottomed and is headed higher in the back half of 2013…

1) The silver price decline is indicative of capitulation selling and panic, which suggests a bottom It has been nearly as steep as the 2008 decline when the entire global financial economy was at risk of collapse. Yet, we are not in the midst of any type of a (public) financial panic. To the contrary, stocks have been climbing higher and the banking sector is reporting a surge in profits that are handily beating expectations. There really isn’t much to justify the magnitude of the decline that we have seen in silver. As investors tend to overshoot in both directions, this sell off appears to be a knee-jerk emotional reaction without much substance driving the decline.

2) Mining stocks are outperforming and tend to lead the metals After dropping much faster than silver, we are seeing signs in the past week of quality mining stocks outpacing their underlying metals. While silver is up 4.5% in the past week, many of the silver miners are up 8% or more. Of course, they tend to offer this leverage in both directions, but I like to see a quick swing back to leverage on the upside near a turnaround such as the one we have witnessed in the past week.

3) The silver price is now below the true all-in cost of production for many miners Estimates vary, but the average number is thought to be around $20 per ounce. How many items can you buy in the marketplace at or below the cost to produce it? Can you buy a gallon of gas at the production cost? Can you buy fruits and vegetables at the cost of farming the items? Can you purchase a new flat screen TV for less than it costs to manufacture? Of course not. This anomaly in the silver market can not last very long. Silver miners will be forced to shut down unprofitable mines, resulting in lower supply in the short term. They will also be forced to slash budgets for exploration and development, which has the potential to lower supply well into the future. Which leads to point #4…

2013_american_silver_eagle_obverse_1 
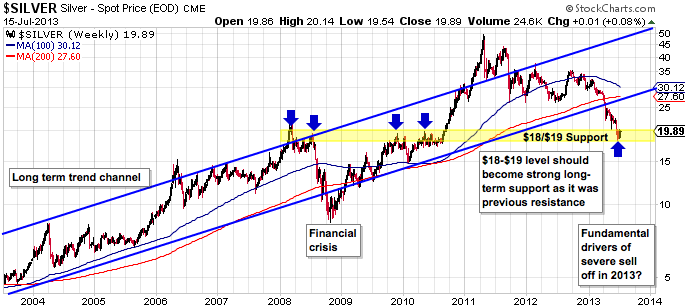
4) The supply and demand fundamentals are increasingly bullish for silver While supply has been rising marginally, demand has been picking up significantly both from the investment and industrial sides. Investment demand in bullion is at all-time highs in 2013 and has resulted in shortages and high premiums on popular mint coins. Year to date sales for the popular silver eagle coin reached 25,043,500 as of July 1st. This amount is up by 44.0% from the mid year total for last year. More significantly, the year to date sales are up by 12.3% compared to the mid year sales total for 2011, when annual sales had achieved the current record high of 39,868,500. This should only accelerate in the coming months as bargain hunters load up on sub-$20 silver. Industrial demand also appears to be picking up after dropping last year. This is being driven by a recovering global economy and resurgence of demand from the solar industry. And unlike gold, silver gets depleted in industrial applications and ends up scattered in quantities too small to justify salvaging. So while all of the gold that has ever been mined still exists for re-sale, silver stockpiles decline each year and must be replenished with new mining.

5) The FED is not going to significantly reduce their QE program anytime soon Even the hint of slight tapering in the future crashed the markets and FED officials had to backtrack. Just when there was a building consensus that the FED would begin tapering this year, Bernanke announced that “highly accommodative monetary policy for the foreseeable future is what’s needed.” Imagine if they actually eliminated QE immediately. Ouch! A cursory examination of the FED’s key mandates also suggests that no significant tapering will occur anytime soon. Core inflation remains very low and unemployment remains high, so if anything we are likely to get more FED stimulus and not less. The FED may deliver the easing in a slightly different manner or even give it a different name, but I don’t think they can take away the punch bowl anytime soon. Rates must remain artificially low to keep the debt serviceable and keep the housing market from crashing. And we should really keep all of this tapering talk in perspective…

6) The technical chart suggests there is support around $18.50 and silver has bounced off this level in the past week I take technical analysis with a grain of salt, especially considering the degree of manipulation in this sector. However, this level around $18-$19 was strong resistance on four separate occasions from 2008 to 2010. Resistance often turns into support. The stronger the initial resistance, the stronger the future support. Furthermore, if you look at the long-term trend channel outlined in blue, you can see that silver has remained within this channel for 90% or more of this entire bull market. The only times when it made a significant move outside of the channel was during the financial crisis of 2008 and during the exponential move towards $50, which proved to be a very short-lived spike. Silver is now at levels as severely oversold as it was during the depths of the 2008 crisis, which makes little sense given the current absence of any full-blown crisis. Either the precious metals bull market is really over or silver is due for a bounce back above $30 and into the long-term trend channel charted above. You will have to make that call for yourself, but I personally assign the probability of this bull market being over somewhere between zero and pigs flying.

Conclusion

Both from a fundamental and technical perspective, silver looks to be oversold at current levels. The metal was due for a correction after the overblown move towards $50 in 2011. But just as it overshot to the upside, I believe it has now overshot to the downside. This is even more apparent with mining stocks, which are more undervalued relative to the metals than at any point during the current bull market. These companies may see more downside as Q2 earnings disappoint, but I believe much of this risk is already baked into current valuations.

I never advocate going ‘all in’ at one juncture, but I believe this is an excellent opportunity to start scaling into new positions or adding to current positions. I like to do this in tranches, buying a set amount of both physical silver and best-in-breed mining or streaming stocks every few months. This ensures that you don’t deplete all of your cash just prior to another move lower, while also allowing you to get ‘skin in the game’ at levels that appear to be near the bottom of this prolonged correction.

See the original article >>

Commodities 2013 halftime report: A time to mine for opportunity?

By Frank Holmes

It was a challenging first half of the year for most commodities, with only two resources we track on our Periodic Table of Commodities Returns rising in value. Natural gas (NYMEX:NGQ13) and oil (NYMEX:CLQ13) rose 6.5% and 5%, respectively, while silver (COMEX:SIU13) lost a third of its value and gold (COMEX:GCQ13) lost a quarter of its price from the beginning of the year.

At first glance, the correction seems to support naysayers who believe the supercycle in commodities has ended, such as Credit Suisse analysts, who had declared that the “era is over,” in its digital magazine, The Financialist.

We disagree. Instead, we see severe price declines as possible buying opportunities during this ongoing commodity supercycle.

Consider the extreme pessimism in gold. As one measure of how bears have ganged up against the yellow metal, take a look at the spike in the level of short positions on the precious metal since the beginning of the year. As of the beginning of July, the number of outstanding gold short contracts was close to 140,000!

In June, while I was on CNBC’s Squawk Box, Howard Ward, the chief investment officer of GAMCO Investors, made a bullish call based on the severity of the speculative short position:

“It was off the charts, just like it was a week ago for the short position and the yen, the pound and euro. Well, we’ve seen what happened to that. You wanted to be on the other side of that trade. I’ll take the other side of the gold trade as well. Whenever so many people are on one side, I will take the other side. I think gold probably rallies between here and the end of the year.”

There is certainly a pervasive sense of doom and gloom not only for gold, but for the entire resources space. BCA Research’s Commodity & Energy Strategy report points to a recent Bank of America-Merrill Lynch fund manager survey, which shows that exposure to commodities is as low as it was at the end of 2008. The firm’s first-hand experience reveals a similar investor reaction to resources: “Recent client visits to Europe, Australia and Asia confirm widespread pessimism toward the outlook for ‘anything outside the U.S.,’” says BCA.

This is all music to a contrarian’s ears because it’s another sign of a bottom, but BCA advises taking a “patient approach to front-running the eventual cyclical rally in commodities.” It’s all about your time horizon, says the firm.

Supercycles are not short-term; rather, they are long, continuous waves of boom and bust that can last several decades. While the overall trend is up, there are often short-term bursts of volatility. And looking over the next decade or so, the trends driving the current commodity supercycle remain in place.

I recently read an insightful report on the subject from ETF Securities. In it, analysts highlight two primary long-term drivers.

One entails the urbanization and industrialization trends that are “resource-intensive,” specifically, those found in emerging markets with large populations. Take their energy use, for example, which is “only a fraction of the developed world equivalent,” says ETF Securities. Developed markets, including Australia, France, Germany, Japan and the U.S., all have a higher GDP per capita as well as greater energy use than the emerging markets of Brazil, India, Mexico and China. These countries have significantly large populations, and “a relatively modest rise in per capita energy use will transform into a large absolute increase in global energy use.”

According to ExxonMobil’s 2013 “Outlook for Energy” report, the energy demand in developing nations “will rise 65% by 2040 compared to 2010, reflecting growing prosperity and expanding economies.”

The second driver of the supercycle is the rising cost to produce many commodities, says ETF Securities. I’ve discussed on numerous occasions the difficulties facing gold miners, which have seen lower grades and a lack of discoveries. This has made mining the yellow metal more expensive. And, as I indicated in a recent post, with a lower gold price, miners are rethinking projects that are too costly.

With many other commodities, resources companies are increasingly facing labor strikes, increased taxes and a backlog of projects that ultimately drive up the cost to mine and produce.

We agree with ETF Securities that the supercycle in commodities is alive and well. We are also in agreement with Credit Suisse when the firm explains that “the prices of individual commodities will no longer rise and fall together as they have for the last five years.” Instead, investors “are going to have to focus on the specific supply and demand dynamics for individual commodities.”

In this environment, an active manager with a wealth of experience can thrive. In our experience, commodity prices can move quickly and an active manager is able to tactically shift assets into areas of opportunity.

So, instead of trying to guess which commodity will outshine all others, we suggest diversifying across all commodities to try to smooth out the inherent volatility. See the approach that the Global Resources Fund (PSPFX) takes here.

And when it comes to gold, my position remains: Maintain a 5% weighting in gold bullion and a 5% weighting in gold stocks, selling when the price moves up significantly and buying when the opportunity presents itself.

See the original article >>

Is silver ready for a breakout or the final bottom?

By Przemyslaw Radomski

Last week the price of the white metal (COMEX:SIU13) climbed to an over two-week high after U.S. Federal Reserve Chairman said its huge stimulus program would stay in place for some time. Investors are now focused on Ben Bernanke once again.

"The main focus is Bernanke's testimony to the Congress, and that should really give us more guidance to whether tapering will start in September or December," Danske Bank analyst Christin Tuxen said.

Could this above-mentioned event trigger a breakout above the important resistance level? Or maybe the worst is not behind us and we will see further declines in  silver?

Recently, there has been much talk about gold’s price. This has pushed silver a little bit to the side, which we don't think is quite fair. Because of that, we devote our today‘s analysis solely to the white metal. Let’s take a look at the charts and find out what's the current outlook for silver.

Today we will start with the analysis of the silver long-term (charts courtesy by http://stockcharts.com).

Click to enlarge.

In this week’s very long-term silver chart, we have a situation somewhat similar to what we saw happen with gold last week. Silver also moved higher and attempted to move above the declining resistance line, finally closing right at it (a few cents below the $20 level) without breaking it.

Technically, at this time we have no breakout, so the situation remains bearish (even the short-term trend). The downtrend will remain in place here unless silver can increase and hold a breakout above the $20.70 price level (this is a short-term resistance level based on the intra-day highs).

In the recent days we haven’t seen such action. Therefore, in our opinion last week’s rally was nothing more than a contra-trend bounce.

Once we know the current situation in silver, we think it would be interesting to revisit the silver-to-gold ratio to see how the two are valued relative to each other.

Click to enlarge.

In the silver-to-gold ratio chart, we still see no signal of a bottom.

As we wrote in our essay on gold, stocks and the dollar on June 26, 2013:

(...) the final bottom for the white metal is often preceded by a big underperformance of silver to gold.”

We have not seen signs of such action last week, so it seems that the final bottom is still ahead of us.

If that’s the case and the white metal is about to move lower, let’s take a look at our final chart today and find out if it confirms the bearish clues.

In this medium-term SLV ETF chart we see that silver is now slightly above the declining resistance line. We should pay attention that this level coincides with two more resistance levels.

The first is the 20-day moving average, the red slope in our chart, which has proven to be an important resistance line since it was broken in February. It has been tested a number of times since, and such is the case once again. All the previous cases were followed by downswings.

The other level is the first Fibonacci retracement level, 38.2% based on the June decline. From this point of view we can clearly see that silver did not move above these two resistance levels.

At this point, we think it’s worth to mention another bearish indication.

Last week we saw a move to the upside for silver on relatively weak volume. In the recent past, this was also seen before bigger declines. This was the case in early June, late May, early May and also in April. It seems that we have this once again (the volume we saw yesterday was exceptionally tiny).

Summing up, silver moved higher last week and rose on Thursday to its highest level since the June 28 low. Despite this growth, there was no breakout and the downtrend is still valid. We think that the next move for silver will be down and in tune with its recent and current short-term trend.

Thank you for reading. Have a great and profitable week!

See the original article >>

Austerity and Gross Domestic Production

Posted by Eugen von Böhm-Bawerk

The Europeans tried austerity, the act of reducing budget deficits, and they did not like it. It was no fun, so they decided to focus on growth instead. We have no idea what that means, but apparently they believe they can go back to the heydays when consumption had nothing to do with actual production. For example, the Greeks ran a massive goods deficit with the rest of the world (and they still do). At the peak this amounted to a staggering sum of 48 billion euros. At the time that meant almost 12 thousand euros per Greek worker, which corresponds roughly to what he made on a net basis that year! In other words, the Greek worker got 12 thousand euros from his employer which he spent on consumption and simultaneously consumed an additional 12 thousand through indebting himself to foreigners. According to the Organization of Economic Co-operation and Development (OECD) saving rates in Greece, as per cent of disposable income, is deeply negative and has been for many years. In other words, the Greek society has consumed far more than they themselves produced of value. This is not unique to the western world; on the contrary, most western countries have consumed more than they have produced for quite some time.

Knowing a thing or two about capital theory we would expect output in these economies to nosedive over the same period. Production comes out of capital accumulation and if society regresses through capital decumulation it follows logically that output must fall. However, if we look at consumption and GDP in Greece since 2000 we find a positive correlation! And even more striking, the correlation between savings and GDP is negative! Everything we have ever learnt about personal finance, building a business or capital theory seems lopsided! According to the data it is the exact opposite! The more you consume and the less you save the more you grow your economy!

To make matters even more obscure, we can also find a positive correlation between government expenditure and output. If the government spends more money output increases and visa verse. No wonder the Europeans found austerity boring. Only an evil person (or an environmentalist) would advocate austerity when faced with such “proof”.

Source: Eurostat, OECD, own calculations

Source: Eurostat, own calculations

In order to answer this apparent conundrum we need to ask ourselves what GDP actually measure? In “Taking the Pulse on the Economy: Measuring GDP” by Landefeld et al. we learn that “the method [to calculate GDP] produces consistent estimates of the value of final sales to consumers…” in addition one has to add “government expenditures on goods and services”. This is what economists call final demand, or expenditure, approach. In other words, gross domestic production is derived primarily from household and government consumption. We say primarily, because statistical bureaus do adjust for net exports and government transfer payments. However, as per cent of the total these are relatively small.

The Bawerk.net reader will immediately understand why we consistently call GDP for gross domestic consumption, or GDC. It does not measure production at all, but rather consumption. And due to today`s perverted credit system the two can be completely decoupled both for individuals and nations!

Historically the so-called GDP concept were made out of the Keynesian worldview expressed in the infamous tautological equation Y = C + I + G + X where output (Y) equals consumption adjusted for net export.

Through a complete obfuscation of the terms and expression now used in our daily conversation about economics we often hear utter nonsense such as the US economy is driven by household consumption. In sheer ignorance one can even hear self-proclaimed experts; banksters and pundits state that 70 per cent of the US economy is household consumption. If that were true, we would see the following development in the US of A:

The simple fact that we do not see this should be enough to discredit the whole notion of GDP and we recommend everyone to start call it what it really is; gross domestic consumption, or GDC. Only by doing so can we once again have a meaningful conversation about economics in general and austerity in particular. Yes, if you reduce consumption, then measured consumption as expressed by GDC will also fall. Conversely, if you lower your saving rate GDC will increase.

However, there is an entirely different way of thinking about GDC. We have established that GDC measures aggregate demand. We also know that aggregate demand (AD) can be expressed in currency units. In other words, GDC = AD = M2*Velocity. We also know that M2 = monetary base * multiplier. Substituting for AD, we can say that GDC = Velocity * (Monetary base * multiplier). In this sense we can deconstruct the GDC for every nation with available statistics as pure monetary phenomena. The next chart shows US GDC as reported by the Bureau of Economic Analysis (BEA) and broken down to its logical monetary constructs.

Source: Bureau of Economic Analysis (BEA), Federal Reserve (Fed), own calculations

Suddenly it becomes obvious how destructive programs such as quantitative easing (QE), which allocate resources directly into the ominous 1 per centers pockets, can actually lift GDC. At this point the reader might ask if the price deflator used to calculate a real GDC number will compensate for the effect from QE-programs.

We test for that by deflating GDC with various price gauges, such as the official BEA GDC deflator, the BLS CPI, the Billion Prices Project (only from 2008) and ShadowStat`s constant CPI methodology to see what have happened with real GDC. Interestingly enough, the BEA deflator that is actually used to derive the real GDC number is the most lenient. Even using the CPI we get consistently lower GDC growth. If we were to use Mr. Williams’s constant CPI methodology concept we see how detrimental overconsumption can be to actual wealth creation to the extent GDC measures wealth.

Source: Bureau of Economic Analysis (BEA), Bureau of Labor Statistics (BLS), Billion Price Project (BPP), Shadowstat (SGS), own calculations

Conclusion

The concept we call gross domestic production is highly distortive. In obfuscate intelligent debate in economics as the true underlying force for economic growth, capital accumulation, is seen as detrimental to prosperity.

See the original article >>

Both Ends Burning

by Pater Tenebrarum

Political Risk Threatens to Reignite Crisis in Europe

It couldn't come at a more inopportune moment: the crisis that is increasingly engulfing Mariano Rajoy, and the mounting legal troubles besetting Silvio Berlusconi, the realization that Portugal's crisis remains intractable and Greece  careening toward another summer of discontent (even as the tourism industry is recovering slightly), as civil servants and their unions gear up to fight the latest troika-imposed cuts. The moment is so inopportune because Olli Rehn and others have to once again fear for their summer vacation. Euro area crises  have an odd habit of flaring up in the middle of the summer.

Rajoy's troubles, as some speculate, may actually be the result of a kind of palace coup: apparently there are factions within the PP that want to be caliph instead of the caliph. No-one ever doubted that Spain's politics were riddled with corruption, so the main question should actually be: 'why is it all coming to light all of a sudden'? After all, if former PP treasurer Louis Barcenas is to be believed, the particular scams he and his buddies were engaged in went on for 20 years running. Former prime minister Jose Maria Aznar has been mentioned as a possible culprit, but he too is on the 'Barcenas list' of receivers. Others suspect that the Most Excellent Countess of Bornos, Esperanza Aguirre y Gil de Biedma, the former president of Madrid, may have a hand in the proceedings, since she isn't implicated and is loudly calling for a clean-up of the party.


watched
Somewhere in the PP, there is an Iznogoud lying in wait.

(Tabary, Goscinny)


Interestingly, Rajoy seems to be on a mission to remain right where he is, regardless of what new information comes to light (the latest being his text messages of support to the jailed Barcenas). The FT reports:

“Mariano Rajoy was battling on Monday to contain the political fallout from the slush fund scandal that has rocked his party, dismissing calls for him to step down and warning of the risks of plunging Spain and its long-suffering economy into “political instability”.

“I will defend political stability and I will complete the mandate given to me by the Spanish people,” the Spanish prime minister said.

His comments came amid growing concern over the political and economic impact of the scandal, which revolves around allegations that the ruling Popular party operated a slush fund from which it made undeclared cash payments to senior party leaders.

The affair has sapped the government of political capital and popular support at a time when Madrid is locked in a desperate struggle to lift the country out of recession and tackle Spain’s unemployment crisis. European leaders and foreign investors have long regarded Spain’s political stability as a key asset – and one that has set Madrid apart from other crisis-hit countries in southern Europe, such as neighboring Portugal.

Polls show the scandal has already inflicted severe damage on the standing of both the PP and Mr Rajoy personally, with fewer than a quarter of voters saying they would vote for the ruling party if elections were held now.

Mr Rajoy was speaking just hours after the man at the center of the scandal launched a fresh legal broadside against the prime minister and other senior PP officials. Luis Bárcenas, the former party treasurer, told a criminal court in Madrid that he indeed managed a slush fund that was fed by secret donations from construction companies and other businesses.

According to several accounts of the closed-door hearing, he also confirmed allegations that the fund was used to make quarterly cash payments to top party functionaries, including to Mr Rajoy himself. In a new revelation, Mr Bárcenas said he made additional cash payments worth €20,000-€25,000 to Mr Rajoy and to Dolores de Cospedal, the party leader, between 2008 and 2011.”

(emphasis added)

It doesn't sound as though that 'key asset' of political stability is still worth much in Spain, but for now Rajoy and his supporters have decided to attempt to undermine Barcenas' version of events by implying that he is just trying to divert attention from the €48 million he managed to spirit away for himself.


Spain, 10yr. yield

Spain's 10 year government bond yield – no big moves yet, but it remains at some distance from recent lows – click to enlarge.


IBEXThe IBEX index in Madrid, weekly – click to enlarge.


Cavaliere in Dire Straits

That Berlusconi's past is now catching up with him is fairly easy to explain: the eurocratic elites want to get rid of this embarrassing maverick. He's not with the program, no fan of Monti's austerity policies and on record for stating that Italy should rather opt for leaving the euro than becoming an economic vegetable under the diktats of Brussels. The peculiarities of Italy's penal code ensure that Berlusconi will never see a prison from inside, but if he gets convicted again, it will almost certainly finish his political career. Ironically, he is driven to keep going as a politician precisely because he can most effectively fight against the courts from a position of political power.

However, if his final appeal in a tax fraud case on July 30 ends with a conviction, he will be banned from public office for five years – his political career will be over. Not only that, his party will lose its main attraction. It is interesting how this case has progressed. The latest developments suggest that the outcome is almost preordained:

“Lawmakers from the People of Liberty party, known as the P.D.L., asked for time for consultation, the day after Italy’s highest court scheduled a hearing on July 30 for Mr. Berlusconi’s final appeal in a tax fraud case. This date came months earlier than expected. The decision by the court, motivated by the need to prevent the statute of limitations from expiring on one of the charges facing the former prime minister, caused a political uproar.

A definitive conviction would result in a five-year ban from public office for Mr. Berlusconi. If the high court’s decision is upheld by the Court of Cassation and by Parliament, it would likely result in a political earthquake for the left-right coalition.”

(emphasis added)

Meanwhile, a burgeoning scandal over the deportation of the family of a Kasakh dissident threatens to sink Berlusoni's top political aide and his man in Italy's cabinet, interior minister Angelino Alfano.


Italy-10yr. yieldItaly, 10 year government bond yield – click to enlarge.


MIBThe MIB Index in Milan, weekly – click to enlarge.


Political Risk Likely to Crystallize Somewhere

As Nordea points out in a summary of the growing political risks in the euro-land periphery, it would almost be a miracle if all the bullets were dodged. In brief:

Greece's government is hanging by a thread. The now smaller coalition (minus the Democratic Left, which has taken 14 MPs with it), has a slim majority of just five seats in parliament. It won't take much to bring it down, and the government may not be able to push through the 'troika's' demands without breaking apart (note in this context that junior partner PASOK is strongly intertwined with the public sector).

In Portugal it is not certain that the socialist opposition will yield to the president's demand of a 'national salvation agreement' with the tottering government – it is after all leading in the polls at the moment.

As to Italy and Spain, see above – it should also be mentioned though that Italy has just been downgraded again, along with France. The recent Fitch downgrade of France, which is a major guarantor of the EU's bailout vehicles, has incidentally also led to a downgrade of the EFSF.

John Dizard writes in the FT that the new rules that allow rating agencies to only issue ratings on European sovereigns at set time intervals could lead to unintended consequences (surprise!):

“European authorities, even more than their US counterparts, have taken note of the shortcomings of rating agencies, which now must allow at least six months between changes in the ratings of EU sovereign issuers. The US regulators are still chafing at the restrictions imposed on them by the First Amendment’s “freedom of speech”. And yet . . . isn’t it possible there could be unintended consequences of these changes? Consequences that could lead the hated speculator class to make outsized, socially useless, profits?

For example, when S&P downgraded the Italian sovereign to triple-B last week, it suggested that the next change, obviously at least six months from now, could be for more than one notch. After all, by next February it may appear to be the case that Italian political, economic, and financial risk is accelerating at a rapid rate. If so, the agency could be in the position of being forced to rate Italy as an investment-grade credit long after Beppe Grillo or his successors and allies had followed through on their threat to turn it into a junk issuer.

The tightening in collateral requirements by regulators and institutional risk managers could have even more serious effects. Take a look at the Bank for International Settlements’ May 2013 Paper No. 49 on “Asset encumbrance, financial reform, and the demand for collateral assets”.

You really must read the entire document, perhaps at the beach. It goes into interesting details such as “the cliff effect”, which is not a good thing, and “procyclical liquidity management practices”, which means that crashes get bigger as financial institutions demand more and better security from their counterparties.”

(emphasis added)

Dizard suggests that one way of making a bit of 'socially useless profit' out of this situation would be to go long German Bunds before Italy's rating is dropped to junk. After all, in that case there will likely be a scramble to get hold of the above mentioned 'better security' provided by collateral issued by Germany, i.e., the recently favored carry trades would likely go into reverse in a hurry.


Germany 10 yr. yieldGermany, 10 year Bund yield – click to enlarge.


Nordea also mentions in passing that neither the Cyprus crisis, nor the still simmering situation in Slovenia can be said to be 'over' by any stretch of the imagination (Slovenia's budget deficit is set to double after the bank bailout. Note that since the banks belong to the government, it is essentially bailing out itself).

The Luxembourg snap election due to JC Juncker resigning over a spying scandal is probably not so important (it is interesting that in Luxembourg, the prime minister has to resign over a spying scandal, while elsewhere much greater spying scandals seem to be taken in stride by the ruling class). How important the steep slide in president Hollande's popularity is remains to be seen.

It is a good bet that Bryan Ferry didn't have Mariano Rajoy, Pedro Passos Coelho, Silvvio Berlusconi and Antonis Samaras in mind when he wrote the following words, but they are oddly appropriate to the situation (the people 'counting sheep' would be the bond traders buying periphery bonds at present in the hope that the fire won't reach them):

Both ends burning while you're counting sheep

Hell– who can sleep in this heat this night?

Tell me will I ever learn?

It's too late, the rush is on

Both ends burning and I can't control

The fires raging in my soul tonight

Oh will it never end?

Put your foot around the bend

Drive me crazy to an early grave

Tell me what is there to save tonight

Both ends burning

Burning

Burn

Keep on burning till the end, until the end

Keep on burning till the end, the very end”

(from Roxy Music's 'Both Ends Burning')

Conclusion:

The summer of 2013 may become more interesting than was hitherto expected.

See the original article >>

Chinese cotton inventories may usher in the bear

By Sholom Sanik

Global cotton (NYBOT:CTV13) output is expected to fall by 2.6% from the previous season, to 118 million bales, while consumption is expected to grow by 2.2%, to 110 million bales. Still, the balance sheet for the global cotton market is set to record yet another production/consumption surplus that will be heaped on top of burdensome carryover stocks from the 2012-13 marketing year. Ending stocks are estimated to grow to a record 94.34 million bales, or a staggering 85.9% of usage. That’s up from 79.6% last season and 68.9% in 2011-12.

What’s been keeping the market afloat, and whatever it is, can it last?

The U.S. is the world’s largest exporter of cotton, so there is a heavy focus on the U.S. crop. Planted area was 17% below last year and 30% smaller than in 2011-12. The crop was planted very late because of the very wet spring. Some key growing regions in Texas are now experiencing severe drought that will probably result in a high rate of abandonment that will reach 40% in the Southwest.

Average national yields are expected to suffer, falling to 831 pounds per acre, compared with 887 pounds per acre last year. In the July crop report, the USDA raised its acreage and yield estimates, but also increased its estimate for abandoned acres, leaving the forecast for the crop unchanged from June at 13.5 million bales. That will be the smallest crop since 2009-10. The supply side is not the issue, though. As illustrated above, warehouses are bursting at the seams. Crops in producing nations, other than the U.S., are about the same size as in recent years.

The Indian monsoon has been above average. The USDA raised its estimate for Indian production by 1 million bales from its June estimate, to 28 million bales, or 5.6% higher than last year. The upward revision was possibly a reflection of the successful passing of the critical on-time arrival of the monsoon. The Chinese crop is down 1 million bales from last year, or 2.8%, but that is not very likely to result in increased imports — as explained below. A U.S. crop failure — while, still a possibility — may not mean what it once did.

As with many commodities, Chinese import trends are the key. China’s cotton stocks have ballooned to 59 million bales — having grown from only 10 million bales in 2010-11. The government is rumored to be poised to sell off inventories, and imports are expected to decline. In 2011-12, 54% of U.S. exports went to China, compared with only 42% for the current marketing year.

Chinese imports from all sources peaked in 2011-12 at 24.5 million bales. In 2012-13 that figure fell to 20 million bales, and for the coming season, imports are expected to plummet to only 11 million bales. If China were to unleash its stocks, it would take a full season or perhaps two to see it return as a steady and reliable purchaser.

The flip side is that we do not actually know how large the stockpile is. The only solid information is the study of China’s importing patterns. But as such, we may indeed be at the beginning of a period of greatly reduced Chinese imports.

U.S. shipments for the outgoing 2012-13 marketing year have tapered off over the past four weeks, averaging only 160,000 bales. The July crop report cut the export estimate by 300,000 bales, to 13.3 million bales. But with only three weeks left to the marketing year, exporters would have to ship just under 300,000 bales per week to reach the USDA target, which is unlikely to occur. The USDA will have to cut its estimate again, which will increase the already-exhausting estimates for ending stocks.

We were stopped out of long position at 82.5¢ per pound, basis December, as per our May 8 recommendation. Massive global stockpiles will eventually find their way to the market and will depress prices. Establish short positions in December cotton. Place initial stops at 88¢, basis December, close only.

See the original article >>

High Gas & Oil prices will damage the consumer if this happens-

by Chris Kimble

CLICK ON CHART TO ENLARGE

Without a doubt high gas prices has its negative impact on the consumer.  The talking heads have been discussing how high gas prices could reach in the near future. Lets step back for a moment and look at Crude oil prices, traders positions and gas prices.

The upper left chart reflects that traders have established positions where Crude oil has been closer to a high than a low over the past few years. The upper right chart takes a different slant on traders positions in crude oil, yet the message is the same. The lower left chart reflects that a falling resistance line is coming into play in gasoline futures, that has stopped the rally in the past couple of years.

Bottom line, resistance is at hand in Crude oi & gas futures. If the oil markets can break above these resistance levels, it would send a concerning message to the consumer....at this time resistance is resistance.

See the original article >>

Goodbye Full-Time Jobs, Hello Part-Time Jobs, R.I.P. Middle Class

By Michael Snyder

A fundamental shift is taking place in the U.S. economy.  In fact, this transition is rapidly picking up momentum and is in danger of becoming an avalanche.  The percentage of full-time jobs in our economy is steadily declining and the percentage of part-time jobs is steadily increasing.  This is not a recent phenomenon, but now there are several factors which are accelerating this trend.  One of them is Obamacare.  The truth is that Obamacare actually gives business owners incentive to cut hours and turn full-time workers into part-time workers, and according to the Wall Street Journal and other prominent publications this is already happening all over the United States.  Perhaps this is part of the reasons why the U.S. economy actually lost 240,000 full-time jobs last month.

In a recent article entitled "Restaurant Shift: Sorry, Just Part-Time", the Wall Street Journal explained the choices that employers are faced with thanks to Obamacare...

The Affordable Care Act requires employers with 50 or more full-time equivalent workers to offer affordable insurance to employees working 30 or more hours a week or face fines. Some companies have said the requirement could increase their costs significantly, although others have played down the potential hit.

The cost for small firms to comply with the health law will depend largely on the number of additional full-time employees that sign up for employer-sponsored coverage. Average annual premiums for employer-sponsored health insurance in 2012 were $5,615 for single coverage and $15,745 for family coverage, according to the Kaiser Family Foundation. That is up from $3,083 and $8,003, respectively, in 2002.

Thankfully the implementation of this aspect of Obamacare was recently delayed, but a lot of employers are saying that it won't make a difference.  They know that it is coming at some point, and so they are already making the changes that they feel they will need to make in order to comply with the law...

Restaurant owners who have already begun shifting to part-time workers say they will continue that pattern.

"Does the delay change anything for us? Absolutely not," Mr. Adams of Subway said, explaining that whether his health-care costs go up next year or in 2015, he will have to comply with the law. "We won't start hiring full-time people."

This is very sad, because we have already been witnessing a steady erosion of "breadwinner jobs" in this country.

It is very, very difficult to support a family if you just have a part-time job or a temp job.  But those are the jobs that our economy is producing these days.

In fact, if you can believe it, the second largest employer in the United States is now a temp agency.  Kelly Services is actually the second largest employer in the country after Wal-Mart.

Isn't that crazy?

And full-time employment continues to lag far, far behind part-time employment.  The number of part-time workers in the United States recently hit a brand new all-time record high, but the number of full-time workers remains nearly 6 million below the old record that was set back in 2007.

For much more on this, please see my previous article entitled "15 Signs That The Quality Of Jobs In America Is Going Downhill Really Fast".

At this point, employees are increasingly considered to be expendable "liabilities" that can be dumped the moment that their usefulness is over.

For example, employees at one restaurant down in Florida were recently fired by text message...

It's bad enough losing your job, but more than a dozen angry employees say they were fired from a central Florida restaurant via text message.

Employees at Barducci's Italian Bistro said they lost their jobs without notice after the restaurant suddenly closed and are still waiting for their paychecks.

This shift that we are witnessing is fundamentally changing the relationship between employers and employees in the United States.  The balance of power has moved very much toward the employers.

Most employers realize that there is intense competition for most jobs these days.  If you get tired of your job, your employer can easily go out and find a whole bunch of other people who would be thrilled to fill it.

So why has the balance of power shifted so dramatically?

Well, for one thing we have allowed millions upon millions of good paying jobs to be shipped out of the country.  Now American workers literally have to compete for jobs with workers on the other side of the planet that live in nations where it is legal to pay slave labor wages.

This should have never happened, but voters in both major political parties kept voting for politicians that were doing this to us.

Now we all pay the price.

Another factor is the rapid advancement of technology.

These days, businesses are trying use machines, computers and robots to automate just about everything that they can.  The following example comes from a recent Business Insider article...

On a windy morning in California's Salinas Valley, a tractor pulled a wheeled, metal contraption over rows of budding iceberg lettuce plants. Engineers from Silicon Valley tinkered with the software on a laptop to ensure the machine was eliminating the right leafy buds.

The engineers were testing the Lettuce Bot, a machine that can "thin" a field of lettuce in the time it takes about 20 workers to do the job by hand.

The thinner is part of a new generation of machines that target the last frontier of agricultural mechanization — fruits and vegetables destined for the fresh market, not processing, which have thus far resisted mechanization because they're sensitive to bruising.

So what happens when the big corporations that dominate our economy are able to automate everything?

What will the rest of us do?

How will the middle class survive if they don't need us to work for them?

Over the past couple of centuries, we have witnessed several fundamental shifts in our economy.

Once upon a time, a very high percentage of Americans worked for themselves.  There were millions of farmers, ranchers, small store owners, etc.

But then the industrial revolution kicked in to high gear and big corporations started to gain more power.  Millions of Americans went to work for these big corporations, but it was okay because they paid us good wages to work in their factories and the middle class thrived.

Unfortunately, the big corporations have realized that things have changed and that they don't really need us anymore.  They can replace us with technology or with super cheap labor overseas.

So that leaves the rest of us in quite a quandry.  Very few of us own our own businesses.  In fact, the percentage of self-employed workers in the United States is at an all-time record low.  And the number of us that are needed by the monolithic corporations that dominate our system is dropping by the day.

All of this is very bad news for the middle class.  The only thing that most of us have to offer is our labor, and the value of our labor is continually declining.

Unless something dramatic happens, the future of the middle class looks very bleak.

See the original article >>

Goldman Sachs: Net Income Doubles

By tothetick

As the trial of Fabulous Fab gets under way in Manhattan, there is someone that will be hearing the clinking of champagne glasses as they celebrate the doubling in profits of the rogue ( well, we love a scapegoat in the story, even though we all know it can’t be true) trader’s former employer, Goldman Sachs.

Goldman Sachs has just announced that their net income increased in the second quarter this year and announced this morning that it hit $1.93 billion. Last year they had a net income of only $962 million at the same time. Net revenue was also announced as having increased by 30%, which means either a jump or a leap from $6.06 billion to $8.61 billion. It had been suggested by some analysts that quarterly revenue would only rise by 20.5% (which in itself was already high), reaching $7.98 billion. Over the past year there has been a 37% growth in revenue for the bank.

Goldman Sachs in the meantime decided to cut 300 jobs in the second quarter this year in a bid to reduce expenses. That's certainly called living up to your name. Goldman does sack. Compensation (including salaries, bonuses and deferred pay) increased by 10% to $8.04 billion from January to June. But, it is debatable obviously as to who might be getting the biggest chunk of all of that. Total revenue increased by 13% (reaching $18.7 billion). It all seems rather surprising that there are cuts in jobs and yet increases across the board in net revenue, revenue and net income for the investment bank. The present Chief Executive Officer and Chairman of the bank is Lloyd Blankfein, who has an estimated net worth of $450 million, with an annual salary that hits the $55-million mark. He is estimated to be one of the highest paid guys in the business and his bonuses reach levels of over $27 million.

Goldman Sachs: Lloyd Blankfein

Goldman Sachs: Lloyd Blankfein

So, the champagne should be flowing, right? Net income up, net revenue up. Both are better than estimates had predicted. But, it obviously doesn’t work like that, does it? The value of Goldman Sachs’ shares fell at 9:39 ET today by 0.07% (down $0.1100 to $162.89). Share value has ranged from $91.15 to $168.20 over the past 52 weeks for the investment bank.

So, why the fall?

There have been growing concerns that Goldman Sachs will not be in a position to meet the stringent capital standards that are imposed on the largest banks in the USA. Financial regulators have made it a requirement to increase capital leverage from a 3% to a 5% ratio (of assets). This may mean that there will be a reduction in dividend payouts in order to maintain the capital. The ratio is regardless of whether there is a risk or not in the company. However, it does seem that that might be to the detriment of the number of employees in the bank. Skimming off a few hundred employees might just mean that they will be able to pay something out. Although, by the reaction of Wall Street this morning, the investors are not quite so certain.

However, there are some that might also suggest that if the banks are having to amass large amounts of capital to reach that ratio percentage, then the only ones that are going to suffer are going to be the people that see their access to loans being reduced and limited while the banks get the cash. Market volatility would undermine credit availability and there would be ensuing worsening of the situation. Looks as if we are ready to go round in circles again. The authorities and the regulators impose stringent requirements to protect the people, the banks close the taps and pull the plugs and the objective that was meant to be avoided actually comes into being. They will have done exactly what they wanted to avoid doing. The borrowers, the people will be the ones that are affected, certainly not the shareholders and not the banks themselves.

The Federal Reserve and the Federal Deposit Insurance Corp., with increased pressure being put on them by policy makers and the legal system decided to go even further than Basel III requirements which stand at 3% for capital leverage ratios. This means that the requirements imposed on US banks are almost double those that are being required of other banks around the world.

The banks are currently trying to push the regulators to accept a different type of calculation of leverage (including fewer off-balance-sheet assets, as well as the exclusion of some items). Some have even suggested excluding Treasury holdings and money that is held at the Federal Reserve. That alone would vastly improve their ability to meet the new standards and at the same time provide the possibility of still paying out dividends.

In the meantime, the trial of Fabrice Tourre opened yesterday and brought Goldman Sachs into the spotlight once again. As the trial opened Tourre was said to be either a ‘liar’ or a ‘scapegoat’ by his defense lawyers. He was said to be far from ‘fabulous’ at all and just a childish trader that wrote teenage love-letters to his girlfriend telling of the portending doom. Look as if we are getting ready for a complete descent into hell, with the destruction of one man’s credibility and character along the way as usual.

I guess Fabrice Tourre should have remembered that story about the guy that dies and gets to choose whether he wants to go to heaven or hell. He spends a day in heaven where life is cool, but nonetheless rather staid and boring. Nothing actually happens. In hell, as the lift doors open, he is greeted by good-looking people and everybody is having a whale of a time. Parties, smiles, back-slapping, laughter. Obviously the place to be! He opts for hell, tells God and then goes there the next day. But, when the doors open this time, it’s a different scenario, fire-breathing sweltering heat and the devil pops up, far uglier than he was the day before. The guy that’s just died says, "this wasn’t like this yesterday". The devil replies, “no, but yesterday, we were recruiting. Today, you are staff!”

Fabrice Tourre should have known that the doors opened onto a hellish nightmare.

See the original article >>

Funding securities purchases with reserves

by SoberLook

We've received numerous e-mails regarding the comment (here) that the Fed (or any other central bank for that matter) finances securities purchases with reserves. It's unfortunate that the internet is full of misinformation, propagated by both bloggers and the mass media. The Fed's operations are not a mystery - it's just basic accounting. And the fundamentals of accounting tell us that if you increase your assets by purchasing something, your liabilities increase as well. The balance sheet "has to balance".
When the Fed buys a security, any of the following could be taking place:
1. The Fed sells another security in the same amount (such as in Operation Twist).
2. The Fed can lend that security via repo. In this situation the increase in assets (security purchase) corresponds to increase in liability (the Fed borrows cash against the bond).
3. The Fed can accept time deposits (now it owes money on the deposit - thus increases its liability).
4. The Fed can in effect use the proceeds from the repayment of various emergency facilities to cover the purchase. This was the case during part of QE1 (see discussion from 2009).
5. The Fed can increase bank reserves (by simply crediting the seller's reserve account). Remember that reserves are liabilities on the Fed's balance sheet.
These are all different ways the Fed can finance securities purchases. Only number 5 represents outright quantitative easing. Unless 1-4 are involved, reserves are used to fund balance sheet expansion.

There are some silly notions about what banks can and can not do with their reserve balances. Keep in mind that cash is fungible. A bank can buy securities or loans from another bank and get rid of its excess reserves - thus converting reserves into other assets. Of course then the seller bank will be stuck with these excess reserves. Only the Fed can change the total reserve balance in the banking system as a whole by buying and selling securities or by borrowing and lending money.

See the original article >>

Great Graphic: The McDonald's Empire

by Marc to Market

This Great Graphic was posted on the FT Beyond Brics blog and comes from Wikipedia.   It shows the countries in which McDonald's operates.   The occasion for the map is the company's announcement of plans to open a restaurant in Vietnam next year.  This will be its 199th country. 

By the end of this year, McDonald's projects it will have over 2,000 outlets in China, which would move the PRC into third place behind the US (18k+), and Japan (3.5k+).   France, the UK, Canada and Brazil each have between 1,200 and 1,500 McDonald's restaurants.  

The FT article notes that although it is rare, McDonald's has pulled out of a few countries, like Bolivia, Jamaica and Iceland.  And some of the locations, like in Cuba and Iraq, really serve the US military rather than the general public.  In those examples, the hamburger follows the flag, but there are a number of other hot spots where McDonald's is not tied to the military, such as Pakistan. 

See the original article >>

There’s a Madman at the Wheel… Someone Stop Him Before We Crash

by Graham Summers

Stocks are rallying because Ben Bernanke speaks at Congress on Wednesday. Stocks historically rally into Bernanke speeches.

The markets are at new all time highs. But it is now clear that Bernanke has absolutely no clue what he’s doing.

Just two months ago, Bernanke hinted at tapering QE. Note, he didn’t actually taper anything he just hinted at it.

This talk of tightening lasted all of two months. And remember, throughout this period of hinted the Fed was spending $85 BILLION per month via QE 3 and QE 4.

Imagine if you were in the car with a driver who was going 85 MPH down a road with a speed limit of 35 MPH (this isn’t a bad metaphor as there is absolutely no evidence that QE creates jobs or GDP growth so there is no reason for the Fed to be doing it in the first place).

The guy is obviously out of control. The dangers of driving this fast are myriad (crashing, running someone over, etc.) while the benefits (you might get where you want to go a little faster assuming you don’t crash) are minimal.

Now imagine that the driver turned to you and said, “I’m thinking about slowing down.” Seems like a great idea doesn’t it? But then a mere two minutes later he says “ we need to continue at 85 MPH for the foreseeable future.”

At this point any sane person would scream, “STOP.” The driver is clearly a madman and shouldn’t be let anywhere near the driver’s seat. Moreover, he’s totally lost all credibility and isn’t to be trusted.

That’s our Fed Chairman.

As I’ve noted before… QE, which doesn’t create jobs or GDP growth, does create inflation. The cost of everything is soaring in the US. Since 2002, the cost of just about every item you buy at the grocery store is up in a big way. Check out this list compiled at The Blaze:

  • Eggs: 73%
  • Coffee: 90%
  • Peanut Butter: 40%
  • Milk: 26%
  • A Loaf Of White Bread: 39%
  • Spaghetti And Macaroni: 44%
  • Orange Juice: 46%
  • Red Delicious Apples: 43%
  • Beer: 25%
  • Wine: 60%
  • Electricity: 42%
  • Margarine: 143%
  • Tomatoes: 22%
  • Turkey: 56%
  • Ground Beef: 61%
  • Chocolate Chip Cookies: 39%

The damage doesn’t stop there. The cost of everything from healthcare to college tuition is soaring. Heck, even the new Twinkies are smaller, but cost the same (a “hidden” price increase).

Make no mistake, inflation is entering the US financial system in a big way.

Inflation is good for stocks at the beginning. But then it eats into profits very quickly. At that time, things get really ugly for the markets.

Speaking of which… corporate profits are falling sharply, as is GDP, while stocks continue to rally hard.

Sounds a bit like 2007-2008 doesn’t it?

Stocks may hit new highs, but this rally has all the hallmarks of a blow off top, coming at the final stage of a bubble. Indeed, stocks have not been this overextended in over 20 years… that includes the 2007 peak. Soon after we reached that point… we then plunged into one of the worst market Crashes of all time.

By today’s metrics, this would mean the S&P 500 falling to 1,300 then eventually plummeting to new lows.

This is not doom and gloom. This is a fact. The Fed has created an even bigger bubble than the 2007 one.

See the original article >>

Treasuries touch one-week low on bets Bernanke damps taper talk

By Susanne Walker

Federal Reserve Chairman Ben Bernanke (Source: Bloomberg)Federal Reserve Chairman Ben Bernanke (Source: Bloomberg)

Treasury 10-year note (CBOT:ZNU13) yields touched a more than one-week low amid speculation Federal Reserve Chairman Ben S. Bernanke will seek to damp investor expectations of a reduction in stimulus when he speaks to Congress tomorrow.

Treasuries erased an earlier gain after the cost of living in the U.S. rose in June by the most in four months as gasoline prices increased. Pacific Investment Management Co.’s Bill Gross added to holdings of U.S. government debt in his flagship fund in June while betting incorrectly on gains in inflation-indexed securities in the first half of 2013.

“The market is anticipating a dovish, defensive presentation -- and if it doesn’t get enough of that, they may see it as hawkish,” Larry Milstein, managing director in New York of government-debt trading at R.W. Pressprich & Co., said of Bernanke’s two days of testimony in Washington. “Inflation is a non-issue and last week he seemed to be more concerned about deflation than inflation. He’s going to lean to the dovish side. The market is already pricing that in.”

The benchmark 10-year yield was little changed at 2.54% as of 10:03 a.m. New York time, according to Bloomberg Bond Trader data. It reached 2.51%, lowest since July 5. The price of the 1.75% security maturing in May 2023 traded at 93 5/32.

TIPS Returns

As of yesterday, investors in U.S. government securities linked to consumer-price gains have lost 7.7% this year, headed for the first annual decline since 2008, Bank of America Merrill Lynch index figures showed. Conventional Treasuries fell 2.7% over the same period.

The difference in yield between 10-year notes and similar- maturity Treasury Inflation Protected Securities, a measure of trader expectations for inflation over the life of the debt called the break-even rate, was at 2.09 percentage points, set for the highest close since June 11. That compares with an average of 2.37 percentage points in the past year.

The Fed’s price indicator for the period from 2018 to 2023, known as the five-year five-year forward break-even rate, fell to a two-week low of 2.41% as of July 11.

The consumer-price index increased 0.5% after a 0.1% gain the prior month, a Labor Department report showed today in Washington. The median forecast in a Bloomberg survey called for a 0.3% rise. Overall consumer prices increased 1.8% in the 12 months ended in June, more than projected and after a 1.4% year-over-year gain the prior month. The core measure, which excludes food and fuel, climbed 0.2% from May.

Highly Accommodative’

The report “looks fairly strong -- it bodes well for the inflation side of the story,” said Aaron Kohli, an interest- rate strategist in New York at BNP Paribas SA, one of 21 primary dealers obligated to trade with the Federal Reserve. “Break- evens are a good buy at this point.”

Bernanke said on July 10 that the U.S. needs “highly accommodative monetary policy for the foreseeable future,” after last month saying the central bank may begin to slow its $85 billion in monthly bond purchases this year and end them in 2014 if economic growth meets policy makers’ goals.

Industrial production rose in June by the most in four months, with output at factories, mines and utilities climbing 0.3% after being little changed in May, a Fed report showed today in Washington. The gain matched the median forecast of 86 economists surveyed by Bloomberg. Manufacturing, which makes up 75% of total output, increased more than projected.

The U.S. central bank is scheduled to buy as much as $1.75 billion of government securities due from February 2036 to May 2043, according to the New York Fed’s website.

Foreign Holdings

Foreign sales of U.S. long-term securities rose in May as private investors overseas sold a record amount of Treasuries, a government report showed.

The net long-term portfolio investment outflow for the month was $27.2 billion after a revised decline of $21.8 billion the prior month, the Treasury Department said in a statement today in Washington. U.S. residents bought a net $27.2 billion in foreign long-term securities, while investors abroad were net sellers of $29 billion of Treasury bonds and notes, the report showed.

China’s holdings of Treasuries rose $25.2 billion to a record $1.316 trillion, according to the Treasury. Japan, the second-largest holder, lowered its holdings to $1.11 trillion.

Pimco’s Views

Pimco’s Gross raised the proportion of U.S. government debt in the $268 billion Total Return Fund to 38% from 37% in May, according to data on the company’s website. Newport Beach, California-based Pimco doesn’t comment directly on monthly changes in holdings or specific types of securities within a market sector such as the percentage of Treasury Inflation Protected Securities in the U.S. grouping.

Gross had been buying TIPS on a bet that money printing by the world’s central banks would push up consumer prices, making Treasuries the largest portion of the fund. When yields began to rise in May on expectations the Fed would slow its bond-buying program, inflation expectations didn’t, amplifying the losses on inflation-hedged U.S. debt.

The Total Return Fund, the world’s largest mutual fund, fell 4.7% in May and June, prompting $9.9 billion in withdrawals last month, the most on record.

The Treasury is contacting primary dealers as it seeks ways to support the TIPS market. The advice is being sought after direct bidders, non-primary-dealer investors that place their bids directly with the Treasury, bought 0.4% of debt offered in a sale of 30-year TIPS in June. That was the least since 2010, versus 14% in February and an average of 17.7% at the past nine auctions.

See the original article >>

Hardening Brazil’s Soft Power

by Celso Amorim

BRASILIA – It is, perhaps, a truism for Brazil’s citizens that their country is and always will be a peaceful one. After all, Brazil has lived with its ten neighbors without conflict for almost 150 years, having settled its borders through negotiation. It last went to war in 1942, after direct aggression by Nazi U-boats in the South Atlantic. It has forsworn nuclear weapons, having signed a comprehensive nuclear-safeguards agreement with Argentina and the International Atomic Energy Agency. Through the Common Market of the South (Mercosur) and the Union of South American Nations (Unasur), Brazil is helping to integrate the region politically, economically, socially, and culturally.

This illustration is by Paul Lachine and comes from <a href="http://www.newsart.com">NewsArt.com</a>, and is the property of the NewsArt organization and of its artist. Reproducing this image is a violation of copyright law.

Illustration by Paul Lachine

But is soft power enough for one of the world’s major emerging countries?

To be sure, Brazil’s peaceful foreign policy has served it well. Brazil has used its stature to advance peace and cooperation in South America and beyond. Its constructive stance derives from a worldview that accords pride of place to the values of democracy, social justice, economic development, and environmental protection.

Brazil’s unique approach to promoting these ideals is an important source of its soft power, reflected in the broad international support that placed Brazilians atop international institutions like the Food and Agriculture Organization and the World Trade Organization.

Yet no country can rely on soft power alone to defend its interests. Indeed, in an unpredictable world, where old threats are compounded by new challenges, policymakers cannot disregard hard power. By deterring threats to national sovereignty, military power supports peace; and, in Brazil’s case, it underpins our country’s constructive role in the pursuit of global stability.

That role is more necessary than ever. Over the past two decades, unilateral actions in disregard of the UN Security Council’s primary responsibility in matters of war and peace have led to greater uncertainty and instability. Likewise, little progress toward nuclear disarmament has been made, in disregard of the Nuclear Non-Proliferation Treaty.

Brazil’s abundance of energy, food, water, and biodiversity increases its stake in a security environment characterized by rising competition for access to, or control of, natural resources. In order to meet the challenges of this complex reality, Brazil’s peaceful foreign policy must be supported by a robust defense policy.

Brazil’s National Defense Strategy, updated in 2012, states that the modernization of the Armed Forces is intrinsically linked to national development. Thus, it emphasizes the need to strengthen the domestic defense industry. In accordance with the Strategy, Brazil is enhancing its conventional deterrence capabilities, including by building a nuclear-propelled submarine as part of a naval program commensurate with its responsibilities in the South Atlantic.

Brazil coordinates closely on defense matters with its neighbors, both bilaterally and through Unasur’s South American Defense Council, which aims to promote confidence-building, transparency, a joint regional defense industry, and, most important, a common defense identity. One potential mechanism for advancing these objectives is a South American Defense College, now under consideration.

South America is becoming a region where war is unthinkable – what the political scientist Karl Deutsch once called a “security community.” Having visited every South American country in my tenure as Defense Minister, I am convinced that, the most effective deterrent on the continent is cooperation.

At the same time, Brazil is pursuing increased bilateral defense cooperation with African partners. With our neighbors on both shores of the South Atlantic, Brazil is working closely to strengthen the Zone of Peace and Cooperation of the South Atlantic (ZPCSA), which aims to keep the ocean free from rivalries foreign to it and from nuclear weapons.

Brazil is also reaching out to other emerging countries, such as its fellow BRICS (Brazil, Russia, India, China, and South Africa) and members of the IBSA Dialogue Forum (India, Brazil, and South Africa). For example, Brazil conducts IBSAMAR, a regular trilateral naval exercise, with South Africa and India. More broadly, we are exploring ways to cooperate in the joint development of defense technologies.

Through such endeavors, Brazil hopes to contribute to a more balanced international order, one less subject to hegemonies of any kind, without losing sight of the importance of mutually beneficial partnerships with developed countries.

Even as Brazil hardens its soft power, it remains deeply committed to the path of dialogue, conflict prevention, and the negotiated settlement of disputes. The presence of Brazilian peacekeepers in countries like Haiti and Lebanon underscores Brazil’s contribution to maintaining peace and security worldwide. In the twenty-first century, a truly stable global order will depend on a legitimate and effective UN Security Council, one that reflects the plurality of the emerging multipolar world.

See the original article >>

Transatlantic Trade Goes Global

by Michael J. Boskin

STANFORD – Negotiations have now commenced between the United States and the European Union on the Transatlantic Trade and Investment Partnership (TTIP), potentially the largest regional free-trade agreement in history. If successful, it would cover more than 40% of global GDP and account for large shares of world trade and foreign direct investment. The US and EU have set an ambitious goal of completing negotiations by the end of 2014. Historically, however, most trade agreements have taken much longer to complete.

This illustration is by Dean Rohrer and comes from <a href="http://www.newsart.com">NewsArt.com</a>, and is the property of the NewsArt organization and of its artist. Reproducing this image is a violation of copyright law.

Illustration by Dean Rohrer

The scale of the TTIP is enormous. With Croatia’s accession at the beginning of July, the EU now consists of 28 member states, each of which has its own particular set of special interests pressing for trade promotion or protection, based on comparative advantage, history, and raw domestic political power.

Moreover, the desired scope of the agreement is vast, complicating the process further. The TTIP would eliminate all trade tariffs and reduce non-tariff barriers, including in agriculture; expand market access in services trade; bring about closer regulatory harmonization; strengthen intellectual-property protection; restrict subsidies to state-owned enterprises; and more. This all but guarantees difficult talks ahead; indeed, France has already demanded and received a “cultural exception” for film and TV.

Expanding trade boosts income, on average, in all the countries involved. Economists estimate that global free trade, enabled by many successful rounds of multilateral talks (most recently the Uruguay Round, culminating in the establishment of the World Trade Organization), has boosted worldwide income substantially.

Regional free-trade agreements (FTAs), such as the TTIP, do so as well, but some of the gains may come at the expense of other trade partners. Within each country, despite net gains, there are also some losers. The best way to deal with the economic, political, and humanitarian concerns raised by trade agreements is via transition rules, temporary income support, and retraining, as opposed to maintaining protectionist barriers.

The gains from such pacts stem from a variety of factors, the most important of which is comparative advantage: countries specialize in producing the goods and services that they are relatively most efficient at producing, and trade these goods and services for others. Economies of scale and other factors are also important.

As the scope of trade liberalization shrinks, so do the benefits – more than proportionally.  Estimates of the annual gains from a fully realized TTIP are $160 billion for the EU and $128 billion for the US. British Prime Minister David Cameron predicts two million new jobs. And a non-inflationary boost to growth in a weak global economy would be particularly timely.

But the devil is in the details. Tariffs are generally modest already, so gains from their further reduction would be modest as well. It is vital to remove non-tariff barriers, such as localized rules and restrictions not based on scientifically legitimate safety or health concerns, despite political pressure to maintain or tighten them. Limiting the scope of trade and investment covered by the TTIP would likewise reduce the benefits.

Trade negotiations become either broad and deep or narrow and limited. NAFTA, for example, followed the former route, greatly boosting trade among the US, Canada, and Mexico. Its copycat, SAFTA (the South Asian Free Trade Agreement), moved slowly to reduce tariffs and the list of excluded items, so India signed separate bilateral FTAs with Bangladesh and Sri Lanka.

The TTIP is being divided into 15 specific working groups. While the negotiations are new, the issues separating the two sides are long-standing and widely known. One of the most difficult is the EU’s limitation of imports of genetically modified foods, which presents a major problem for US agriculture. Another is financial regulation, with US banks preferring EU rules to the more stringent framework emerging at home (such as the much higher capital standards for large banks recently proposed by America’s financial regulators).

Several other serious disagreements also stand in the way of a comprehensive deal. For example, US pharmaceutical companies have stronger intellectual-property protection at home than in the EU. Entertainment will become increasingly contentious with online distribution of films. And the anachronistic 1920 Jones Act requires cargo carried between US ports to be shipped only on American ships (recall the confusion about the possibility of foreign ships coming to help during the BP Gulf oil spill). Safety regulations and restrictions on foreign control of companies in sensitive industries are further points of contention.

The TTIP is not just about the US and the EU. Mexico already has an FTA with the EU, and Canada is negotiating one. At some point, NAFTA and TTIP will need to be harmonized.

Meanwhile, the world’s other countries – still accounting for more than half of world GDP and the bulk of global trade and FDI – are wondering how the TTIP would affect each of them. One possibility, suggested by my ex-colleague, former US Trade Representative Carla Hills, is that a successful TTIP would be a major impetus for rekindling the moribund Doha Round of global free-trade talks. The Uruguay Round received a similar boost soon after NAFTA was signed.

Everyone everywhere has an interest in how the TTIP talks develop and in what ultimately results from them. To take a simple example, more reasonable EU rules on genetically modified agricultural imports from North America, if translated with appropriately careful monitoring to Africa, could be a tremendous boon to African agriculture. Failure to make any inroads on this score in the TTIP negotiations would almost certainly block genetically modified food in Africa.

Analogous issues arise in sector after sector, and in one regulation after another. We can hope, but in no way guarantee, that the details agreed at the end of the TTIP negotiations justify the enthusiasm at their start.

See the original article >>

Follow Us