by Doug Short and Steven Hansen
The June 2013 Consumer Price Index (CPI-U) year-over-year inflation rate again rose moderately from 1.4% to 1.7% . Core inflation (CPI less food and energy) declined from 1.7% to 1.6%.
The dynamics were that energy costs were the big driver this month with minor supporting roles from food, apparel, and medical. All others were mixed.
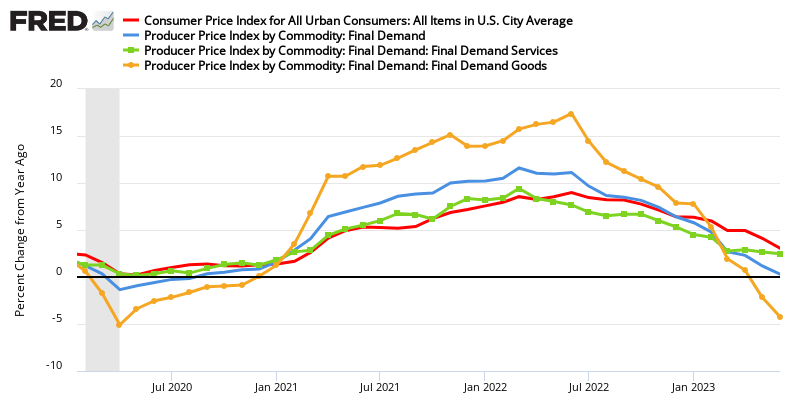
The Producer Price Index (released last week) showed finished goods jumped from 1.7% in May to 2.5% in June 2013. It is seldom that the CPI is lower than the PPI.
Percent Change Year-over-Year – Comparing PPI Finished Goods (blue line) to PPI Crude Materials (red line)
As a generalization – inflation accelerates as the economy heats up, while inflation rate falling could be an indicator that the economy is cooling. However, inflation does not correlate well to the economy – and cannot be used as a economic indicator.
Energy by far was the major influence on this month’s CPI.
The Consumer Price Index for All Urban Consumers (CPI-U) increased 0.5 percent in June on a seasonally adjusted basis, the U.S. Bureau of Labor Statistics reported today. Over the last 12 months, the all items index increased 1.8 percent before seasonal adjustment.
The gasoline index rose sharply in June and accounted for about two thirds of the seasonally adjusted all items change. Other energy indexes were mixed, with the electricity index rising, but the indexes for natural gas and fuel oil declining. The food index increased in June as the index for food at home turned up after declining in May.
The index for all items less food and energy increased 0.2 percent in June, the same increase as in May. Advances in the indexes for shelter, medical care, and apparel accounted for most of the rise, with increases in the indexes for new vehicles and household furnishings and operations also contributing. The indexes for airline fares, used cars and trucks, and recreation all declined in June.
The all items index increased 1.8 percent over the last 12 months, an increase from last month’s 1.4 percent figure. The index for all items less food and energy has risen 1.6 percent over the last year, the smallest 12-month change since June 2011.
Historically, the CPI-U general index tends to correlate over time with the CPI-U’s food index. The current situation is putting an upward pressure on the CPI countering the downward pressure on the CPI by the Producer Price Index.
CPI-U Index compared to the Food sub-Index of CPI-U

Notice the gap in the above graphic between the CPI and Food – historically this gap has always closed when the knock-on effect from higher food prices into other CPI components moderates.
The market expected month-over-month CPI-U growth at 0.3% (versus 0.5% actual), with the core inflation expectations at 0.2% (versus 0.2% actual).
The Federal Reserve has argued that energy inflation automatically slows the economy without having to intervene with its monetary policy tools. This is the primary reason the Fed wants to exclude energy from analysis of consumer price increases (the inflation rate).

/images/z cpi1.png
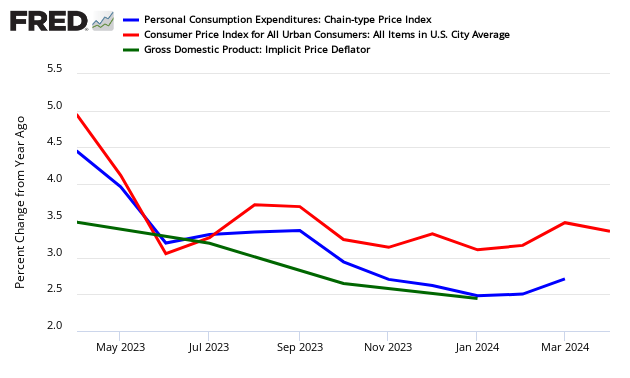
In the above chart – the green boxes are elements moderating inflation, while the red boxed items are fueling inflation. And the graph below looks at the different price changes seen by the BEA in this PCE release versus the BEA’s GDP and BLS’s Consumer Price Index (CPI).
Year-over-Year Change – PCE’s Price Index (blue line) versus CPI-U (red line) versus GDP Deflator (green line)
Detailed Analysis
The first chart is an overlay of Headline CPI and Core CPI (the latter excludes Food and Energy) since 1957. The second chart gives a close-up of the two since 2000.

On the chart below I’ve highlighted 2 to 2.5 percent range. Two percent has generally been understood to be the Fed’s target for core inflation. However, the December 12 FOMC meeting raised the inflation ceiling to 2.5% for the next year or two while their accommodative measures (low Fed Funds Rate and quantitative easing) are in place.

Federal Reserve policy, which has historically focused on core inflation, and especially the core Personal Consumption Expenditures (PCE), will see that the latest core CPI is below the near-term target range of 2 to 2.5 percent, and the more volatile headline inflation, is well below the target range
Caveats on the Use of the Consumer Price Index
Econintersect has performed several tests on this series and finds it fairly representative of price changes (inflation). However, the headline rate is an average – and will not correspond to the price changes seen by any specific person or on a particular subject.
Although the CPI represents the costs of some mythical person. Each of us need to provide a multiplier to the BLS numbers to make this index representative of our individual situation. This mythical person envisioned spending pattern would be approximately:

The average Joe Sixpack budgets to spend his entire paycheck or retirement income – so even small changes have a large impact to a budget.

The graph above demonstrates that fuel costs, medical care, and school costs are increasing at a much faster pace than the headline CPI-U.
The Consumer Price Index for Urban Consumers (CPI-U, or more generally CPI) is the most familiar gauge of inflation in the US. The data for the non-seasonally adjusted series stretches back a century to January 1913. But the news of late is about a relative newcomer to the inflation metrics of the Bureau of Labor Statistics (BLS), the Chained CPI for Urban Consumers (C-CPI-U). The BLS has a Frequently Asked Questions page on the Chained CPI that’s been around for a while. At present the page footer says “Last Modified Date: April 6, 2005″.
The reason the Chained CPI has been a hot topic in the news is that it’s being proposed as the method for determining cost of living adjustments for Social Security. Here are some typical examples of topic in the popular press:
- Chained CPI and You: A Primer (Atlantic Wire)
- Why ‘Chained CPI’ Rattles the Elderly (and Soon to Be) (Businessweek)
- How ‘Chained CPI’ Will Hit Your Pocketbook (Daily Finance)
- What’s the Chained CPI? (AARP)
- Seniors would see smaller Social Security checks under Obama budget (CNN Money)
For a snapshot comparison of how the conventional CPI and Chained CPI stack up against each other, I’ve created a variation on the CPI chart I’ve been updating monthly for the past several years here. The chart illustrates the overall change in inflation for CPI, Core CPI, and the eight top-level components of CPI since the turn of the century (more here). I also include energy, which is a collection of subcomponents, and College Tuition and Fees, a subcomponent of one of the top eight.
The BLS has published the data for these metrics for chained CPI from December 1999. The one missing element is College Tuition and Fees, a subcomponent of Education and Communication. The chart below pairs the two versions of each component showing the total change since December 1999. We can thus have a more educated sense of how the Chained CPI and conventional CPI differ from one another.

Here is a bottom line comparison: Since December of 1999, the average year-over-year inflation calculated monthly based on the conventional CPI has been 2.41%. For equivalent calculation for the Chained CPI it is 2.15%, a difference of 0.26%.
The calculation for the Social Security COLA, however, is based on a different CPI series, the Consumer Price Index for Urban Wage Earners and Clerical Workers, usually referred to as the CPI-W. Since December of 2000, the year-over-year average for CPI-W is fractionally higher than YoY CPI at 2.45%, which is 0.30% higher than the YoY average for Chained CPI.
Here is a snapshot that compares the cumulative effect of inflation with these three indexes:

Over time the proposed switch to the Chained CPI for Social Security COLAs will substantially lower the cost to government … and the size of payouts to recipients.
The Consumer Price Index contains hundreds of sub-indices which should be used to show price changes for a particular subject.
Because of the nuances in determining the month-over-month index values, the year-over-year or annual change in the Consumer Price Index is preferred for comparisons.
No comments:
Post a Comment