Tuesday, March 8, 2011

Your diversification strategy is working correctly?

The diversification is a management technique that mixes a wide variety of investments within a portfolio. The main benefit of adding managed futures to a balanced portfolio is the potential to decrease portfolio volatility. Risk reduction is possible because managed futures can trade across a wide range of global markets that have virtually no long-term correlation to most traditional asset classes. Moreover, managed futures funds generally perform well during adverse economic or market conditions for stocks and bonds, thereby providing excellent
downside protection in most portfolios.
Diversification
The diversification between assets
The diversification between assets that have low correlation between them improves the overall performance of our investments for the same risk, thus reducing our exposure to risk decreases as the so-called "specified risk" linked to a single class of financial products. Basically, if you only held the shares, the result of your trading / investment is overly tied to the fortunes of a particular financial instrument for which you are running too high a risk. A well-diversified portfolio asset class is one of the major components that create the optimal portfolio. Read "The Art Of Asset Allocation" and "Top 10 Rules Of Portfolio Diversification".
The diversification within an asset
Concentrating investments in individual products or securities, you are exposed to a type of risk that can not be controlled, and the risk becomes uncertainty, which is something that is incalculable. is possible, even in this case, reduce the specific risks by trading or investing, for example, not a single product but a basket of products that represents a very large share of the market. Read "The Art Of Asset Allocation" and "Top 10 Rules Of Portfolio Diversification".
The diversification of trading methods
It combines the use of different methods of trading not correlated to improve the relationship between profit and maximum loss. The low correlation between different methods tends to reduce overall losses due to the combined performance of two or more trading systems. It is therefore one of the most effective ways to improve the performance of our investments while reducing risk. Read "The Art Of Asset Allocation" and "Top 10 Rules Of Portfolio Diversification".
The diversification of the trading system parameters
Is to use, within the same trading system, of different sets of parameters. Assuming that a trading account manage an adequate capital for diversification, it is better to diversify sets of parameters rather than making multiple contracts with the same set of parameters. The diversification of the set of parameters helps to minimize risk and strengthen our ability to remain disciplined and consistent psychological application of the trading system. Read "The Art Of Asset Allocation" and "Top 10 Rules Of Portfolio Diversification"
TOGETHER TO WIN: GALAXY PORTFOLIO SYSTEMS
Our goal is to generates significant medium term capital growth independent of stock and bond markets with simple and strict risk trading rules with maximum possible diversification. All our Portfolio Systems are designed assembled and managed with this philosophy. Due to the high diversification that characterizes them, our Portfolio Systems enhance the positive synergies of individual Trading Systems which are composed and dramatically reduce the overall risk. Diversification remains the cornerstone of modern portfolio theory.  Yet, during the financial crisis many "diversifying” investments readily followed the direction of the equity markets as they collapsed in 2008 and 2009. By contrast, our Portfolio Systems have just obtained their best resultsin 2008 thanks to the volatility of the period, the high diversification and the construction model that makes them independent of market equity and bond.
The table and chart below represents the MTM monthly results of our Galaxy Combined Portfolio Systems since November 2009 with $ 200K initial capital. Galaxy is composed of our trading systems Survivor, Ninja and Super Commodity.   
Performance statistics our Galaxy Portfolio Systems
           Net results Year 2009                  107,47 %
           Net results Year 2010                    68,45 %
           Last 12 Month return                     80,38 %
           Month with positive return              84,00 %
           Month with negative return             16,00 %
           Best monthly performance               27,21 %
           Worst monthly performance              9,51 %

Monthly MTM Performance of Galaxy Combined Portfolio System with $ 200K initial capital

  Jan
  Feb
Mar
Apr 
May
Jun 
Jul  
Aug
Sep
Oct 
Nov 
Dec 
2009


1.19 %
2.90 %
2010
(4.28 %)
24.49 %
2.99 %
1.76 %
15.62 %
4.35 %
10.60 %
(0.41 %)
(4.73 %)
1.75 %
12.80 %
1.50 %
2011
7.54 %
7.73 %


Combined Portfolio Banner Mini3                                             images

Material in this post does not constitute investment advice or a recommendation and do not constitute solicitation to public savings. Operate with any financial instrument is safe, even higher if working on derivatives. Be sure to operate only with capital that you can lose. Past performance of the methods described on this blog do not constitute any guarantee for future earnings. The reader should be held responsible for the risks of their investments and for making use of the information contained in the pages of this blog. Trading Weeks should not be considered in any way responsible for any financial losses suffered by the user of the information contained on this blog.

Survivor Trading System - Trades of 4 And 7 March

I trades di Survivor System del 4 e 7 Marzo. I risultati storici di Survivor System small version sono disponibili ai seguenti link: http://www.box.net/shared/static/giq7mp90fq.xls, http://www.box.net/shared/6koqmtmnsb I risultati storici e MTM di alcuni altri nostri trading systems e portfolio systems sono a disposizione al seguente link: http://www.box.net/shared/5vajnzc4cp

Trades of Survivor System on 4 and 7 March. Historical results of Survivor System small version are available at the following links: http://www.box.net/shared/static/giq7mp90fq.xls,, http://www.box.net/shared/6koqmtmnsb. Historical and MTM results of our some other trading systems and portfolio systems are available at the following link: http://www.box.net/shared/5vajnzc4cp


ES NQ TF EMD
CL NG HO RB


Material in this post does not constitute investment advice or a recommendation and do not constitute solicitation to public savings. Operate with any financial instrument is safe, even higher if working on derivatives. Be sure to operate only with capital that you can lose. Past performance of the methods described on this blog do not constitute any guarantee for future earnings. The reader should be held responsible for the risks of their investments and for making use of the information contained in the pages of this blog. Trading Weeks should not be considered in any way responsible for any financial losses suffered by the user of the information contained on this blog.

Sell Goldman and Buy ICE


With Goldman Sachs lagging and ICE rising on the back of the NYSE merger talks, more experienced investors can profit with carefully planned and executed pairs trade.

Those investing in sector ETFs are sometimes disappointed when a few of the individual companies in the sector double but the ETF moves up just 20%-30%. Of course, what they often do not think about is that some other members of the sector may be down 5%-10%, and if they were unfortunate and picked one of these stocks, they would likely be even more frustrated. This is the beauty of a sector ETF because it can provide broader diversification within a sector.

As I have discussed in past articles, I also use relative performance, or RS analysis, to try to identify the strongest and weakest stocks in a given sector. When the market is in a corrective, or consolidation phase, a pairs trade is often advisable. This is where you sell a weak stock in a sector while simultaneously buying one that is stronger. Currently, this looks like a perfect strategy for Goldman Sachs Group (GS) and IntercontinentalExchange (ICE).
chart
Click to Enlarge

Chart Analysis: Goldman Sachs Group (GS) traded as high as $193.60 in October 2009 and dropped below $130 last summer. The stock, like most of the diversified financial sector, has underperformed the overall market over the past six months.
  • The daily chart appears to have completed a head-and-shoulders (H&S) top formation as the major downtrend, line a, was tested on the recent rally. The key neckline support (line b) was broken last week at point 1
  • The next support is in the $152.50-$154 area, which corresponds to the uptrend, line c, and the 50% retracement support level
  • The downside target from the H&S top is in the $148 area, which corresponds nicely with the 61.8% retracement support at $147
  • There is first resistance at $163.50-$165 with more important resistance at the right shoulder in the $170 area. A move back above this level would turn the chart around
  • The weekly on-balance volume (OBV – not shown) was unimpressive on the recent rally and the daily OBV has dropped below its weighted moving average (WMA)
IntercontinentalExchange (ICE) as been a stock in play ever since the merger announcement regarding the NYSE hit the tape. ICE is now trying to close above the major weekly trend line resistance, line d, at $134.20.
  • The 61.8% retracement resistance from the December 2007 highs at $194.92 is now at $140 with chart resistance from 2008 at $163-$166
  • A completion of the trading range, lines d and f, has targets in the $170 area
  • There is initial support now at $126-$130 with the near-term uptrend (line e) in the $121 area. Major support is at $115
  • The weekly OBV moved through resistance, line g, in December, and the OBV has been leading prices higher. The daily OBV (not shown) has also turned up very sharply, which is quite positive
What It Means: Though the stock market may be ready to consolidate its recent gains, the relative performance, or RS analysis (not shown) indicates that GS will be weaker that the S&P 500 while ICE should be stronger than the overall market.

How to Profit: Given that ICE is just breaking out to the upside, new outright long positions have an uncomfortably high level of risk since the best place for a stop would be under $120. However, given the very weak chart of GS, a pairs strategy looks appropriate for those who are comfortable selling stocks short.

The strategy works as follows: For every 1.2 shares of ICE that are purchased, one share of GS should be simultaneously sold short. For example, if you bought 120 shares of ICE, then you would sell short 100 shares of GS at the same time. I would close out this position if GS closes above $170 or if it declines below $149.20. This is clearly a recommendation intended only for experienced traders and/or investors.

See the original article >>

NFIB Small Business Optimism Index: Hello Higher Prices

by Bespoke Investment Group

Today's release of the NFIB Small Business Survey showed that overall optimism rose to 94.5, which is the highest reading since December 2007 (94.6).  It has taken a long time, but after more than a year and a half of economic recovery, small business owners are now as optimistic as they were when the economy started to top out.


This month's survey also showed that business owners are becoming more confident that they can raise prices and that those price hikes will stick.  The index of prices relative to three months ago turned positive for the first time since October 2008.  While this may not be a welcome sign for consumers or the inflation outlook, small business owners are more than happy to have some pricing power.


Platinum and Palladium: The New Normal?

By Julian Murdoch

In just over one year, the ETF Securities Platinum Trust (PPLT) and Palladium Trust (PALL) have swelled to $832.65 million and $932.66 million in assets under management, respectively. Is acceleration just a spillover effect from gold's stratospheric rise? Or is something else fundamentally driving these metals higher?

Factors Driving Today's Prices

On Friday, platinum closed at $1,841/oz, up 4 percent since the beginning of the year. Meanwhile, palladium, 2010's big winner, is up only 1.28 percent year-to-date, closing at $810/oz. While these year-to-date returns may seem lackluster, there are reasons to believe higher prices may be soon on the way:
White Metals: 3/4/10 - 3/4/11
Both metals have seen prices like these before. Back in 2008, platinum rose to almost $2,200/oz right before the crash. For palladium, you have to look back a bit further; in 2001, the metal briefly scaled the $1,000/oz mark, before quickly falling back under $400/oz.

But the impetus for today's price increases can be traced back to the after-effects of the 2008 crash. Demand for both metals dropped after the crash, and mining companies rushed to contract supply.

In platinum, 2009 demand contracted sharply, much more quickly than supply — which led to a market oversupply in 2010. Still, demand rebounded in 2010, which absorbed much of that oversupply, thus tempering any further price increase for the metal:

[Click all to enlarge]
Platinum Supply/Demand/Net Balance; Past 10 Years
Source: ETF Securities Platinum and Palladium - 2011 Outlook and Fundamentals

Without that oversupply created in 2009, platinum prices would have risen much higher last year — a scenario that played out in palladium:
Palladium Supply/Demand/Net Balance - Past 10 Years
Source: ETF Securities Platinum and Palladium - 2011 Outlook and Fundamentals

Palladium supply contracted by over 10 percent in 2008, and dropped another 4 to 5 percent in 2009. Demand also contracted, but not as sharply as supply. Thus, when demand for palladium rebounded sharply in 2010, it quickly outpaced supply, and prices rose accordingly.

Supply Constraints

Supply of both metals comes primarily from mining output in South Africa and Russia, with South Africa producing roughly 76 percent of all platinum and 35 percent of all palladium. Russia, meanwhile, supplies only 13 percent of platinum, but is the world's major palladium producer, supplying 52 percent of the metal. Mining supply of both of these metals has been constrained for a variety of reasons.

In South Africa, one of the main problems has been power — or the lack thereof. There just hasn't been enough steady electricity to meet mining industry needs. A new power policy is expected to be in place in South Africa by April, but it will still be a number of years before new capacity comes online. Eskom executive Kannan Lakmeeharan said that the supply-demand margin for power in South Africa will remain slim for the next five to six years, with the next two years being particularly tight. Not good news for mining production in the short run.

For Russia, figuring out the supply picture is trickier, because much of the palladium coming out of the country has originated from national stockpiles — and stockpile levels are considered a state secret. However, to get some indication of Russian inventories, the industry instead watches what gets sold in Switzerland — it being one of two major cargo hubs for the metal — and signs there suggest Russian stockpiles might be getting low. Last year, shipments from Russia to Switzerland dropped 12 percent, falling to 500,000 ounces, according to customs data reported by Bloomberg.

With palladium stockpiles most likely decreasing in Russia, and mine production forecast to decrease over 5 percent in 2011, palladium's supply picture thus remains tight.

David Davis, a mining investment analyst at Standard Bank's SBG Securities (Pty) Ltd, was quoted in Bloomberg as saying, "The palladium market, excluding any Russian stockpiles coming in, is going into an ever-increasing deficit. It'll put upward pressure on the price."

But just how high can the metal go? That depends on tomorrow's demand.

PGM Demand Depends On Jewelry, Cars

While platinum remains heavily used for jewelry, demand from that sector dropped from 40 percent to 32 percent in 2010, due to higher platinum prices. Investment demand accounted for another 7 percent, with the remainder allocated to the autocatalyst sector and for other industrial uses. (Although both platinum and palladium are commonly used in fume-scrubbing catalytic converters for cars, platinum remains the preferred choice for diesel engines. Palladium is preferred for gasoline engines.)

Palladium demand remains more concentrated in the autocatalyst sector and industrial use sectors, with only 7 percent used by jewelers in 2010 (although that is up from 3 percent in 2001). Another 7 percent was attributed to investment demand (up from 1 percent in 2006).

In 2010, palladium demand hit its highest levels in 10 years, boosted by increased environmental standards around the world and China's strong vehicle sales — over 17 million cars sold in 2010. Chinese vehicles are primarily gasoline-powered cars, as opposed to diesel; thus they require more palladium than platinum.

Global auto sales are forecasted to only increase; J.D. Power and Associates expects global light vehicle sales to rise 6 percent in 2011, with Asia leading the increase in automobile demand. Analysts predict China will sell 11 percent more cars in 2011. While that prediction is much lower than the growth rates seen in the past (33 percent in 2009 and 48 percent in 2008), it's still quite healthy and will ensure steady demand for both platinum and palladium.

But with tight supply and rising demand, price increases in platinum and palladium may begin to change the way the metals are used. Should prices rise too far, automobile manufacturers will be motivated to look for technological advances to decrease — or even eliminate — platinum and palladium usage.

In fact, that may already be occurring. As Bloomberg recently quoted Wulf-Peter Schmidt, manager for sustainability, Ford Motor Co. (F): "The amount of precious metals in catalytic converters is reduced. It's already being done."

In all likelihood, this tight supply/demand situation defines a new normal for the platinum group metals. The futures markets seem to agree; on Friday, Nymex raised the margin for palladium futures. While that doesn't really have an impact on anyone except individual futures traders, it does signal that perhaps NYMEX sees current palladium prices as a new baseline; after all, they wouldn't bother increasing the margins (which are a fixed dollar amount per contract) if they thought these prices were simply part of a bubble.

What Does QE2′s End Means for Various Asset Classes?

By Barry Ritholtz

Numerous parties have been complaining about — and making erroneous assumptions regarding — the Fed’s policy of quantitative easing. If the liquidity gusher of QE/ZIRP is impacting the primary asset class you are holding — and I am hard pressed to think of one it does not affect — then you best be prepared for what comes when it terminates.

Hence, our deceptively simple question today: What does the end of QE mean to various asset classes?
Its something I have been mulling over for a while. It has been in my mind for the past several weeks as the market has seen risk levels increase and volatility rise.

Recall our prior discussions as to the (actual) reasons we have such an aggressive monetary policy. Here are four primary factors I have concluded are behind the Federal Reserve policy of quantitative easing:
1. To avoid a repeat of the Central Bank errors of insufficient liquidity in the 1930s;
2.To provide the under-capitalized financial sector with a way to rebuild their balance sheets by borrowing cheap (from FRB) and lending dear (to Treasury); Note that a direct injection of capital is not politically feasible.
3. To avoid the painful natural cycle where huge credit booms are followed by painful de-leveraging busts; (the “hair of the dog that bit you” monetary policy)
4. To inflate asset classes in order to restore consumer and investor confidence, thus stimulating consumer spending and investing.
Other than item #1, I find all three of these reasons horribly misguided. And even #1 should only be a temporary liquidity facility, withdrawn as the crisis passes.

The trick as an asset manager is to avoid the easy temptation of the “Wonkery Honey Trap” — avoiding rising asset classes as a protest against terrible Fed policies. Far too many fund managers have succumbed to that foible. The managers who have outperformed over the past 2 years held their noses, then bought into assets sensitive to liquidity.

But with June a mere quarter away, the time to begin contemplating when markets will begin discounting the end of QE2. We might even go so far as to say the Bernanke Put may take a vacation of an undetermined  length.

Let’s consider a scenario where QE2 ends as scheduled in June. What does this mean for the Dollar, Equities, Bonds, Oil, Gold, and Ag-commodities?

It starts with the US dollar. For a little context, note the Dollar Index (DXY) plummeted from over 120 to about 70 — a drop of 41% of its value in just 6 years (2002 to 2008), thanks to the near fatal stewardship by the incompetency twins — Alan Greenspan and George W. Bush.

The financial crisis sent the dollar as a safe haven bank towards 90; since then, it has bounced and slipped back to 75 on a combination of Euro turmoil, hopes for a Japanese recovery, and Middle-East crises. The US bailouts, ZIRP, and QE1 &2 have applied pressure to the greenback during this period.

Bloomberg notes that policy makers are signaling an abrupt end to $600 billion in Treasury purchases, rather than a gradual end to bond market intervention. It is not unreasonable to expect that the end of QE2 will allow the world’s reserve currency to breathe, and perhaps find its footing.  And that is likely to have EXTREMELY serious consequences for Equities, Bonds, Oil Gold and AG commodities.

Crude Oil Spike Hits Stock Market....


It was only a matter of time before oil hit this market with the price of oil over $100 for this long. It has been trading well above $100 dollars per barrel for several days now with a spike near $107 per barrel pre-market today. The market finally gave it up to some degree on this spike, although not as much as one might think based on the breakout technically in place. 

The day started out not too bad at all with slight gains, but it didn't take long before the market started to head lower. The selling accelerated quite rapidly with the Nasdaq testing down and breaching its 50-day exponential moving average intra-day. The Nasdaq fell a quick 70 points from top to bottom in just a few short hours, or nearly 3%, which shows you the intensity of the selling. The S&P 500 held well above its 50-day exponential moving average all day, but it, too, sold quite hard once things got going on the Nasdaq.

The Nasdaq often leads both ways, and today was no exception to that rule as the S&P 500 tried hard to hold in the green, while the Nasdaq was decently red. But in the end, the depth of the fall on the Nasdaq took the rest of the market down with it. Oil has been holding on for a while now, and yet the market has found a way to dance around this bad news for the economy. You really had to wonder what was holding this market up, and to this day, all I can say about it is either the market thinks it's a short lived blast up, or that the bull market is just that powerful. My guess is a bit of both.

The price of oil controlled by overnight circumstances overseas. The market doesn't seem to think this is a long-term problem to be sure, although that doesn't mean it can't have short-term affects to the down side, offering up a nice correction to unwind things down to where you can buy far more aggressively. If oil stays up at high prices, such as we're seeing now, the perception alone of what that can do to our economy will take this market lower. The game of psychology being as important as real events that take place around the world.
It doesn't necessarily matter what the truth is, it's about the perception, and this is what causes folks to hit the sell button. So for now the market is captive to the price of oil on a moment-to-moment basis. The longer we stay over $100 per barrel, the more you'll hear negative talk about this countries future. And that could keep the correction rocking on a while longer, which in truth, would serve this market well.

One thing about corrections is the somewhat predictable nature of what stocks will do from the perspective of how deeply they'll sell or not. If you had a strong earnings report in this past quarter you won't come close to seeing the types of losses that will be sustained from the companies that reported bad earnings in the past quarter. Those are the stocks to avoid, and again, why you should always keep a scoreboard of who did what. Bull trend or bear trend, it's incredibly important to know what took place so you can then choose wisely whether or not to participate going forward from a long or short perspective, depending on what type of market we're in.

In addition, you want to avoid the stocks most tied in to the reason we're selling off in the first place. The catalyst, if you will. With oil the major catalyst, transportation stocks should really be avoided at all costs. This is an ongoing process for every type of market. Know what's causing what in either a bull or bear trend for the short- term and respond accordingly. For now there's no worse place to be than transports. If oil suddenly declines on world events, there will be no better place to be. Simply adjust to the moment's news.

The daily charts are doing some very good unwinding of their recently overbought oscillators. It's a good start and would be great if they actually went to oversold instead of just neutral. The area that needs the most work is the weekly charts as they're just coming out of overbought and would love to see the major index chart RSI's get down to the lower or mid 50's on those weekly charts. The lower the better, especially on those key daily charts. How great would it be to finally get a test down to the 30 RSI level on those daily index charts. Just for once, which would allow for a much more aggressive long stance. With things where they are now, it's not bad to have some exposure, although it would be great to just about go all in but only if things really unwound down across the board on those daily charts.

If they did, the weekly's would be unwound enough. If you're overbought for too long it often takes a period of oversold to occur before you rock back up. Problem is you don't want to get too cute waiting so you let the 60-minute charts offer the right entry, even if we don't quite get totally oversold on the daily charts. Any and all unwinding is welcome on the daily charts folks. We're working our way there but deeper selling would be needed to hit where things would align best.

If the S&P 500 loses 1294 then the Nasdaq will have already lost its 50-day exponential moving average with force. That's what we need to get things lower for some weeks to a couple of months. 2729 is the number on the Nasdaq. With today's close we're just not through it with any force, thus, we need to get confirmation there first. If we do, and it starts to run lower, then we can get the S&P 500 to follow along with the Dow. If that takes place, this market could get a sever test lower as the bears will become far braver having seen all those key 50-day exponential moving averages go away.

It'll take a move below all the 50's across the board because on back tests, the bears will come roaring in to take this puppy back down. Having lost only the Nasdaq, they still won't get overly aggressive. They want to see those 50's get taken out across the board. Then they'll feel good about being short and not having to worry about covering those short positions too quickly. So for now we watch and learn about whether these levels will hold and keep things on the light side for now.

How Much of QE2 Has Been Implemented?


A1. The Fed announced the implementation of QE2 (quantitative easing, the second round) on November 10, 2010, which involves purchases of $600 billion of longer-term Treasury securities from the private sector. As of this writing, roughly $404 billion of Treasury securities have been purchased. The rest of the planned purchase of Treasury securities (33% of $600 billion) is scheduled to be completed by June 2011. Purchases of Treasury securities, as expected, have led to an increase in the size of the Fed's balance sheet (see Chart 1) to $2.5 trillion.


Excess reserves of the banking system have also moved up to $1.217 trillion from $969 billion as of November 3, 2010 and reflect the impact of the Fed's QE2 program (see Chart 2). 

Q2. What is the status of the fiscal stimulus package?

A2. The American Recovery and Reinvestment Act passed in February 2009 consisted of a $787 billion fiscal stimulus package to stimulate economic growth and create jobs. According to the tally presented in www.recovery.gov, 92% of funds have been made available and 90% of tax benefits have been implemented. The Congressional Budget Office has estimated that the fiscal stimulus raised real GDP between 1.1% and 3.5% and lowered the unemployment rate between 0.7 percentage points and 1.7 percentage points in the fourth quarter of 2010. 

Congress enacted the second round of fiscal stimulus under The Tax Relief, Unemployment Insurance Reauthorization, and Job Creation Act of 2010, passed on December 6, 2010. The centerpiece of this legislation is the extension of tax cuts enacted under the Economic and Tax Relief Reconciliation Act of 2001 and the Jobs and Growth Tax Relief Reconciliation Act of 2003. This legislation extends the tax cuts for another two years and contains other provisions believed to stimulate economic activity. A 2.0% payroll tax cut will be in place during 2011, a 13-month extension of unemployment insurance and allowance for businesses to expense all of their investments in 2011 are the other highlights of this bill.

Our Super Commodity System Entered Short On Euro And Cotton

Qui sotto riportiamo gli screenshot relativi ai trades attualmente aperti dal nostro Super Commodity System su alcune valute, tra cui l’Euro, e sul Cotton. I risultati storici di Super Commodity sono a disposizione ai seguenti link: http://www.box.net/shared/static/xybqf6etyc.xls, http://www.box.net/shared/g6z56itu42. I risultati di alcuni altri nostri trading systems sono a disposizione al seguente link: http://www.box.net/shared/5vajnzc4cp

Below we have included the screenshots related to trades currently open from our Super Commodity System on some currencies, including Euro, and Cotton. Historical results of Super Commodity are available at the following links: http://www.box.net/shared/static/xybqf6etyc.xls, http://www.box.net/shared/g6z56itu42. Historical results of our some other trading systems are available at the following link: http://www.box.net/shared/5vajnzc4cp

AD BP EC
DX CT images

Material in this post does not constitute investment advice or a recommendation and do not constitute solicitation to public savings. Operate with any financial instrument is safe, even higher if working on derivatives. Be sure to operate only with capital that you can lose. Past performance of the methods described on this blog do not constitute any guarantee for future earnings. The reader should be held responsible for the risks of their investments and for making use of the information contained in the pages of this blog. Trading Weeks should not be considered in any way responsible for any financial losses suffered by the user of the information contained on this blog.

Palm oil to lose out to soyoil in Chinese imports

by Agrimoney.com

Palm oil is to lose out to soyoil in China's import rosters – and the disadvantage would be even bigger were it not for the soaring popularity of instant noodles.
China's consumption of vegetable oils is to grow by 5.4% to 28.9m tonnes in 2011-12, driven by "the steady growth of disposable income for Chinese consumers" driven by economic growth, the US Department of Agriculture's Beijing bureau said.
And, indeed, there may be room for it keep expanding yet, given population growth and comparison with neighbouring Taiwanese, who consume some 27% more vegetable oil per capita than the Chinese.
"Even though China's oil consumption has grown rapidly in recent years, there is still significant growth potential before it reaches the level of a similar market like Taiwan," the bureau said in a report.
'Price spike impact'
However, as far as imports go, it is soyoil which will prove the most favoured purchase, with China boosting buy ins by more than 5% to 2.0m tonnes, notably from South America.
"Argentina is expected to resume its status as the largest soybean oil supplier to China, after China lifted an import ban from late 2010," the report said.
Palm oil imports will rise by 1.7% to 6.1m tonnes, less than half the pace of last season, leaving them still a touch below the 2008-09 record.
"A price spike in 2011 is expected to negatively impact palm oil import growth," the bureau said, noting official data showing that the wholesale price of palm oil was 3% lower than soyoil in January, compared with an average discount of 10%.
Instant noodle craze
At least palm oil can count on its popularity among food processors, which use it in anything from biscuits to chewing gum to butter spreads – and in China notably for instant noodles.
"Industry sources show that instant noodle production in 2010 surged to 6.9m tonnes, up 23% over the previous year," the briefing said, adding that such products used "large amounts" of palm oil.
"Ready-to-eat noodles are popular with migrant workers and some office workers due to their low cost and convenience.
"With more and more people travelling and eating outside of the home, demand for instant noodles is expected to continue rising in 2011 and beyond."
Unlike in soyoil, China does not produce any palm oil itself, relying mainly on shipments from Indonesia and Malaysia, making it the second-largest importer of the vegetable oil after India.

Fed's Wealth Effect Money Creation Machine Driving Stocks Bull Market, Keep Bears at Bay


Jon D. Markman writes: Stocks ripped higher at the start of the past week, then collapsed, revived and collapsed again. 

Yeah, it was an exciting few days. By the time it was all over bull and bears discovered they had fought to a tie that just barely favored buyers as the Dow Jones Industrial Average closed up .3% for the week, while the Standard & Poor's 500 Index was +0.1%, the Nasdaq Composite was +0.13% and the Russell 2000 small-caps were +0.3%.

Concerns that insurrection would flow across North Africa to the oil-rich sultanates of the Middle East was the key concern, lifting crude oil by $4 and keeping prices in check. But straining to make a positive impact were upside surprises in U.S. and global manufacturing and services data, plus auto sales, same-store sales, initial unemployment claims and private payrolls data. A recovery is well under way, if only it could get out from under the geopolitical cloud.


The market's whipsaw action of the past few days must be confusing to people who do not understand the underlying narrative of the market in this cycle. It must look like traders can't make up their minds about what big companies are worth.

The reality as you know is that the major forces in this market have embarked on a deliberate campaign to inflate assets of all stripes and create a sustainable economic recovery through radical monetarism. Occasionally bearish sentiment is allowed to creep through, like a mildly corrosive acid, to create some texture to the uptrend. But there has been little chance for any material erosion to take place before bulls reassert their authority.

Biggest gainers for the week among sectors were health care, +2.4%, utilities, +0.6%, energy, +0.4% and staples, +0.2%. Losers were financials and telecom. 

The latest economic data offered support to the Friday payrolls report that companies have almost certainly started hiring vigorously again. On Wednesday we saw a better-than-expected 217,000 increase in February's Automatic Data Processing (Nasdaq: ADP) private payrolls. And Thursday we see that initial claims fell 20,000 to 368,000 last week, compared with an expected uptick to 395,000.

Separately, the Monster Employment Index rose 5.7% in February, its first increase in five months, to 129, suggesting strengthening online job demand. The year-over-year change in the index has eased to 4.0%, partly due to the steep decline in public sector activity, according to Ned Davis, but has remained positive for over a year.


In more minor economic data news, the ISM non-manufacturing composite index rose 0.3 points to 59.7 in February, its highest level since August 2005, indicating faster growth in the service sector. Economists expected a slight decline of 0.4 points to 59.0. This is how you get companies like Comedy Central producer Viacom Inc. (NYSE: VIA), one of our StrataGem XR positions, achieving new heights both in its fundamentals and price appreciation.

Car sales are a huge part of overall retailing, and they are rolling higher again according to data provided by Ned Davis Research (NDR). Boosted by incentives, vehicle sales rose 6.4% to a 13.4 million unit annual rate in February, the most since the cash-for-clunkers program in August 2009.

Domestic autos led the way with a sales gain of 15.3%. Sales of light trucks rose to its best level since August 2008. Sales of heavy trucks also did well with an 8.2% advance to a 277,000 unit annual rate, the most since September 2008, an indication of increased capital spending.On a year-over-year basis, total sales have risen 27.6%, the most in 23 years.

NDR concludes that light vehicle sales would top 13.4 million units this year, which would have seemed like an outrageous idea nine months ago. The fundamental driving forces that NDR identified, such as improving credit availability, remain in effect. In fact, leases made up a quarter of all new vehicle sales in February, the most since November 2005, according to auto info source Edmunds.

All in all, a strong week of data - cloaked by the mess in North Africa. My expectation is that the geopolitical tumult will subside more quickly than most expect, and allow the underlying strength of the recovery to dominate again.

Many observers expressed surprise that buyers were not a stronger force on Wednesday, given the prior session's sharp downdraft. They fretted over the lack of ardent dip-buying.

But I don't think that's the right way to view the action. Bulls don't need to prove anything. They are in charge. It's bears that need to prove they can take the bull market down. And they have failed.


Here's what I mean. Bulls have bought and paid for this uptrend. They own it, they have maintained it -- it's a shining, beautiful hot-rod in their driveway that they are proud to show off. Look at this chart of Texas Instruments Inc. (NYSE: TXN), as one shimmering example. It's ready to explode higher again after a touch of its 30-day exponential moving average. It's textbook.

Bears are the outsiders. They are looking at the bulls' ownership of this breathtaking beauty of an uptrend -- +100% in two years! -- and they want nothing more than to smash it and lay it low. They aren't bad people. They just see the world differently than the bulls. If you chatted over a glass of Lagavulin, they would intelligently lay out a hundred perfectly sensible fiscal, monetary and fundamental reasons that stocks should be valued 20% lower than where they are today.

But bears' problem is that they are trying to fight the most prodigious positive force in the history of investment liquidity, and that is a U.S. Federal Reserve hellbent on creating a sustainable global economic recovery through the transmission mechanism of a "wealth effect."

The Fed wants to push the market up to make Americans feel richer on paper so that they buy more stuff. They want that buying to encourage businesses to obtain more equipment and hire more workers. They want this to be self-sustaining, and they have absolutely no qualms about the means they use -- ranging from buying Treasurys to sparking the equity futures -- to get to their end.

They don't see this as cynical. Fed chief Ben Bernanke, a former Princeton University econ prof, is just trying out a theory he devised a decade ago for just this scenario. Hopefully it works. No one can say with any certainty that it will or won't, though admirers and detractors each think they have facts and history on their side.

Bears keep warning that bulls will get their comeuppance when the Fed ends this second round of quantitative easing as scheduled in mid-summer. But I think they underestimate the Bernank's persistence. If he has not achieved its goal of a glidepath to sub-8% unemployment and stable inflation, we can expect a third and fourth round of easing.Whatever it takes.

The commodity markets and Organization of the Petroleum Exporting Countries (OPEC) seem to understand this more than the equity bears. They realize that all this easing is cheapening the dollar. So they are pushing up the value of tangible goods to compensate. A supply shortfall is helping, but there's more at play here.Commodities, especially oil and grains, are the new global currency. They are universally fungible and useful.

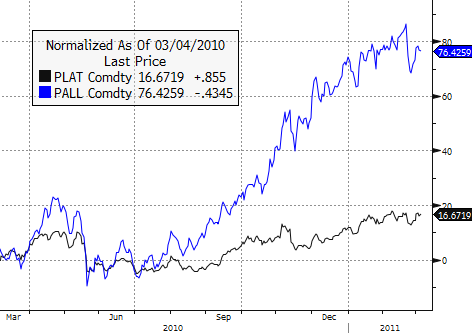
You may recall my target for gold was $1600 in the first half of 2011, and we appear to be on that path, as you can see in the chart above. If you think of crude oil as a currency instead of just a fuel, you can see it has potential to $130-$160.

So it's not a surprise to see corn, cotton, crude and gold at or near record highs. And the broad stock market? Well, it's made up of a lot of individual companies but taken as a whole shares are considered just another inflation hedge. So there's no reason it can't go to a new high too -- as, of course, the mid-cap indexes already have.

Chips on the Dip

While the overall market move this week was rather soft there were some powerful advances in the most deeply cyclical industries that fell sharply the day before.

In demand were semiconductor makers, like my model's favoritesTexas Instruments,Altera Corp. (Nasdaq: ALTR)and Analog Devices Inc. (NYSE: ADI), semiconductor equipment makers, like our Applied Materials Inc. (Nasdaq: AMAT), as well as industrial manufacturers, likeRoper Industries Inc. (NYSE: ROP) and Gardner Denver Inc. (NYSE: GDI). 

These cyclicals have been the drivers of the broad up-move since March 2009, as discussed on Tuesday. Expect them to continue to lead at least over the next couple of months.

The upside in chips and chip equipment makers was driven largely by an upgrade from JPMorgan Chase & Co. (NYSE: JPM)analysts to "constructive" from "cautious." Constructive is a weasely word, but it means they are positive. And an industry association reported that spending on chip-making projects could grow by 22% globally this year, while spending on chip equipment production will grow by 28%.

George Diseldorff, analyst at Semiconductor Equipment and Materials International, said that 2011 spending will finally exceed the peak year of 2007 of $46.4 billion.

The organization expects spending on chips and chip-gear projects to approach $47.2 billion in 2011, almost $9 billion more than last year, as companies look to upgrade existing facilities to avoid overcapacity and oversupply. Reuters reported that industry giant Intel Corp. (Nasdaq: INTC)has increased capital expenditure plans to $9 billion in 2011 from $5.2 billion in 2010.

That's a huge, huge change in forecast -- not to be underestimated.

So why was the rest of the market unengaged? It's those pesky financials. Life insurers cracked, as MetLife Inc. (NYSE: MET) announced a share sale that took its stock down 5%, and also cratered rivals Prudential Financial Inc. (NYSE: PRU) and Lincoln National Corp. (NYSE: LNC). Regulatory concerns continue to swamp the banks as well, as investors mope over coming mortgage and credit card rules.

These companies are still paying for past sins, and may have to do so for the rest of the cycle, much like techs underperformed not just during their crash of 2000-2002 but in the 2003-2007 upswing that followed.

Bottom line for the week: The Libyan crisis will stumble toward a resolution fairly soon. Don't be too surprised if Col. Moammar Gadhafi manages to retain power. He's brutal, canny and a survivor. The Americans have weighed in against him, but he still has the support of the Russians and Chinese and, nervously, the Europeans. Expect the flow of oil to be restored if a third party, such as the Turks or Venezuelans, can broker a truce between the rebels and government. It will take a while for evacuated foreign drilling services workers to return, but oil prices will simmer down.

Even if Libya chills out, though, oil prices will not go back to where they were because they are actually elevated due to the fear that Saudi Arabia will be in play next.


Stunning Lack of Economic Understanding at the Fed


As the world confronts one of the most critical periods of economic upheaval that it has ever seen, it is clear that our most influential economic stewards have absolutely no idea what they are doing. But, like kids with a new chemistry set, they are nevertheless unwilling to let that stand in the way of their experimental fun. As they pour an ever-growing number of volatile ingredients into their test tubes, we can either hope that they magically stumble on the secret formula to cure the world's ills, or more pragmatically, we can try to prepare for the explosion that is likely to result.

Recent comments from current and former Federal Reserve Chairmen, and from the leaders of the European Central Bank, have starkly illustrated this stunning lack of understanding. In an extended interview on CNBC today, former Fed Chairman Alan Greenspan, once considered the sagest of all economic gurus, admitted that he had no idea whether the Fed's current quantitative easing program will help or hurt the economy. The Maestro simply said that we must wait and see, and if positive economic indicators come, then we may begin considering the policy to be a success. That's some serious insight.

In other words, after dedicating his life to the study of macroeconomics, Greenspan is left with no deep understanding of how the injection of trillions of dollars of printed money affects an economy. The chicken who plays tic-tac-toe in Chinatown could likely offer the same level of critical analysis. To paraphrase Nancy Pelosi: according to Greenspan, we have to conclude the policy to know if it works. Although I have never been thought of as an economic expert by anyone with actual access to power, permit me to offer a thought on the subject: printing money creates inflation, which weakens an economy. Unfortunately, this kind of common-sense thinking never seems to penetrate academic circles.

Without fundamental understanding, all economists are left with is surface analysis of current data and an inclination to play probability and statistics. This is like a meteorologist opening the window, checking current conditions, and making predictions based on analysis of recent days. While this may be useful, it is no substitute for an understanding of atmospheric dynamics and climatology. In his interview, Greenspan essentially confirmed this bias for "open window" economics, saying that Ben Bernanke and Jean-Claude Trichet both follow the same models, but with different statistical sensitivities: Bernanke toward growth data and Trichet toward inflation data. In that sense, both are no better than Las Vegas odds-makers, with one putting his chips on inflation risk and the other betting on recession risk.

This gambler's approach helps explain why economists fail to understand the obvious benefits of a strong currency. According to people like Bernanke, a weak currency is like an ace up the sleeve, a clever way to undercut the competition. The problem is either everyone does it and the game ends up swimming in aces, or Bernanke gets caught and other countries decided they don't want to play anymore (sell Treasuries).

Conventional warfare in this arena used to involve central bank buying and selling currency reserves in the open. But in the aftermath of the financial crisis, these timid measures were abandoned. In the last few years, the United States has upped the ante and brought out unconventional weaponry. The trillions of dollars printed by the Fed are the economic equivalent of carpet bombing. Initially our enemies responded in kind, and sought to devalue their currencies in lock step. They fought fire with fire and showered liquidity on their own economies. However, as the collateral damage mounted in the form of surging food and energy prices, they have begun sounding the general retreat.

In an interview on CNBC this week, James Bullard, the President of the Federal Reserve Bank of St. Louis, claimed that the Fed's easy money policies were not responsible for inflation overseas, arguing that foreign central banks had a choice. They could have allowed their currencies to rise, which would have kept prices from rising in their internal markets. Instead, they chose to prevent their currencies from rising - thereby importing our inflation. In other words, they had to choose between exchange rate stability and price stability. Apparently, they couldn't stand the heat, so they are getting out of the kitchen.

Bernanke's recent testimony before Congress, in which he argued that the Fed can't be blamed for rising commodity prices, will surely increase international unease. Yet still, as the issuer of the world's reserve currency, the Fed is blazing a trail that other central banks feel compelled to follow. It is no coincidence that inflation is highest in those nations that maintain a peg against the dollar. But making this fundamental connection is beyond the ability of our statistician-in-chief.

Bernanke makes another fundamental error by blaming higher commodity prices on faster global growth. Growing economies produce more stuff, which keeps prices in check. However, if money supply grows faster than production, prices rise. So, the increased demand to which Bernanke refers is merely a function of more money, not faster growth.

In the end, we will overwhelm our competitors with a show of extreme force. By the time the Fed rolls out QE IV or QE V, the US will emerge as the undisputed winner of the currency war. To the victor goes the spoils, which, in this case, will be higher consumer prices and interest rates and lower standards of living. On the other hand, the losers will enjoy rising living standards, as their stronger currencies serve to lower prices and increase consumption. If that doesn't make perfect sense, maybe we should run it by the chicken. 

See the original article >>

Look At This Chart, And You Can See What A Massive Blunder The ECB Is About To Make

by Joe Weisenthal

Jean Claude Trichet hinted last week that an ECB rate hike could be imminent.

Unlike our Fed, which really focuses on "core" inflation, the ECB gets twitchy about everything.

But look again at where this inflation is coming from. It's energy, as the below chart from Morgan Stanley shows nicely. Food is part of it, but it's not that dramatic. Unless you think that the ECB raising rates will do something about the price of oil -- lately something that has been driven by turmoil in the Mideast -- this can only be characterized as a massive policy blunder, like what Bernanke talked about in his old paper.

Meanwhile, if the ECB does ultimately go through with the hikes it could end up being Euro bearish -- as pointed out last week by BofA FX strategist Athanasios Vamvakidis -- if it simply raises problems for the periphery.
inflation components


See the original article >>

What's Wrong with Government Debt


The news abounds with arguments and even riots over so-called austerity measures. Whether in the Middle East, Europe, or even certain US states, the public is realizing just how deep a hole various governments have dug for themselves. In this article I'll outline Uncle Sam's position and then explain why it's such a problem.

A Shocking Chart

I considered myself fairly conversant with the fiscal trends for the federal government, but I was shocked to see Keith Hennessey's illuminating chart of the trends projected in the Obama administration's February budget report:

President Obama's Proposed Budget Path

At first the reader may think the chart is disturbing but no cause for panic; after all, the economy grows over time, so we'd expect spending and deficits to get gradually bigger over the coming decades. Such a reaction would be acceptable if the y-axis of the chart were denominated in dollars. But unfortunately, the y-axis is percentage of GDP.

According to Hennessey, the White House projections assume that the economy gradually moves out of recession, and tax revenues recover, shrinking the annual federal-budget deficit to a low point of 2.9 percent of GDP by 2018. But after that point, the deficits get progressively bigger, not merely in absolute dollar terms but even as fractions of the economy.

The Relation between Deficits and Debt

If we ignore liabilities such as Social Security and Medicare and focus instead just on the actual bonds issued by the Treasury when it borrows money, then each year the outstanding federal debt increases by that year's budget deficit. For example, if the government starts the year off owing $10 trillion to bondholders, and then runs a $300 billion deficit, it ends the year owing $10.3 trillion. In order to keep the federal debt constant in absolute dollar terms, the government would (obviously) need to balance its books, and only spend each year (including interest payments on the existing debt) what it takes in as taxes and other revenues.

If we move from absolute dollar terms into percentages of GDP, things get a little trickier. Because the economy grows over time, it's possible for the government to run perpetual deficits while maintaining a constant debt/GDP ratio.

For example, using inaccurate but nice round numbers, suppose the debt is $10 trillion and GDP is $20 trillion. That means the debt-to-GDP ratio is 50 percent. Suppose further that the economy will grow on average 5 percent (in nominal terms) each year. In that case, the government can perpetually run a deficit equal to 2.5 percent of the entire economy, and keep the overall debt-to-GDP ratio constant at 50 percent.
Let's check the math for the first two years to see the pattern: In the first year the government runs a deficit of $500 billion (which is 2.5 percent of $20 trillion). At the end of the first year, then, the debt has grown to $10.5 trillion, while the economy has grown by 5 percent to $21 trillion. Thus the debt-to-GDP ratio is 50 percent ($10.5 trillion / $21 trillion = 0.5) just as before.

In the second year, the government runs a higher deficit of $525 billion (which is 2.5 percent of $21 trillion). At the end of the second year, then, the debt has grown to $11.025 trillion ($10.5 trillion + $525 billion = $11.025 trillion). Meanwhile the economy has grown another 5 percent to $22.05 trillion, keeping the debt-to-GDP ratio constant at 50 percent ($11.025 trillion / $22.05 trillion = 0.5).
The general pattern is that to maintain a constant debt as a fraction of the economy, the deficit as a share of the economy has to be the debt fraction multiplied by the growth rate of the economy. (With our numbers, 50 percent debt multiplied by a 5 percent growth rate meant a 2.5 percent deficit was needed to maintain a constant debt load.)

Interest rates don't directly affect this calculation, but they do make it harder to keep the deficit limited to a particular share of the economy. Let's return with our example and go back to the first year: With an initial debt of $10 trillion, average interest rates of 3 percent on Treasury securities means that $300 billion of the government's budget will go to paying bondholders. If interest rates rise to 7 percent, then the government will have to allocate $700 billion for this purpose. Either way, to maintain the debt burden, the government can only run a $500 billion deficit. But the point is that there will be $400 billion more in goodies available to the public — including the possibility of tax relief — if the debt is rolling over at 3 percent versus 7 percent.

As Hennessey's chart shows, the deficit as a share of (real or inflation-adjusted) GDP is projected to steadily grow after 2018. Even if the red line leveled off at the far right edge of the chart, so that the deficit stabilized at 10 percent of GDP after the year 2060, a typical 3 percent growth rate in real GDP would mean that the debt-to-GDP ratio would ultimately stabilize at a whopping 333 percent of GDP. 

International investors might tolerate such an incredible debt ratio for temporary emergencies such as a war, but if built-in demographic shifts lead the United States to head down such a path, bond default (either explicit by the Treasury or implicit by the Fed's monetization) will appear inevitable. Hennessey's chart isn't scary because it will actually happen; people will have to alter course sooner than that.

On the contrary, Hennessey's chart is scary because it shows, in his words, that the "long term budget problem begins now."

Do Deficits Matter?

Ironically, there are some commentators who argue that federal-budget deficits are either meaningless (because the government issues US dollars) or even beneficial, because they are the only mechanism through which private Americans can save on net. I have dealt with these specific arguments elsewhere, but let me reiterate why huge and perpetually growing deficits are a problem.

Contrary to Keynesians, the problem with government budget deficits is not merely that they (typically) lead to higher interest rates and thus reduce private-sector investment and consumption spending. Because, in this context, the Keynesians only look at economic factors insofar as they work through "aggregate demand," they understandably think that large deficits can't possibly hurt anything when interest rates are practically zero.

However, Austrian economists have a much richer model of the capital structure of the economy. In this view, economic health isn't simply a matter of propping up total spending high enough to keep everybody employed. On the contrary, resources need to be deployed in particular combinations in particular sectors of the economy, so that semifinished goods can be transformed step-by-step as they move through the hands of various workers at different businesses and finally onto retail shelves.

When the government buys (say) $1 trillion more than it takes in as tax revenues, it diverts real resources out of the jurisdiction of private entrepreneurs and into politically directed channels. Ultimately, it is not deficits per se but total government spending that distorts the economy and starves the private sector of resources. But deficits are insidious because they give the illusion of freebies in the near term, and the reckoning comes with a vengeance down the road.

Conclusion

American politicians are always talking about "reining in entitlements" and "getting serious about the deficit." As Keith Hennessey's sobering chart reveals, that time is now. If citizens do not demand a serious retrenchment in government spending, foreign creditors will eventually make the tough choices for us, and on much harsher terms.

See the original article >>

Follow Us