Saturday, September 24, 2011

In Italy we had "dwarfs" and "dancers" to the government ... now we have also "donkeys" ......


Roma, 24 set. - "Non ce ne eravamo accorti, ma il Ministero dell'Istruzione dell'universita' e della ricerca italiano ne e' sicuro. Esiste un tunnel di 732 Km tra il Cern di Ginevra e il Gran Sasso e non lo sapevamo. Di piu': 'Alla costruzione del tunnel tra il Cern ed i laboratori del Gran Sasso, attraverso il quale si e' svolto l'esperimento, l'Italia ha contribuito con uno stanziamento oggi stimabile intorno ai 45 milioni di euro'. Gelmini dixit".

E' l'attacco della Rete 29 Aprile ("Ricercatori per una universita' pubblica, libera e aperta") al ministro dell'Istruzione Mariastella Gelmini, che nel commentare l'esperimento con cui si e' scoperto che i neutrini possono superare la velocita' della luce, aveva parlato ieri per l'appunto di un tunnel tra la Svizzera e l'Abruzzo attraverso cui erano stati fatti correre i neutrini.
 

"Nessun tunnel - replicano i ricercatori - ma un fascio di neutrini che e' stato 'sparato' dal Cern di Ginevra per un viaggio sotterraneo che dura 2,4 millisecondi, raggiunge la profondita' massima di tre chilometri per effetto della curvatura terrestre e termina al Gran Sasso, dove il fascio e' 'fotografato' da un rilevatore e ne viene misurata la velocita'. Quindi tranquilli, soprattutto i cittadini di Firenze che si trovano sulla traiettoria: il viaggio delle particelle, perfettamente rettilineo, non impegna nessuna struttura costruita dall'uomo; e nessuno potra' usare tale esperimento per giustificare una nuova TAV sotto il Trasimeno.
 
Purtroppo pero' per noi, il ministro pensa che i soldi che l'Italia da' per la partecipazione al Cern siano finiti nella costruzione di qualcosa che con la fisica delle particelle ci sta come i cavoli a merenda: un bel tunnel che farebbe impazzire dagli incubi qualsiasi progettista: ben 732 chilometri, opera inconcepibile e impossibile (quello piu' lungo costruito dall'uomo e' a tutt'oggi il nuovo San Gottardo, solo 57 chilometri, roba da ragazzi). Il ridicolo toglie il fiato" .

See the original article >>

Roubini and Soros Say The U.S. Already in Double Dip Recession and Warn of Uprising


Dr. Doom Roubini has grown even more pessimistic since he put a 60% probability of a U.S. double dip in 2012 just about three weeks ago. Business Day reported that speaking at a press conference in Johannesburg on Sep. 20, Roubini now says, "The US is already in a recession although it will not admit it." and that the rest of the world would not be insulated from the effects of another global meltdown. (Clip Below)

Regarding Greece and Euro Zone, Roubini thinks Greece would do best to default on its debt and leave the euro zone, and that Europe needs to step up austerity measures: .

Eerily, George Soros also said almost exactly the same in a CNBC interview. Soros believes the U.S. is already in a double dip recession, and that "a number of smaller euro zone nations could default and leave the single currency area." Soros also sees Europe could be "more dangerous" to the global financial system than the Lehman Brothers in 2008, due to "Euro zone policymakers repeatedly following the wrong policy shifts."

But there's a reason Boubini earned his "Dr. Doom" reputation as he made an even more ominous prediction that there would be protests as well in the world’s largest economy.
"There is growing inequality all over the world. We have already seen middle-class unrest in Israel. Germans have smashed fat cats' cars.....As we go into another recession, there will be unrest in the US."
Interestingly, Business Day quoted Roubini that he was not averse to state involvement in the economy and held up Singapore — which had state ownership of firms and joint regulation and free markets — as an economy that might be shielded from global shocks.

EconMatters Commentary

While we are a bit surprised that Roubini seems to have lost total faith in capitalism by embracing a somewhat socialistic structure of the Singapore Model, we have to admit, on first blush, we (along with the markets) are sufficiently freaked out by both Roubini and Soros asserting the double dip status of the United States.

However, that feeling quickly dissipated as we think about the definition of recession - two down quarters of GDP, or when National Bureau of Economic Research (NBER) declares one, and realized the U.S. so far has not met these conditions yet.

We do believe Europe now holds the key as there's a distinct risk that the U.S. could be pushed over the recession edge by the Euro Zone debt crisis due to the interlinkage of the global financial system.

On the other hand, the current euro zone debt crisis is quite similar to the debt ceiling fiasco in the U.S. a while back. The bloc has an inherent structural weakness - central currency without a central political governing body. But eventually there will be resolution, be there a Greek default and leaving the currency union, or a super-roid-charged bailout package as the stakes are too high for a Euro collapse.

Meanwhile, the U.S. economy could be facing a tough patch in the next two years or so, but the odds are still in favor that backed by its tremendous natural and human resources, the country could pull through and resume growth.

Roubini has been consistent with his double dip recession gloom and doom for the past three years; however, Soros track record suggests that his recession talk could be nothing more than a reflection of his current trading position, knowing his influence over the market, rather than an objective economic assessment.

Greece needs decade to get competitive: German finance minister

by Reuters


German Finance Minister Wolfgang Schaeuble said in a magazine interview published on Saturday that Greece would not be able to return to capital markets next year and would need a decade to make its economy competitive.

Schaeuble told business weekly WirtschaftsWoche that it was "clear that Greece will not be able to return to capital markets in 2012, as we thought in 2010."

"Greece will need a decade rather than a year to get fully competitive," added the minister from Chancellor Angela Merkel's center-right government.

With anxiety about a possible Greek sovereign debt default rising in Europe, the chief economist of German insurer Allianz (ALVG.DE) said a major haircut for Greek government bondholders would only increase the risk of contagion in the euro zone.

"I don't believe the time is right for a debt haircut like this," Michael Heise told German radio, in response to Greek media reports -- denied by Athens on Friday -- that one option was an orderly default with a 50 percent haircut for creditors.

The economist said such a default scenario would create more problems and increase the risk of contagion to other euro zone countries, which would create "a very, very serious situation."

Athens denied reports in two Greek newspapers that Finance Minister Evangelos Venizelos had outlined various options to lawmakers, including a bailout by Europe and the International Monetary Fund, a haircut and a disorderly default.

Merkel said on Friday that a Greek default was "not an option for me" as the damage was "impossible to predict."

With heavily-indebted Italy also giving increasing cause for concern, her finance minister Schaeuble said in the interview Italy was "a strong country with good economic data."

"Italy's debts are manageable and could be brought back into the guidelines relatively quickly," he said, adding that the downgrading by rating agency Standard & Poor's could prove beneficial by encouraging Italy "to implement the already decided measures more quickly and urgently."

But Italian Economy Minister Giulio Tremonti suggested on Friday that the ball was in Germany's court and the European economic powerhouse had to overcome its own "uncertainties" about whether to save the currency union.

"Now everything depends on Europe, and Europe depends on Germany, and that depends on the capacity Germany must have to overcome its uncertainties and understand that Europe is in everyone's interests, including theirs," he told Italian TV.

He appeared to be referring to a threatened revolt among some members of parliament in Merkel's coalition on a crucial vote on the European Financial Stability Facility -- the euro zone's current bailout mechanism -- in Berlin on September 29.

See the original article >>

THE BIGGEST BUBBLE OF ALL-TIME

By Randall Wray

Sorry, this is a day late (but hopefully not a dollar short).

Back in fall of 2008 I wrote a piece examining what was then the biggest bubble in human history: http://www.levyinstitute.org/pubs/ppb_96.pdf.

Say what? You thought that was tulip bulb mania? Or, maybe the NASDAQ hi-tech hysteria?

No, folks, those were child’s play. From 2004 to 2008 we experienced the biggest commodities bubble the world had ever seen. If you looked to the top 25 traded commodities, you found prices had doubled over the period. For the top 8, the price inflation was much more spectacular. As I wrote:

“According to an analysis by market strategist Frank Veneroso, over the course of the 20th century, there were only 13 instances in which the price of a single commodity rose by 500 percent or more. For example, the price of sugar rose 641 percent in 1920, and in the same year, the price of cotton rose 538 percent. In 1947, there was a commodities boom across three commodities: pork bellies (1,053 percent), soybean oil (797 percent), and soybeans (558 percent). During theHunt brothers episode, in 1980, silver prices were driven up by 3,813 percent. Now, if we look at the current commodities boom, there are already eight commodities whose price rise had reached 500 percent or more by the end of June: heating oil (1,313 percent), nickel (1,273 percent), crude oil (1,205 percent), lead (870 percent), copper (606 percent), zinc (616 percent), tin (510 percent), and wheat (500 percent). Many other agricultural, energy, and metals commodities have also had large price hikes, albeit below that threshold (for the 25 commodities typically included in the indexes, the average price rise since 2003 has been 203 percent). There is no evidence of any other commodities price boom to match the current one in terms of scope.”

Now here’s the amazing thing about that bubble. The staff of Senator Joe Lieberman and Representative Bart Stupak wanted to know whether the bubble was just due to “supply and demand”. Relying on the expertise of Frank Veneroso and Mike Masters (two experts on the commodities market), I was able to conclude beyond any doubt that it was a speculative bubble driven by a “buy and hold” strategy adopted by managers of pension funds. Hearings were held in Congress, with guys like Mike Masters testifying as well as representatives from the airlines and other industries.

The pension funds panicked, realizing that their members would hold them responsible for exploding prices of gasoline at the pump. Pension funds withdrew one-third of their funds and oil prices fell from about $150 per barrel to $50. If you want to read the detailed analysis, go to my paper cited above—it has to do with commodities indexes, strategies pushed by your favorite blood sucking vampire squid (Goldman Sachs), and futures contracts. It gets wonky. To make a long story short, the bubble ended in fall of 2008.

But then the crisis wiped out real estate markets and the economy. Managed money needed another bubble. They whipped up irrational fears of hyperinflation that supposedly would be caused by Helicopter Ben’s QE1, QE2, and the newly announced QE3. Better run to good “inflation hedges” like gold and other commodities. That did the trick. The commodities speculative bubble resumed.

And boy, oh boy, what a boom. An April report by expert Jeremy Grantham looks at the last decade’s bubble in commodities; Frank Veneroso expands upon that in a more recent report. Here’s the elevator speech summary. Take the top 33 commodities that are globally traded—everything from gold and oil to to rubber, flaxseed, jute, plywood, and something called diammonium phosphate. Over the past 110 years, an index price of these 33 commodities has declined at an annual rate of 1.2% per year. (Sure there are variations across the commodities—this is the average. And so much for inflation hedges. Commodities prices fell—they did not keep up with inflation. If you liked negative returns, commodities were a good bet.) Although demand for these 33 commodities has increased a lot over the century, new production techniques plus successful exploration has resulted in a declining price trend.

Further—and this is a bit surprising—deviations from the trend follow a normal distribution (you learned about this in high school; it is a bell curve with nice properties; chief among these is the finding that about 68% of outcomes fall within one standard deviation; about 95% fall within two standard deviations (once a generation); and you’ve got just about a snowball’s chance in hell of finding outcomes that are three or four standard deviations from the mean).

But what is more surprising is that over the past decade, the price rises you find for these 33 commodities are just about beyond the realm of possibility—2, 3, and 4 standard deviations away from trend. It is a boom without any precedent. Quite simply, nothing even close has ever happened before, in any market, including hi tech bubbles and real estate bubbles.

By now you’ve all read about black swans with fat tails—a reference to supposedly “unexpected” and highly improbable default rates on subprime mortgages and other toxic waste assets. (Way out the normal distribution’s “tail”.) As an insider quipped, you had once in 100,000 year events happening every day. But that is misleading. These were junk assets that from the get-go had nearly 100% probabilities of default—NINJA loans and so on. The models were flawed, indeed, fraudulent. That was all a scam. Those weren’t black swans with fat tails—they were Hindenburg blimps filled with explosive hydrogen just waiting for someone to light a cigarette.

By contrast, in the case of commodities, this is real stuff (not IOUs of deadbeats with no prospects). Barrels of oil that someone really wants. Corn to turn into pig and steer fat, or fuel for Midwest automobiles. Or gold to be hoarded by the University of Texas. There really is a demand for it; and someone produces it.

Yes, commodity bubbles happen, but eventually reality sets in and brings the price back down to reality. You don’t get 3, 4, and 5 standard deviation events. A four standard deviation price rise falls outside 99.994% of all outcomes—one in 100,000 years; a five standard deviation price rise is about one in 2 million years. That pretty much covers the time since our ancestors beat things with big sticks.

But wait a minute. The standard deviation of price rises for iron (5), coal, copper, corn and silver (4), sorghum, palladium, and rubber (3.5), flaxseed, palm oil, soybeans, coconut oil, and nickel (3), and so on down through jute, cotton, uranium, tin, zinc, potosh and wool (2) are so unlikely that they quite simply could not have happened. Individually. Together, the likelihood that we’ve got an unlikely boom in almost all of the 33 commodities? All at the same time? Impossible. Cannot happen. Not in the lifetime of our sun, let alone our planet.

But it did.

Why? China. Peak oil. Supply disruptions. Some markets cornered by speculators. Market manipulation by oligopolistic suppliers.

Yes, OK, those have played some small role. But remember, we are in the worst global slowdown since the 1930s. I will not go through all the data, but demand for most commodities is actually slumping. For many there is substantial excess supply. And China wants to slow. China is still largely a socialist society. China basically does what it wants to do. China will slow.

And yet the prices rise far beyond anything that has ever happened before. Beyond anything that can happen.

Why? Financialization. Just as homes became financialized (in many ways, including serving as the collateral for “ATM” cash-out home equity loans), commodities became thoroughly financialized. (So did healthcare and death, with peasant insurance and death settlements—topics for another day.)

Here’s the reason. Believe it or not, commodities markets are tiny; except for soy, oil, and corn they are smaller than tiny. Managed money is huge—tens of trillions of dollars floating around the world looking for high returns. US pension funds alone are three-fourths of US GDP–$10 trillion give or take. If you put even a fraction of managed money into commodities index funds, you blow up the prices.

The weapon of choice is the futures contracts—essentially you buy commodities for future delivery (a couple of months from now). When they mature, you do not take delivery but instead sell the contract to someone who actually wants the commodity, and roll into another futures contract. This is what pension funds, and so on, have been doing. If prices rise, you always win on the roll (sell for more than you paid).

The typical argument is that this cannot affect prices since for every buyer (long position in the contract) there must be a seller (short position). The balance between these two keeps prices in line with “fundamentals”.

In normal times, yes, more or less. But here’s the deal. What if I supply diammonium phosphate (whatever the heck that is) and you are speculating that the price will rise. You and every other pension fund and client of Goldman Sachs. I want to lock in the expected price rise, so I am a happy seller of future commodities. If prices go down, I do not get hurt—I locked in the price rise and have the right to sell the commodity at the higher price. And so even as prices leave all fundamentals, the producers continue to sell futures contracts to lock in higher prices.

I win, you win, we all win with price appreciation.

Now, to be sure, the whole thing is going to blow up, in what Frank Veneroso calls a commodities nuclear winter. As prices rise, consumption of the commodities falls (as we are already observing) both through substitution and through conservation. At the same time, additional supplies come on line. Real world suppliers feel the imperative to slash prices to have some actual real world sales. They cannot forever live in never-never land with rising prices and collapsing sales.

There are many shoes that will drop, bringing back the Global Financial Crisis with a vengeance. Commodities crash, default by a Euro periphery nation, failure of a Euro bank, or the closure of Bank of America or Citi. All of these are likely events, less than one standard deviation from the mean; probably all of them will happen within the next year.

No matter what the triggering event is, that commodities nuclear winter will happen.

Soon.

Sooner than later.

Five Banks Account For 96% Of The $250 Trillion In Outstanding US Derivative Exposure; Is Morgan Stanley Sitting On An FX Derivative Time Bomb?


The latest quarterly report from the Office Of the Currency Comptroller is out and as usual it presents in a crisp, clear and very much glaring format the fact that the top 4 banks in the US now account for a massively disproportionate amount of the derivative risk in the financial system. Specifically, of the $250 trillion in gross notional amount of derivative contracts outstanding (consisting of Interest Rate, FX, Equity Contracts, Commodity and CDS) among the Top 25 commercial banks (a number that swells to $333 trillion when looking at the Top 25 Bank Holding Companies), a mere 5 banks (and really 4) account for 95.9% of all derivative exposure (HSBC replaced Wells as the Top 5th bank, which at $3.9 trillion in derivative exposure is a distant place from #4 Goldman with $47.7 trillion). The top 4 banks: JPM with $78.1 trillion in exposure, Citi with $56 trillion, Bank of America with $53 trillion and Goldman with $48 trillion, account for 94.4% of total exposure. As historically has been the case, the bulk of consolidated exposure is in Interest Rate swaps ($204.6 trillion), followed by FX ($26.5TR), CDS ($15.2 trillion), and Equity and Commodity with $1.6 and $1.4 trillion, respectively. And that's your definition of Too Big To Fail right there: the biggest banks are not only getting bigger, but their risk exposure is now at a new all time high and up $5.3 trillion from Q1 as they have to risk ever more in the derivatives market to generate that incremental penny of return.


At this point the economist PhD readers will scream: "this is total BS - after all you have bilateral netting which eliminates net bank exposure almost entirely." True: that is precisely what the OCC will say too. As the chart below shows, according to the chief regulator of the derivative space in Q2 netting benefits amounted to an almost record 90.8% of gross exposure, so while seemingly massive, those XXX trillion numbers are really quite, quite small... Right?


...Wrong. The problem with bilateral netting is that it is based on one massively flawed assumption, namely that in an orderly collapse all derivative contracts will be honored by the issuing bank (in this case the company that has sold the protection, and which the buyer of protection hopes will offset the protection it in turn has sold). The best example of how the flaw behind bilateral netting almost destroyed the system is AIG: the insurance company was hours away from making trillions of derivative contracts worthless if it were to implode, leaving all those who had bought protection from the firm worthless, a contingency only Goldman hedged by buying protection on AIG. And while the argument can further be extended that in bankruptcy a perfectly netted bankrupt entity would make someone else who on claims they have written, this is not true, as the bankrupt estate will pursue 100 cent recovery on its claims even under Chapter 11, while claims the estate had written end up as General Unsecured Claims which as Lehman has demonstrated will collect 20 cents on the dollar if they are lucky.

The point of this detour being that if any of these four banks fails, the repercussions would be disastrous. And no, Frank Dodd's bank "resolution" provision would do absolutely nothing to prevent an epic systemic collapse.
...
Lastly, and tangentially on a topic that recently has gotten much prominent attention in the media, we present the exposure by product for the biggest commercial banks. Of particular note is that while virtually every single bank has a preponderance of its derivative exposure in the form of plain vanilla IR swaps (on average accounting for more than 80% of total), Morgan Stanley, and specifically its Utah-based commercial bank Morgan Stanley Bank NA, has almost exclusively all of its exposure tied in with the far riskier FX contracts, or 98.3% of the total $1.793 trillion. For a bank with no deposit buffer, and which has massive exposure to European banks regardless of how hard management and various other banks scramble to defend Morgan Stanley, the fact that it has such an abnormal amount of exposure (but, but, it is "bilaterally netted" we can just hear Dick Bove screaming on Monday) to the ridiculously volatile FX space should perhaps raise some further eyebrows...


The Perfect Storm in a Kondratieff Long Wave Winter


Crashing global stock markets, debt defaults, overproduction, falling prices, tumbling interest rates, global debt deleveraging, and the clear necessity for austerity, they are all classic long wave forces now in full tilt, producing the perfect storm in a Kondratieff long wave winter. Only long wave theory explains the economic and financial events now unfolding daily in the global economy and financial markets.

You still have time to prepare for the final crisis phase and debt collapse, but don’t delay. The global economy is now unequivocally in the final years of the long wave winter debt purge and what will be a sharp decline in corporate efficiency. Once this storm passes the global long wave economic reset button will be tripped, and the new global long wave spring season will begin.

The Russian economist Nikolai Kondratieff was the first to observe and document the remarkable recurring long wave patterns in the global boom and bust cycle, driven by global debt and overproduction. He published his findings in the 1920s. His work anticipated the next downturn that unfolded as the Great Depression. Politicians appear to be incapable of seeing beyond a single election cycle. Politicians have ignored the evidence for the long wave once again. Most economists have as well, although a few are starting to pay more attention as the long wave facts are now difficult to ignore.
Kondratieff
Some of Kondratieff’s original charts indicate just how far ahead of his contemporaries Kondratieff was in understanding the dynamic ebb and flow of international free market capitalism. There are those that claim he only discovered an agricultural commodity cycle. The charts below and his own words suggest he discovered a long wave dynamic cycle that permeates the entire economy and all of society. He wrote, “The long waves, if existent at all, are a very important and essential factor in economic development, a factor the effects of which can be found in all the principal fields of social and economic life.”
Chart 2.3 Kondratieff's Original Charts
Political and monetary policies have exacerbated and magnified the natural long wave forces at work in the global economy and financial markets. The global economy now finds itself in a blinding blizzard in the Kondratieff long wave winter season. Many are unprepared and under the delusion that government intervention can and will save the day. Government meddling only makes matters worse. Investors or businesses that count on government policies to save them will be sorely disappointed. The long wave winter season will run its course and the current perfect storm will shatter the illusions of government as savior of international free market capitalism. Keynesianism will die a merciless death in this long wave winter storm.

Federal Reserve Chairman Bernanke has admitted that he does not understand why the economy has not responded to the aggressive monetary stimulus of lower interest rates and quantitative easing, so now he tries the twist. Bernanke should read Kondratieff and the findings at the System Dynamics program at MIT, which has validated long wave theory. The long wave is the natural cycle of creative destruction in a free market economy; ignore it at your peril.

The long wave turn from winter to spring is just as natural as winter invariably giving way to spring in the natural seasons of the year. Only long wave theory explains the combination of the current economic and financial market conditions, where excessive debt levels and overproduction are now chipping away at corporate efficiency, forcing investor around the world to discount the present value they are willing to pay for future cash flows. Future corporate margins and therefore cash flows are rapidly becoming uncertain as prices received plunge from overproduction funded with too much debt. In short, global financial markets are getting an old fashion haircut, maybe even a buzz cut.

The fact that free market capitalism goes through a long wave rough patch is a natural law of sorts in free market capitalism. Don’t mess with mother nature. The Obama Administration has been shocked to discover that fiscal stimulus has failed to generate the expected jobs. The president should expand his reading list. He is now in line to lose his job along with millions of others around the world. In addition to Kondratieff, the president should put Ludwig von Mises’ Human Action, Adam Smith’s Wealth of Nations, and Bastiat’s The Law, on his reading list. Government should not try to do what only a free market, free trade and individuals in pursuit of purpose are capable of doing. Human liberty and freedom, unhampered by government intervention can achieve great things. It is the only solution to the global problems produced by a long wave winter.

Entrepreneurs, new businesses and innovation in existing businesses are the only viable engines of growth and job creation. Substantially lowering corporate taxes for small business and closing tax loopholes will cause the economy to boom and create jobs. Enterprises funded by government in exchange for their political contributions are destined for failure. The politicians involved in any such bribery and conspiracy with taxpayer funds should be sent to jail. Without free market forces and individual responsibility, and swift and harsh punishment for failure, capitalism will not function correctly. Seed stolen from farmers and planted in winter is doomed to failure. It only harms the real farmers and reduces future crops in their natural season.

On the bright side, corporate profits have held up remarkably well in light of the long wave winter forces in play, a testimony to management and the resilience of free market capitalism in crisis. Profits have been driven by emerging market demand, increases in efficiency, lower interest rates, payroll reductions through layoffs and low wage growth. Business has cut to the bone to deliver profits, and there is nothing left to cut. Unfortunately, the global economy is now in a long wave winter storm. Businesses are facing a global collapse in demand, in addition to political interference and stifling regulation. These forces are idling production and putting extreme downward pressure on prices. The CRB is plunging as overproduction swamps global markets with an excess supply of products and services. The long wave forces in play are now beginning to erode corporate profits.

Global leaders are in shock at the specter of a sovereign debt default that is shaking the global financial system to its core. The hopes pinned on emerging markets are fading fast, as even the economies in China, Brazil, Russia and India cool as anticipated during the long wave winter. The perfect storm is gaining strength. Emerging markets are stumbling; corporate profits will now take a hit when the global economy can least afford it.

The global economy is now in the final crisis years of the long wave winter season that will be cruel to corporate profits. The long wave is essentially at its heart a boom and bust cycle of corporate efficiency produced by human action. The winter season is driven by overproduction, this exists in goods and services, which puts downward pressure on prices received. Prices paid are also falling, but in a long wave winter storm prices received will fall much faster. This occurs when excessive debt and the inevitable debt deleveraging by consumers, businesses and governments is creating a severe decline in demand. The overproduction feeds additional price declines and additional contracting corporate margins.
Corporate Efficiency
The long wave boom and bust cycle of corporate efficiency is eventually recognized by global investors searching for a piece of corporate profits to buy in the form of publicly traded stocks. This is occurring now. Every long wave contains two bull markets and two bear markets. The spring and fall seasons of the long wave of rising corporate efficiency and expanding margins are bull markets, the summer and winter seasons of declining corporate efficiency and declining margins produce bear markets.

It takes a while for investors to catch on. The bear market of the global long wave winter began in the late 1990s in most developed markets. It is now in its final years of rapidly deteriorating corporate efficiency and investors around the world are recognizing the squeeze facing corporate profits. There are other long wave forces at work, but the ebb and flow of corporate efficiency and profits is critical to bull and bear markets. Profits are the mother’s milk of stocks, and the milk production will plunge as this long wave winter storm plays out.

The current bear market will run its course along with deteriorating corporate efficiency. The demand destruction of global debt deleveraging will drive corporate margins and profits lower into the expected long wave bottom of 2012-13. A severe global bear market will take stock markets much lower as corporate efficiency and profits are squeezed into the long wave winter bottom.

If you have never seen a long wave in real data, you have never seen a long-term graph of the U.S. 30-Year long bond. Interest rates are the price of money. During a long wave advance, the demand for money is growing and its price is rising, during a long wave decline, the demand for legitimate uses for money is shrinking and its price is falling. The U.S. long bond is a great proxy for the price of money. The demand for borrowing money and its price is falling.

The demand to borrow money by legitimate borrowers that understand what it takes to earn a dollar, i.e., those that have a chance of paying it back, is declining. They do not want to borrow money at this time. For years, my call for a U.S. 2% 30-Year bond and a 1% 10-Year bond at the bottom of this long wave winter has been in place. I see no reason to change that call now. The low in the price of money will coincide with a low for stock prices from late-2012 to mid-2013. The perfect storm of this long wave winter season is driving the price of money lower. Since Chairman Bernanke has called for low rates into mid-2013, maybe someone showed him this chart. Kondratieff would no doubt have loved this chart, which confirms his theory concerning the dynamic ebb and flow of international free market capitalism is not subject to the vagaries of misguided Keynesian manipulation.
Kondratieff Wave in Interest Rates
The current business cycle is the final business cycle of the long wave cycle. What few investors and traders are aware of is a method of technical analysis that suggests that a Kondratieff long wave divided by 144 produces a miniature long wave cycle, a Wall cycle. There are nine Wall cycles in every business cycle. By tracking these Wall cycles both investors and traders can discover more optimal times to buy and sell to reduce risks and maximize returns. This applies whether they buy stocks for the discounted present value of future cash flows, growth, or just to trade the cycles. Unfortunately, global markets are in Wall cycle number six of the current business cycle. This is a third last and weakest cycle, so prepare for outsized volatility and price declines into the bottom of this cycle.

Investors are panicking, even though global markets are experiencing something as natural as a winter blizzard in January. Before it is over, this global bear market will present investors with the greatest discounted buying opportunities for future cash flows since the early 1930s. Keep much of your power dry; 8-16% dividend yields on great global franchise companies are coming to a stock market near you before the perfect long wave winter storm gives way to a global long wave spring in 2013. Those great buys and dividend yields will be compounded many times over during the coming long wave spring season.

Dollar Index Joining Treasuries in the Smack Down


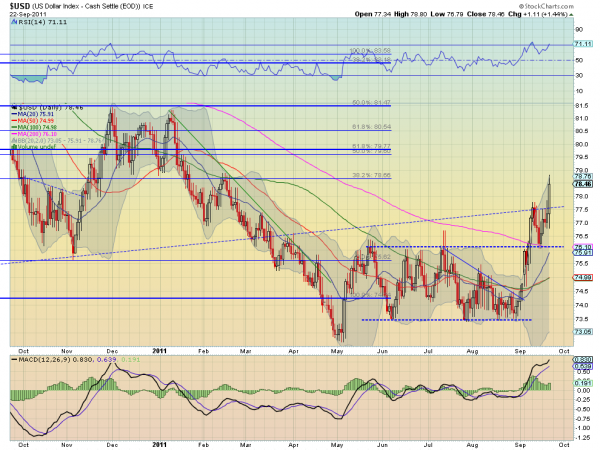
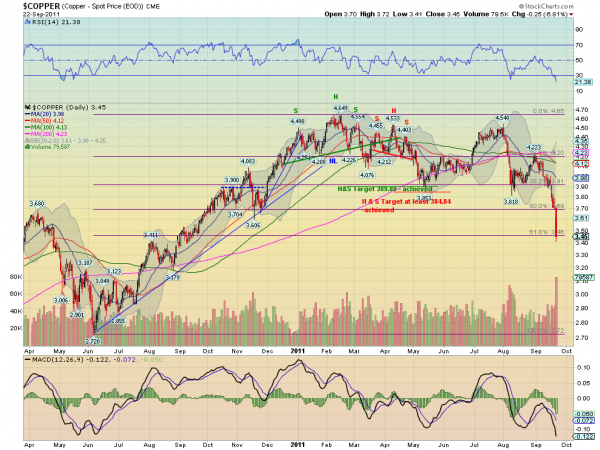
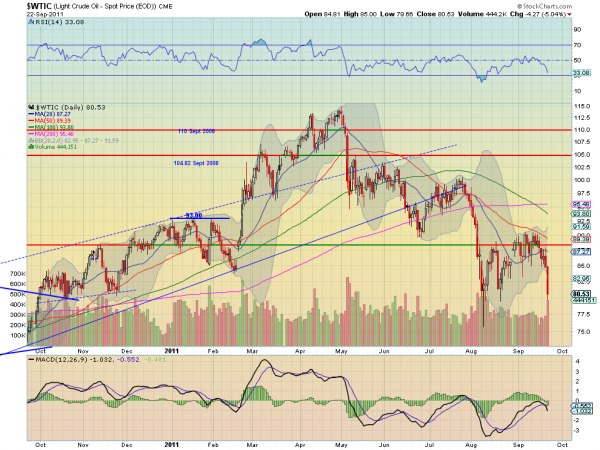
Wednesday US Treasuries ($TLT) delivered a smack down, putting the US Equity Markets ($SPY) and Gold ($GLD) in their place. This was detailed in the link below. Thursday this continued with the US Dollar Index, Copper and Crude Oil taking sides. Let’s take a look.

US Dollar Index, $DX_F

The US Dollar Index ($DX_F, $UUP) was the big winner launching through the 3 year rising trend resistance out of a bull flag. The measured move out of the flag is to 80.10 but it has some resistance along the way at 79, and then 79.28, and 79.60. The rising Relative Strength Index (RSI) and increasing Moving Average Convergence Divergence (MACD) indicator support more upside. Like Rocky Balboa, almost down for the count, it is rising up off the mat to take on the world, joining Treasuries.

Copper, $HG_F

Copper ($HG_F, $JJC), thought by many to be the tell for future market direction, responded with only bad news. Falling through support at 3.69 and now attempting to hold support at the 61.8% retracement of the move higher from June 2010, at 3.46 it’s best hope is that the RSI is becoming oversold. That said the trend is down and the indicators suggest more to come. If it is a market tell then this is not a pretty story to come.

Crude Oil, $CL_F

Crude Oil ($CL_F, $USO) was also a casualty of the recent global moves. It finally broke the bear flag lower, and now sees its next support at 77 and has a target on a Measured Move to 70. The RSI and MACD also point to more downside.

Looks like the new world order, at least for the short run, has been set over the last two days. US Treasuries and the US Dollar are in charge and driving all risk assets and economically sensitive assets lower. Treasuries and the US Dollar up, at the expense of the US Equity Indexes, Gold, Crude Oil, and Copper. Paper promises outperforming hard assets and profitable companies. May God help up.

Gold Swiss Franc pattern

by Kimble Charting Solutions


Bull market leaders on the edge of support ...

by Kimble Charting Solutions


September 20 Commitment Of Trader’s Report

by Macro Story

The COT report for the week ending September 20, 2011 shows copper still setting up for further weakness while oil looks flat and the 30 year yield possibly due for a move higher. Most interesting are the moves in the USD.

Copper: Finally after sounding like a broken record copper has broken to the downside. Commercial net has been signaling this move for a while and in fact had to readjust over the summer as copper remained stubbornly high in price. Interesting to note even with the current weakness in copper commercial net has in fact gone net long (buying copper into lower prices) signaling even further selling to come.
Oil (WTI): Oil looks poised to remain slightly pressured to range bound. No major change to report from this week’s report.
Long Bond: Based on a slight reduction in net short positions for commercial accounts it appears the 30 year yield may in fact move slightly higher over the coming week.
US Dollar: Very interesting changes in position for both non reporting (retail) and commercial accounts. The USD did break out of a multi-month trading range this week and has broken through multi-year resistance. Below are two charts, the first shows how commercial net moves relatively to the USD (i.e. they short or sell into strength). The second chart shows how commercial and non reporting move inverse to one another.

USD VS Commercial Net - notice the massive divergence signaling a major move higher in the USD is highly probable or at least anticipated by commercial net.
USD Commercial VS Non Reporting – Notice the extreme changes to positions for both. The non reporting scale on the chart below is inverted to show the correlation. Although easy to dismiss this as a USD selloff is pending as retail is massively net long it is important to note that commercial net is supporting a move higher in the USD.

Value Trading


It appears that in academic hindsight the markets have ruled out Door # 3 and moved onto the remaining outcomes; either continuing down the slope of hope or meeting the requirements of a successful retest of the early August lows.

Considering we are sitting at the bottom of the range, my confidence, with regards to pulling up to the trough and buying stocks more aggressively here - has risen commensurate with the declines. As I have maintained since the early August lows, I still hold the overarching opinion that equities will continue to be forgiving with tactical purchases on the long side of the ledger. This posture towards equities has been maintained, because I believe that although the range has been wide, it will drift higher over time. I believe to some degree you can use the 1987 crash analog as a general impression on what to expect in the coming months.

I will continue to average into a position if and when I have been early; almost in the style a value investor approaches an asset class - just with tighter timeframes and through the window of technical analysis and not fundamental analysis. The analogy works for my style, because like a value investor, I do a rigorous study of a given market, feel a level of confidence towards the respective outcome - then start building a position around that expectation. This method is unconventional with trading shorter time frames in the sense that if my market expectations were off the mark - it would compound the positions losses, very much like a value trap. Fortunately, I continue to be close enough with my respective timing and the market maintains its considerable inertias - that I have been on the right side of the trade when I exit. Trading is typically not this complex, either from a research and timing perspective or the amount of trend reversals you need to stomach to profit from a trade. But for a seasoned and professional trader - there is no trading environment better for outsized gains if you continue to ride the volatility, are well capitalized and have done your research. With that said, this market is extremely dangerous for those a step or two behind, or unwilling to commit capital through volatility. It is no market for the inexperienced or weak handed trader.

My returns this year have been atypical in the sense that I do not expect to maintain the degree of profitability that I have enjoyed year to date. With that said, I try not to set specific goals with regards to my ROR, because I firmly believe it causes you to chase those expectations.

In athletics it is often said, "go for an inch and you will get the yard." It applies very nicely to trading as well.

My bottom line has always been a direct result of my own research and how I perceive the markets to function in the near to intermediate time frames. In trading environments such as these when you need to be proactively positioning and confident to withstand the volatility, it is the difference between getting bled by a thousand cuts - or holding firmly to a realized return. As always, it is much easier said than done and only comes with experience through loosing capital in different market environments and finding your own respective edge and rhythms. As a general rule, and because of the nature of this strategy, I do not use external margin on my account. I like leverage intrinsically built into the positions - so the leverage ETF products work very well for me. I described a bit of that dynamic in a note in April - Waiting on a Train.
"In the right desensitized hands they are outstanding tools for capturing a trading thesis over the near to intermediate terms. Many traders bleed themselves to death and second guess their research by entering and exiting a trade several times before the market turns. It can be death by a thousand cuts and quite confusing to navigate.

In a trading and media environment that is so heavily dominated by the approach of high frequency trading, "cut your losses quickly" can at times preclude you from missing the train entirely. It is often prudent advice to follow in the typical continuation or trading range environment.

However, when it comes to extreme market action, there is an exception to the rule."
Most traders should never use these trading vehicles for a variety of reasons. Stick with the plain vanilla ETFs. But over the years since they were first introduced, I have learned to appreciate their utility - even in markets environments such as today. Position sizing and averaging in and out is a must when trading these very volatile instruments.

Why did Gold and Silver Plunge? No, It's Not CME Margin Hikes; What will the Fed do Next?

by Mike Shedlock

Many people have asked me to comment on the plunge in gold and silver. First let's take a look at the wrong answer: Case Closed: CME Hikes Gold, Silver, Copper Margins
And there you have it: CME just hiked gold margins by 21%, silver by 16% and copper by 18%. Mystery solved.
Sorry Tyler, wrong answer.

Four Reasons for Metals Plunge

  1. Fed did far less than expected
  2. Mutual fund redemptions
  3. Margin calls at hedge funds
  4. China growth story fading

1. Fed Did Far Less than Expected

The Fed did not do what everyone thought, which is to say something far more than "Operation Twist".

As noted in advance, I explained why the Fed wouldn't do more than Operation Twist, in Six Things the Fed May Announce Tomorrow (But Likely Won't); Would Any of Them Matter? Gaming the Reaction.

In short, the Fed did not print, or even threaten to print. Moreover the Fed committed to a strategy not through the end of this year, but all the way through June of 2012. Perhaps the Fed does more in the interim, perhaps not.

For those expecting drama, the Fed's non-action was decidedly bearish for commodities in general, even gold.

2. Mutual Fund Redemptions

Mutual fund cash levels are at or near record lows. In general, mutual funds were not prepared for the market selloff and sell orders came in. Rather than sell garbage like Bank of America at $6, mutual funds unloaded stuff like gold, taking profits.

3. Margin Calls at Hedge Funds

Hedge funds unloaded gold and silver for the same reasons as mutual funds, but also because they mistimed the play and what Bernanke would do. Leverage works both ways.

4. China Growth Story Fading

Commodities in general have been clobbered along with currencies of commodity producing countries because the global economy is slowing rapidly.

As in 2008 there will be no decoupling. China is not a growth engine in any real sense of the word. Instead, China desperately needs demand from the US and Europe. Moreover, China is overheating and has a huge property bubble to boot, at precisely the wrong time. Commodities were set to plunge on the China story alone.

Metals Volatility

In the wake of increased volatility related to the above, the CME hiked margins. That likely added to the volatility but was not a fundamental "cause" of the plunge in precious metals.

What will the Fed do Next?

"Bay of Pigs" asks ...

Mish, Any thoughts on what the FED will do next? I doubt they sit there and do nothing.

Thanks Bay. That was a good question. This is why:

1. It is a single question, not five questions
2. It is a question on topic
3. It is a question I have not explained 10 times already
4. It is macro-based, not stock specific
5. It seeks an honest opinion rather than asking for something that may take hours of research


Problems for Bernanke

Market expectations were clearly for the Fed to do more. Goldman Sachs was shocked at the market reaction, I was not. See Goldman Surprised by Reaction to "Operation Twist" for details.

The problem for Bernanke is every action he may take now has serious negative ramifications. Fort example, take Operation Twist: The flattening of the yield curve may (I doubt it) help mortgages by lowering mortgage rates. However, the flattening of the yield curve will without a doubt hurt banks struggling to make profits on spreads.

The flattening of the yield curve also hurts those on fixed income as well as pension plans with 8.5% or so yield assumptions. The irony is pension plans might have gotten big returns had they been in treasuries, but they weren't because treasury yields were "too low".

Instead, pension plans all plowed into foreign bonds, commodities, currencies, and global equities to make their 8.5% assumptions.

So what is Bernanke to do?

See Bernanke, a Complete Dunce, "Puzzled by Weak Consumer Spending" for more on how the self-proclaimed student of the great depression is clueless about the current depression.

Bottom line: The Fed is more or less out of bullets. Moreover, Bernanke admitted he does not know why his policies are not working even though it is perfectly obvious.

When backed in a corner, Bernanke may conceivably try nearly anything. However, Bernanke is just not that desperate yet. Right now, European banks are at far greater risk than US banks so Bernanke may easily bide his time.

Silver Daily Chart

Silver, once again, is acting more like a leveraged commodities plaything than a currency.


I traded all my silver for gold on April 27, as noted in Taking Silver Profits - Swapping Silver for Gold.

Gold is still higher than my swap point.

At the time, I commented "I believe the price of silver is highly likely to revisit the low $20's at some point. Thus, I see no point in chasing silver higher here. Moreover, except for pure speculation, I see little reason to even hold silver in this spike."

I really do not know if silver hits the low 20's or not, but I was not tempted by that previous decline to near $32. Had I bought it there, I made a mental sell at $40. Silver got all the way to $44 and to be honest I was wondering if it would take out my swap point.

Silver breached $30 today.

As I have commented many times, silver is a far riskier play than gold. I believe this volatility proves my point.

CME margin hikes are not a cause of 40% collapse in silver from the top.

No Hiding Places

On September 19th I wrote No Hiding Spots Except Despised US Dollar: Equities Red, Metals Red, Energy Red, Grains Red
No Hiding Spots Except Despised US Dollar

If you have not done so already done so, please consider the possibility there will be no hiding spots except for US dollars and short-term US treasuries (yielding nothing) in a renewed strong downturn.

I expect gold to hold up in a major decline, but I could easily be wrong. One encouraging sign is the $HUI gold miner index is down less than a percent even though gold is down by 2% and the S&P and Dow are down by almost 2% as well.
Short-term, I have been wrong about gold holding up. Then again, I really do not concern myself with short-term action. Moreover, gold is higher than it was the day I swapped it. The equity markets in general sure are not.

Bernanke Will React

It's a safe bet Bernanke will react, we just do not know when. Things may (or may not) get ugly for miners (especially silver) in the meantime.

Those with cash, should be rooting for a selloff in gold and miners. In the meantime, hold a core position in gold. Take profits on big spikes and buy big dips.

At some point that advice will stop working, I just do not think this is the time.

Has Operation Twist Played Out Already? Time to Short Bonds?

by Mike Shedlock

Curve Watchers Anonymous notes a reversal in US treasury yields today, with the yield on the long end of the yield curve rising sharply as show below.


Has Operation Twist Played Out Already?

Recall that the Fed's goal in "Operation Twist" (selling the short end of the curve and buying the long end) was supposed to drive down long term rates.

Yield Curve as of 2011-09-23


Time to Short Bonds?

Today, yields on the long end of the curve rose, as shown above. Inquiring minds may be wondering if it's time to short bonds.

The short-answer is "No it's not, but that does not mean buy them either".

30-Year bonds are now approaching all-time lows. Should that happen, and I now expect it to (that is a reversal for me), the bond-bull market never ended no matter what duration you measure the bull market by.

However, much of this trade was front-run. Nearly everyone assumed the Fed would announce Operation Twist, so now we are in a potential "sell the news" situation. If so, it may have started today.

However, the global economy is fading fast. That is supportive of more government bond purchases as a safe haven.

I see no edge to buying or shorting the long end of the US treasury curve here. Sometimes the best thing to do is nothing. To be sure, bond bears have been taken out to the cleaners and I warned about that in advance.

See the original article >>

Follow Us