Tuesday, July 23, 2013

Apple Beats On Stronger iPhone, Weaker iPad Sales; Cash Grows To Record At Slowest Pace In Three Years

by Tyler Durden

Here are the highlights:

  • Q3 Revenue of $35.32 billion beats expectations of $35.04 billion; This compares to $35.0 billion a year ago, or the firm barely posted a revenue increase this quarter - the first time in years
    • sees Q4 revenue of $34-37 billion, Exp. $36.97 billion;
  • Q3 EPS of $7.47, Exp. $7.31
  • Q3 Gross margin of 36.9%, Exp. 36.7%; Sees Q4 margin of 36%-37%
  • iPhone sales of 31.2 million, Expected 26.1 million
  • iPad sales of 14.6 million, Expected 17.4 million
  • And since margin did not reflect a pick up in iPhone sales, sure enough the Q3 iPhone ASP was $581, vs Expectations of $597
  • AAPL total cash and investment rose to a record $146.6 billion up from $144.7 billion, however the sequential growth of "only" $1.9 billion was the lowest since March 2010

And on those news the stock is up some $15 after hours: hardly representative of the epic upward moves in days gone by.

What is the upside? This:

“We are especially proud of our record June quarter iPhone sales of over 31 million and the strong growth in revenue from iTunes, Software and Services,” said Tim Cook, Apple’s CEO. “We are really excited about the upcoming releases of iOS 7 and OS X Mavericks, and we are laser-focused and working hard on some amazing new products that we will introduce in the fall and across 2014.”

If this was a Steve Jobs quote, the promise alone would be good for 10%. Now... not so much.

And the results in chart format.

Revenue:

Margin:

Component breakdown:

Cash:

See the original article >>

China Maneuvers To Take Away US' Dominant Reserve Currency Status

by RUSS WINTER

“All warfare is based on deception.” – Sun Tzu, “The Art of War” (500 B.C.)

“The message of this initiative is for China to consider whether or not China would open up its banking system and allow the strongest currency in the world, which is the Chinese yuan, to be the rightful and anointed convertible currency of the world.” – Thailand Deputy Prime Minister Olarn Chaipravat in an interview with Bloomberg

“An international monetary system dominated by a single sovereign sovereign currency has intensified the concentration of risk and the spread of the crisis.” — People’s Bank of China (2009)

It should go without saying that China and Russia have designs to end the U.S. Dollar hegemony free ride. This is fundamental to understand and will be a game changer. The impacts on the standard of living of these players will be profound and especially negative for the U.S. How and in what manner this plays out is the question. I strongly believe that the answer lies in two parts: letting the U.S. put a noose around its own neck and then at the appropriate time, kicking the chair out from under it.

The first part of the operation is now advanced and is described below. The second part involves China and Russia preparing its relative currencies to be accepted in lieu of dollars. It means making the yuan and ruble at least equal to, if not superior to, American dollars in world trade. As you can imagine, the U.S. — a country with a debt-to-GDP ratio approaching 110% — can ill afford this sort of challenge to its status as a reserve currency.

China has already advanced the Yuan as a principal exchange currency by incorporating a series of deal with other countries. Such arrangements are hardly mentioned by U.S. financial media, but they are going on constantly. So far, the People’s Bank of China (PBOC) has signed nearly 2 trillion yuan worth of currency-swap deals with 20 countries and regions, including Hong Kong. Here’s a breakdown of happenings:

I suggest that the kicking the chair out from USD hegemony involves at least partially backing the Yuan, and Ruble for that matter, with gold. China’s reserve assets were 30.2% of the world total at the end of last year. How much of this is already in gold?

China is secretive about the number, I think it’s because it had some catching up to do and it’s incorporating Sun Tzu-style principles, namely deception. The last time China revealed its gold reserve levels was in 2009 at 1,054 tonnes, which caught the market by surprise.

Another reference point is that China’s foreign exchange reserve increased from $2.2 trillion in 2009 to $3.4 trillion today. During that period, U.S. dollar reserves held by China fell from 69% to 54%.  If only 10% of that $1.2 trillion increase went to gold, then let’s see … At an average price of $1,200, that would be nearly 3,000 tonnes, bringing China’s total gold holdings up to 4000 tonnes. Conventional wisdom would point to between 3,000 and 4,000 tonnes. The U.S. supposedly has 8,133 tonnes in its reserves. Russia has doubled its gold reserve in four years.

China’s mines produce an average of 350 tonnes per year. During the last four years, it has produced 1,400 tonnes. Certainly, its domestic production went toward its reserve. Production estimates for 2013 are 440 tonnes. It should be noted, however, that from 2002 to 2009 China had produced approximately 1800 metric tonnes of gold, which strongly suggests that its figure of 1,054 tonnes for 2009 is understated and deceptive, maybe by a factor of two to three times.

Between 2011 and 2012, imports into China via Hong Kong surged to a total of 950 tonnes. Some, but possibly the majority of this ended up in gold reserves. Furthermore, no one talks about “illegal” gold imports smuggled into China, which may add to the total.

?

This year, the gold grab has reached entirely new levels, no doubt just one of the “unintended consequences” of the gold short attack in the paper “market.” In the first five months of this year, China imported more than what it did for all of 2011, or 525 tonnes.

Another incredible number is the volume of ounces transferred out of the London bullion market (LBMA) in May. That month alone it increased to 28.2 million ounces. To put that in perspective: 28.2 million troy ounces translates into 877 metric tonnes of gold. The amount of physical gold delivered year to date on the Shanghai Gold Exchange is 1,198 tonnes. Again, it’s much more than one would expect of the appetite of institutions, banks and individuals. The “Chinese granny” investor story is overplayed and may be a bit of a decoy. Much of this are PBoC and their proxies.

In 2009, a Chinese state council adviser known simply as “Ji” said that a team of experts from Shanghai and Beijing had set up a task force to consider expanding China’s gold reserves. Ji was quoted as saying, “We suggested that China’s gold reserves should reach 6,000 tons in the next three to five years and perhaps 10,000 tons in eight to 10 years.”

The numbers I’ve cited are consistent with China easily reaching the Ji gold holding of 6,000 tonnes this year. The kind of withdrawal numbers being reported out of the LBMA, Comex and GLD (418 tonnes YTD) suggest that the PBOC through it’s proxy, the State Administration of Foreign Exchange (SAFE), is involved in a physical gold raid of such magnitude that the 6,000-tonne target has been left in the dust. The great gold sale has facilitated a push heading closer to 10,000 tonnes.

More importantly, as long as gold prices remain suppressed, China will continue to be a large-scale buyer. Perversely, if gold prices remain low, it will serve to accelerate the timeline for China to take down USD reserve currency hegemony. The U.S. can ill afford a China gold reserve buildup of 1,000 tonnes or more a year, let alone raid 2,000 tonnes and at cheap prices.

Meanwhile, China reportedly is progressing well on its ambitious plan to recast large gold bars into smaller, 1-kilogram bars on a massive scale. The big gold recast project points to the Chinese preparing for a new system of trade settlement. In the process, they are constructing a foundation for a new gold-supported monetary system that will give them advantages to their trade payments.

Finally, higher gold prices are necessary if the U.S. wants to curb China demand and prevent an emperor-wears-no-clothes scenario on the home front. You see, once yuan becomes a currency fully backed by gold, the next logical step will be not just domestic but international pressure on the U.S. and others, like Germany, to lift the iron curtain and reveal whether the gold they claim backs their currency really exists. Then get ready for all hell to break loose.

See the original article >>

China: The Biggest Bubble Builder By Skyscraper?

By Tyler Durden

It appears reality is hitting home in the property bubble capital of the world. The so-called "Skyscraper Index" continues to show an unhealthy correlation between construction of the world's tallest building and an impending financial crisis - for example, New York 1930; Chicago 1974; Kuala Lumpar 1997, and Dubai 2010.

As The Dubai Chronicle reports, the record-breaking Sky Tower in Changsha, China, has seen its budget surge from $625 million to $855 million and completion dates pushed back to April 2014, after originally being scheduled for completion at the start of 2013.


As Barclays notes, often the world's tallest buildings are simply the edifice of a broader skyscraper building boom, reflecting a widespread misallocation of capital and in impending economic correction.

(click image for large legible version)

Investors should therefore pay particular attention to China - today's biggest bubble builder with 53% of all the world's skycrapers under construction - and India - which with just two completed skyscrapers, now has 14 skyscrapers under construction.

Source: Barclays

Mark Thornton on the Skyscraper Index...

Skyscraper Index

Skyscraper Index

See the original article >>

Local banks still weighed down by commercial real estate

by SoberLook

While the media and politicians have been focused on large commercial banks and their activities, it is often the smaller US banks that continue to struggle with capitalization and stressed/distressed assets. A big part of the issue with small banks is their outsized exposure to commercial real estate. At its peak, nearly 30% of small banks' balance sheets consisted of loans backed by commercial property. Large banks peaked at 11%.

Source: FRB

Large banks have since reduced (as % of assets) their commercial real estate exposure by 35% (from the peak), while small banks have cut it by 24%. As far as their non-performing real estate-backed loans, the bigger banks have largely cleaned up that portion of their balance sheets while many regional and smaller banks have kicked the can down the road. And numerous loans that were restructured in 2011 and 2012 are once again delinquent. The chart below shows the evolution of troubled loans at small and regional banks.

Small and regional banks' real estate backed assets ($bn)

Compared to the money center banks, regional and local banks have a long way to go to resolve their commercial real estate problem.

See the original article >>

Sell the Gold Rally?

By Jeff Macke

Gold is pushing higher again this morning, tacking on big gains for those intrepid souls who bought the most recent panic lows. The yellow metal is trading back over $1,300 an ounce, having gained just more than 10% since bottoming near $1,200 in late June.

The question for investors and speculators alike is if gold has at long last marked the end of a wrenching nearly two-year pullback from the 2011 highs over $1,900. Lee Munson of Portfolio LLC says any rally marks a chance to make a graceful exit from their positions.

"Investors are confusing the fact that [gold] holds its value super long, hundred-year periods of time versus inflation versus making actual growth," Munson says in the attached video. "It just holds its value. That's not a reason to hold anything."

Of course the hardcore buy and hold gold players will lose their minds over Munson's characterization. Buyers of the SPDR Gold Trust ETF (GLD) have been handsomely rewarded over the last eight years, easily outperforming the major market indices. Munson is quick to point out that "long-term" doesn't mean buying the lowest point of the last decade. It means holding gold over decades.

By that standard gold doesn't do as well. Since 1940 adjusted for inflation the only period over which gold has outperformed stocks is 2000 - 2010; and that lead is slipping fast. History suggests gold is extremely volatile in shorter terms but dramatically lags U.S. equities for the truly committed gold enthusiasts.

Those who quibble with that analysis, parsing the numbers to maximize the apparent returns of gold versus stocks are missing the point. Gold has worked over shorter periods as a speculative vehicle but the die hard goldbugs have seen minimal returns at best and dramatically underperformed stocks.

Munson has simple advice for gold investors enjoying the terrific rally from the recent lows. Sell. "Exit out of the trade. Get serious. Get real."

See the original article >>

Palast: Did Fabulous Fabrice Really Cause the Financial Crisis

by Jesse

Here is a reminder from Greg Palast, who is one of those rarest of creatures, the investigative journalist, about what caused the last financial crisis, and the source of the criminogenic environment that is likely to be a major contributing factor to the next.
The Banks must be restrained, and the financial system reformed, with balance restored to the economy, before there can be any sustainable recovery.

"...In August 2007, hot-shot hedge fund manager John Paulson walked into Goldman Sachs with a brilliant plan to cash in on the US housing crisis.
He paid Goldman to announce that Paulson would invest a big hunk of his fund's wealth, $200 million, in securities tied to the US mortgage market’s recovery. A few lucky investors would be allowed to give Goldman their billions to bet with Paulson that Americans would not default on their home mortgages.
It was a con. Secretly, Paulson would bet against the mortgage market, hoping it would collapse – making sure it would collapse. All he needed was Goldman to line up the suckers to put up billions to be his "partners".
It was Goldman’s and Paulson's financial version of Mel Brooks' The Producers, in which a couple of corrupt theatre producers schemed to suck investors into a deliberate flop...
What did the Feds do to Paulson? He received... a special tax break.
Am I defending the Fabulous Fabrice, the French-fried scapegoat? After all, he was just along for the ride. But he was deeply thrilled to carry water for the Bad Boys. And the charges against him are merely "civil", meaning he won't get jail time even if found guilty.
And what about Goldman, whose top brass knew of the entire game? The Securities and Exchange Commission did fine Goldman for its duplicity – a sum equal to 5 percent of the cash Goldman got from the US Treasury in bail-out funds.
After Goldman’s con became public, its CEO, Lloyd Blankfein was hailed as a visionary for offloading mortgage-backed securities before the shit hit the finance fan. Blankfein hailed himself for, he said, "doing God's work". God did well. Blankfein’s bonus in 2007 brought his pay package to $69 million for the year, a Wall Street record.
Rather than prison or penury, Blankfein was appointed advisor to Harvard University’s business and law schools.
So here’s the lesson all Harvard students are taught: If you can't do the time, don't do the crime... unless your booty exceeds a billion."
Read the entire piece by Greg Palast here.

"But what it's led to is this sense of impunity that is really stunning and you feel it on the individual level right now. And it's very very unhealthy, I have waited for four years, five years now to see one figure on Wall Street speak in a moral language.
And I've have not seen it once. And that is shocking to me. And if they won't, I've waited for a judge, for our president, for somebody, and it hasn't happened. And by the way it's not going to happen any time soon, it seems."


See the original article >>

Apple Earnings Trade Ideas

by Greg Harmon

aapl

Apple reports tonight as well. Heading into the report it had completed a bullish Gartley and retraced 61.8% of the pattern before failing. This was at the confluence of the 50 and 100 day SMA’s and makes the 435 level very important. The RSI is drifting lower after barely crossing the mid line, not getting bullish and the MACD is leveling on the signal line with the histogram falling. This all gives a bias lower. There is support at 416-418 and then at 385-390. Below that there is noise until the 340-345 area for next real support. Resistance higher over 435 is found at 454 and then 463 before 477. The reaction to the last 6 earnings reports has been a move of about 5.43% on average or $23 making for an expected range of 400 to 446. The at-the money July weekly Straddles suggest a slightly smaller $20 move by Expiry Friday with Implied Volatility at 61% above the August at 30%. Some sizeable weekly 460/470 Call Spreads have traded on the offer side and the largest Open Interest this week is at the 400 Put by over 2:1 on any other strike, but similar at the 440 and 460 Calls.

See the original article >>

China’s End of Exuberance

by Michael Spence

MILAN – China’s growth has slowed considerably since 2010, and it may slow even more – a prospect that is rattling investors and markets well beyond China’s borders. With many of the global economy’s traditional growth engines – like the United States – stuck in low gear, China’s performance has become increasingly important.

This illustration is by Paul Lachine and comes from <a href="http://www.newsart.com">NewsArt.com</a>, and is the property of the NewsArt organization and of its artist. Reproducing this image is a violation of copyright law.

Illustration by Paul Lachine

But now growth rates for Chinese exports and related indices in manufacturing have fallen, largely owing to weak external demand, especially in Europe. And the Chinese authorities are now scaling back the other major driver of their country’s growth, public-sector investment, as low-return projects seem to generate aggregate demand but prove unsustainable fairly quickly.

The government is using a variety of instruments, including financial-sector credit discipline, to rein in investment demand. Essentially, the government guarantee associated with financing public-sector investment is being withdrawn – as it should be.

But, to circumvent the restrictions in the state-dominated financial system, a shadow banking system has developed, raising new risks: economic distortions; reliance on excess leverage to drive growth in the consumer, real estate, corporate, and government sectors; and dangers associated with inadequate regulation. As a result, investors are worried that China could slip into the excess-leverage growth model that has served many developed economies so poorly.

Much has been made of domestic consumption as a driver of Chinese growth in the future. But Justin Lin, a former World Bank chief economist, has argued forcefully that investment will and should remain a key growth driver, and that domestic consumption in China’s growth pattern should not be pushed beyond its natural limits into a high-leverage model based on rising consumer debt.

That seems right. The risk is that Lin’s warning will be interpreted as an argument for sticking with an investment-led model, which would imply more low-return public-sector projects and excess capacity in selected industries. The right target for generating growth is domestic aggregate demand based on the right mix of consumption and high-return investment.

Analysts and investors have at least two related concerns. One is that, facing declining growth, policymakers will resort to excess investment or leverage (or both), creating instability. The other is that they will resort to neither, and that no alternative growth engines will have been started, leading to an extended slowdown with unpredictable political consequences at home and serious economic consequences abroad.

In short, many investors are nervous because China’s future growth story is unclear to them. It is certainly less clear than the previous story, which cannot be retold.

There is no real way to allay these concerns quickly. Only time, implementation of the policy and systemic reforms to be revealed this fall, and actual economic performance will settle the matter one way or the other.

The shift in the growth pattern, if successful, will occur over several years. So, what one should be looking for is movement in the right directions, which are fairly clear. 

One is a shift in comparative advantage. Rising incomes require rising productivity. That means increasing capital and human capital intensity across both the tradable and non-tradable sectors of the economy.

On the tradable side, one should look for structural change and a shift in output to higher-value-added components of global supply chains. Here, innovation and the conditions that support it – including competition and free entry and exit from the market – play an important role. If policymakers choose a model based on a large state-dominated sector protected from internal and external competition, innovation objectives are unlikely to be met, adversely affecting future growth.

Meanwhile, the non-tradable side should grow. As China becomes richer, its middle-class citizens will not just buy more tradable goods like cars, electronics, and appliances; they will buy housing and a host of non-tradable services, too. An efficient supply-side response to this large and growing source of demand requires regulatory reform in many services, including finance, product safety, transport, and logistics.

But households still control too little income and save at very high rates. The control of income by the overlapping corporate and public sectors makes it easier to push the investment-led growth model to the point of low (or even negative) returns. So the entire fiscal system is a crucial item on China’s reform agenda, especially management of public capital.

Fiscal reform will determine many things: the components of domestic income and demand that will drive structural change on the supply side, the allocation of income and expenditure across levels of government, and the embedded incentives that this allocation implies. Outside of China, this part of the reform agenda is the least well understood.

Moreover, social services and social security will need to be strengthened in order to reverse a pattern of rising inequality. Beyond that, more inclusive growth depends on the completion of the urbanization process that underpins the creation of a modern economy; addressing corruption and unequal access to market opportunities; and aggressively mitigating well-known and serious environmental problems.

With significant elements of the global economy and external demand facing headwinds, China’s acceptance (so far) of a growth slowdown, while its new growth engines kick in, is a good sign, in my view. It suggests that policymakers are playing for longer-run sustainable growth and have become warier of policies that, if used persistently, amount to a defective, unsustainable growth model.

Watching for progress on these key elements of structural change and reform seems to be the right stance. If markets are confused or pessimistic about China’s longer-term agenda, but if the direction of structural change and reform is positive, there may be investment opportunities that were absent in the more exuberant recent past.

See the original article >>

Obama's Economic Report Card

by Lance Roberts

In a recent Politico playbook posting the following paragraph caught my attention:

"POTUS last night, at an Organizing for Action dinner at the Mandarin Oriental: "Galesburg is where I gave my first big speech [June 2005] after I had been elected to the United States Senate. It was the commencement at Knox College, and it was a speech about the economy. ... And all these trends that had been taking place were visible at the time -- rising inequality, struggles in the middle class -- but they were papered over to some extent by the bubble. And by the time I took office, the bottom had fallen out. ... [O]ver the last five years,... because of the grit and resilience and determination of the American people, we've been able to clear away the rubble and get back to where we were."

First, let me just point out that the President of the United States is not really solely responsible for where we are economically.  The condemnation, or praise, must be applied equally to all branches of government responsible for the fiscal and monetary policy decisions made.  The problems that exist today were not due to just the last few years of excess but rather come as a result of more than 30 years of fiscal irresponsibility that spans both Republican and Democratic Administrations alike.

However, since President Obama has taken the position of responsibility for "clearing away the rubble and getting us back to where we were", we can review the economic data to see whether, or not, this is indeed the case.  Have continued bailouts, financial stimulus and the myriad of other financial supports gotten the U.S. economy back to where it was in 2009?  In order to answer this question for yourself, and grade Obama's success relevant to his statement, we will look at major aspects of the economy from full-time employment, incomes, home ownership and household net worth.

Full-Time Employment (Grade F)

Full-time, benefit providing, employment is the only type of employment that matters for the average American.  Full-time employment allows for an increasing standard of living, household formation, and higher personal savings rates.  The 2-panel chart below shows the total increase in full-time employment relative to the working-age population and the net increases in full-time and temporary employment since 2009.

Employment-Full-Part-2Panel-072313

Since 2009 there has actually been very little increase in full-time employment.  What is often overlooked in monthly employment numbers is that the working age population has been growing faster than total employment. This has led to a coincident surge in welfare dependency, as represented by "food stamp" usage, as those they are forced to work part-time, or are just unable to find work, seek alternative measures to make ends meet.

Incomes (Grade F)

For the average middle-class American that is primarily focused on working, paying their bills and raising their respective families, nothing is more sacred or valued than their paycheck.  The problem has been that a weak economic environment, combined with a large and available labor pool, has suppressed wage growth and, ultimately consumption.  This has been further fostered by a drive by businesses to boost profitability by suppressing wage growth through increases in productivity.

Wages-Savings-Consumption-072313

The failure of wages to keep pace with the real costs of living has put pressure on personal savings rates.  Lower savings rates ultimately reduces future productive investments and consumption. The "feedback loop" is critical since the roughly 70% of the U.S. economy is driven by personal consumption.  Slower rates of consumption drags on economic growth, which suppresses employment and wages.  It is a "virtual cycle" that is very difficult to break.  The chart below shows the high correlation between economic growth, savings rates, wages and consumption.

Wages-PCE-Savings-GDP-072313

The current trends suggest, despite much commentary to the contrary, that economic growth is beginning to flag.  However, as I stated previously, this is not a problem that is specific to the current Administration, but an ongoing deterioration of economic growth caused by the accumulation of debt, and deficit spending, that began in the 1980's.

However, the most important reason why the current Administration fails on incomes is clearly shown in the chart below which shows the amount of social benefits (welfare) as a percentage of real disposable incomes.

Social-Benefits-DPI-072313

Since the onset of the financial crisis government dependency has soared, and remains, near the highest levels on record.  Despite the Federal Reserve's artificial inflation of asset prices, which only benefits roughly the top 20% of Americans that have investible assets, the bulk of the America is becoming more dependent on "handouts" to make ends meet.   This is not a sign of a return back to where the average American was prior to the onset of the financial crisis.

Home Ownership (Grade F)

One of the signs of economic prosperity is a rise in home ownership.  As employment increases, incomes rise and economic growth strengthens; individuals tend to form households, have children and buy homes. The chart below shows the current levels of home ownership in America.

Housing-Ownership-Renters-072313

With home ownership now at the lowest levels since the 1980's it is hard to suggest that the economic policies of increasing debt levels, higher levels of government dependency and ongoing bailouts have done much to improve the "American Dream."  More importantly, policies to artificially suppress interest rates and encourage housing speculation has led to a nation of renters rather than homeowners.  The question becomes who is going to buy homes from the speculators when they all rush to the market to sell?

Household Net Worth (Grade C)

There really is no better measure for grading the success, of failure, of an Administrations economic policies other than household net worth.  The following chart shows household net worth which has been inflation adjusted using the consumer price index.

Household-NetWorth-072313

After every previous post-WWII recession household net worth has exceeded its previous peak within 3 years.  While household net worth has had a significant recovery it has primarily been contained within the top decile of the population.  Despite, the ongoing inflation of both the real estate and financial markets - real household net worth remains significantly below its previous peak.  For the average American who struggles with employment, stagnant wages and a home that has little, or no, equity in it - there has been little recovery to speak of.

More Than Just Data

There is no doubt that the current Administration walked into a horrible situation.  It is only an assumption that anyone could have handled the situation any better.  However, the same can be said for the previous Administration that was served an economy falling into recession, racked by financial scandals and a terrorist attack all of which were fostered by failed policies of previous administrations.

However, a real economic recovery must be more than just a data point.  Much ink has been spilled in recent years both praising, and condemning, the current administration for their policies.  It will only be in hindsight that we truly know whether the massive increases in government debt, government bailouts, and financial supports, not only domestically but globally, will truly lead to a stronger and more prosperous economic environment.  While hopes are high that this will indeed be the case; centuries of history suggest otherwise.

See the original article >>

Reducing Bank Leverage

by Pater Tenebrarum

New Regulations to Force a Lowering of Leverage Ratios

We recently wrote about the problems regarding what can only be termed 'opaque accounting' at Deutsche Bank. While the particular practice discussed follows the letter of the law,  it nonetheless makes it more difficult for outside observers to assess the risks the bank is exposed to. This is of concern mainly because German banks in general and Deutsche Bank in particular are known to be highly leveraged.

The high degree of bank leverage in Europe has inter alia evolved due to an underdeveloped corporate bond market: compared to the US, far more lending to the corporate sector is performed by banks rather than by investors in Europe. The risks and weaknesses associated with this practice have been amply demonstrated in the euro area debt crisis.

There are currently attempts underway to force banks to reduce their risks, mainly via the so-called Basel 3 framework, which essentially demands the institution of higher capital ratios. It should be noted here that the practice of fractional reserve banking as such has not been touched at all – it hasn't even been discussed. Nevertheless, Basel 3 and associated regulations recently formulated by the Fed for banks operating in the US, imply that the banking sector overall will have to curtail  its leverage, which is inherently deflationary. Almost €3.8 trillion of uncovered money substitutes exist in the euro area's banking system (if the EU 27 were considered, then the addition of uncovered money substitutes issued by UK banks alone would raise this figure by another € 1 trillion).

How can banks attain these lower leverage ratios? They either have to reduce their asset base,  increase their capital, or both. They can achieve this by selling assets, reducing outstanding credit on their books by calling back loans, issuing additional share capital and retaining earnings. In many cases a combination of all these will be pursued. However, the issuance of new share capital is largely the province of the truly desperate. All other banks will likely try to avoid angering their shareholders by diluting their stakes further.

Selling assets is not going to have an effect on the money supply, but but it should be pointed out that the banking system as a whole can not sell its outstanding loans so easily: who is going to buy these loans if not other banks? However, since the banks are all trying to reduce leverage at the same time, most won't be eager to acquire the loans of other banks.

Retaining earnings – if there actually are earnings – won't be sufficient in most cases. The effect of retained earnings on leverage ratios can be improved by concurrently slowing down the issuance of new credit, up to the point where more credit is paid back than is extended. The latter is deflationary, as extant uncovered money substitutes will shrink if this course is pursued (absent an active inflationary policy by the central bank that is aimed at creating new deposits).

We have no problem with that, but most politicians and economists will likely regard it as one. If indeed the amount of fiduciary media in the euro area is set to shrink, one long term effect will be (ceteris paribus) a strengthening of the euro's purchasing power. This would be excellent news for consumers, savers and all those depending on fixed income (retirees, widows, orphans…) – precisely the groups that are punished the most by inflationary policy. It would be bad news for all those whose economic activities depend on easy money, as well as for all those who have accumulated very large unproductive debts, including governments. There would be long term gain, but considerable short term pain. Since short term pain is politically unpopular, reining in the banks is a difficult balancing act from a political perspective.


Euro area TMS

The euro area's true money supply, via Michael Pollaro. Base money (currency and covered money substitutes) and fiduciary media (uncovered money substitutes) in the  euro area. Uncovered money substitutes amount to nearly € 3.8 trillion – click to enlarge.


Deutsche Bank – A Vast Balance Sheet Needs to be Brought to Heel

As reported in the FT, the aforementioned Deutsche Bank will need to shrink its balance sheet by about 20% to comply with the new leverage ratio regulations. A few excerpts:

“Deutsche Bank plans to shrink its vast balance sheet by as much as a fifth in order to comply with incoming stricter rules for financial soundness.

In a big strategic step by Germany’s largest lender by assets, Deutsche is expected to tell investors that it aims to achieve a minimum 3 per cent ratio of overall equity to loans by the end of 2015, people briefed on the plans said.

[…]

The German lender’s estimated ratio of equity to assets stood at 2.1 per cent at the end of the first quarter, the second-lowest of 18 banks ranked by Morgan Stanley analysts.

European regulation based on the Basel III global rule book calls for the minimum ratio of 3 per cent to be achieved only in five years’ time. But the topic has risen on investors’ agenda after UK, Swiss and US regulators have drawn up plans for either stricter timetables or higher ratios.

Deutsche Bank aims to trim its balance sheet by up to 20 per cent to about €1tn under US accounting rules in the next two and a half years. The bank believes the measures it is planning would have a very small impact on earnings.

Its strategy to achieve the minimum ratio includes the application of new regulatory rules for the accounting of derivatives, reducing its vast cash pile of €240bn and shrinking the €90bn of assets in its so-called non-core unit, mostly non-performing loans.

Analysts say investors will push for banks to reach the minimum ratio much earlier than the Basel III rules demand. “Our expectation is that most European banks will aim to meet requirements by 2015,” Kinner Lakhani, analyst at Citigroup, wrote in a note to clients.

The discussion around leverage ratios has brought Deutsche Bank’s capital position back into the spotlight only months after senior managers thought the issue had been taken off the table.

[…]

The focus on leverage ratios has drawn the ire of bank executives, who warned it would incentivize lenders to concentrate on riskier products and reduce cash holdings.

“A leverage ratio is undoubtedly important,” Anshu Jain, Deutsche Bank’s co-chief executive, said at a recent conference. “But [it] has significant flaws that could lead to perverse outcomes.”

(emphasis added)

We want to point out a small error in the FT's account. If Deutsche Bank (DB) were to shrink the size of its balance sheet to a mere €1 trillion, it would shrink it by 50%, not 20%. The reality of the matter is that DB not only sports scandalously high leverage of 50:1, but its balance sheet amounts to €2.03 trillion, approaching the size of the annual output of Germany's economy (Germany's GDP is about €2.7 trillion). Note as an aside here that the notional value of DB's derivatives book is about €1.3 trillion.

Obviously, when a bank is levered at a ratio of 50:1, there is 'no margin for error', as Thomas Hoenig, former Kansas Fed president and now vice chair of the FDIC, recently remarked. Hoenig incidentally is one of the scourges of TBTF banks, and has been repeatedly calling attention to the problem that they continue to exist and are in fact bigger than ever. Hoenig believes that Deutsche Bank is 'horribly undercapitalized'. He is correct. As things stand, the bank undoubtedly consitutes a large systemic risk factor. This has nothing to do with how well the bank may be managed otherwise: it is a simply a matter of mathematics. A bank with over € 2 trillion in assets that is leveraged 50:1 represents an immense potential threat to financial stability.

Deutsche asserts that it can shed € 300 billion plus worth of assets without impacting its earnings. This raises the not unreasonable question why it was holding them in the first place, as Christopher Wheeler (a London-based bank analyst with Mediobanca) has pointed out.

Jain's Groundless Objections

Lastly, let us briefly deal with the objections voiced by DB's co-CEO Anshu Jain. These are groundless. Essentially he is asserting: “If our ability to use other people's money to make profits for ourselves is somehow curtailed, we will take even bigger risks with the remaining funds.”

This is an indirect admission that shedding assets will indeed have an effect on earnings – otherwise, why would greater risks have to be taken post deleveraging? So Jain is implicitly threatening that banks – including DB one presumes – will create even bigger systemic risks if steps are taken to lower the risks they already pose.

We agree in principle with the sentiment that new regulations usually have a plethora of unintended consequences. However, the fact remains that the existence of a fractionally reserved banking system as such already represents a huge risk for the entire market economy. Because of this great risk, tax payers are generally expected to pick up the tab when a behemoth like DB gets into trouble. Fractional reserve banking is a legal privilege the existence of which can neither be justified by traditional legal principles, nor by economic theory (nor, we should add, is there any empirical evidence that would confirm that it actually 'helps' the economy to grow. On the contrary, as credit expansion is at the root of the boom-bust cycle, it tends to impoverish society at large). Since the banks have been given extraordinary license in expanding the issuance of fiduciary media due to being backstopped by central banks, anything that forces them to reduce leverage has to be seen as a step in the right direction.

Jain's objections sound as if he thinks that banks are entitled to a certain level of profitability and that their ability to extract such profits from the rest of the economy, already extraordinarily enhanced by the fractional reserve banking privilege, should not be subject to any limitations whatsoever. There exists no such entitlement.

If there were a truly free banking system in the context of an unhampered market economy in place, then there would be no regulatory meddling – but that is obviously not the case. We would furthermore posit that in such a free market and free banking environment, bank profits overall would likely be far smaller than they are today. The coddled and highly privileged banking cartel would be exposed to far greater competition and banks could no longer rely on a 'lender of last resort' keeping them out of trouble every time their speculations go wrong. Obviously Mr. Jain is not arguing in favor of free banking. He wants to keep things as they are, he only wants the banks to retain as many privileges as possible within the existing framework.


dbpix-deutsche-krause-tmagArticle

From left to right: Deutsche Bank chief financial officer Stefan Krause and the bank’s co-chief executives, Jürgen Fitschen and Anshu Jain.

See the original article >>

Gold miners gain 20% in less than one month, off 13-year support!

by Chris Kimble

CLICK ON CHART TO ENLARGE

The Power of the Pattern shared that a 13-year opportunity looked to be at hand in the chart below, post a few weeks ago (see post here) The past month has been very good for mining stocks and the ETF (GDX).

CLICK ON CHART TO ENLARGE

The above chart reflected a long-term support line was at hand in the XAU index and a nice rally has taken place over the past few weeks once this support line was hit.

See the original article >>

2013 Is The New 2005

by Tyler Durden

As second (and third, and fourth, and so on) liens come back, one more piece of the last credit bubble puzzle falls into place.

From today's WSJ:

From 2005's WSJ:

See the original article >>

Gold - 'Never Mind', Quantitative Easing Is A Time Bomb

By: Submissions

John Ing writes: "Never mind" was how Gilda Radner's character, Emily Litella ended her rants on Saturday Night Live. Ben Bernanke should have said "never mind" after threatening the Fed might take the punch bowl away. Within days, following a panic in the markets he later recanted fearing that the hangover could be worse. The threat of the end of easy money was enough to knock a third off the gold price including a collapse of $150 in only two trading days in April. The prospect of higher rates caused big losses just after the Dow and Standard & Poors reached new highs. While the Fed's addiction to cheap money eased some of the pain from the financial crises, surprisingly not enough money was printed to sustain global growth. Instead trillions flowed into riskier investments inflating a string of asset bubbles in the financial world, destabilizing normalized markets as investors chased stocks and bonds in the search for higher returns.

But gold's collapse was different and in our opinion, more technical than fundamental. The orchestrated dumping of 400 tonnes on Comex in April was symptomatic of the casino-like atmosphere created by quantitative easing. Most telling was the collapse sparked a wave of record buying of physical gold around the globe, especially in China. Bar premiums went to double digit levels as gold went from weaker hands such as the ETFs to stronger ones like the central banks and Chinese housewives. We believe gold's secular bull market that began in 2000 is intact as investors will once again seek insurance against the unresolved economic and political risks, providing a solid foundation for record gold prices.

Quantitative Easing Is A Time Bomb

And while everyone danced around the punch bowl, the main problems were postponed and unresolved. The fix of easy money is like a drug, having less of an impact as time moves on. Zero interest rates are a money illusion that can't save the economy from mounting public and private sector debt, postponing the day of reckoning. And, unknown are the consequences of a lower dose of the Fed's medicine (aka tapering) which is likely to bring a wave of bad debts and financial failings much bigger than 2008. Just a hint of the needed brakes caused a rush for the exits, raising the risks of a further slowdown in an already anemic pace of growth, a jobless recovery.

Overshadowing all this is the phenomenal increase in sovereign debt which has been rising faster than GDP and painfully obvious is that the more money, the less bang for the buck. For example in late 2008, quantitative easing (QEI) was Ben Bernanke's grand experiment with almost $800 billion of bond-buying and yet unemployment was stuck at 10 percent. The Fed created trillions of dollars in response to the financial crisis and subsequent recession. Then a second round of bond buying, QE2 of about $600 billion followed in 2010 but also did not have much impact although Standards & Poors did lower America's credit rating. And of course, QE3 saw the Fed purchase $40 billion a month, which was doubled to $85 billion a month for an indefinite period. Noteworthy was each successive intervention had diminished returns yet, trillions later, unemployment is stuck at 7.6 percent while the Fed's balance sheet has exploded over $3.4 trillion, and still climbing.

In essence the market hopes were pinned on an untried growth model which has not worked. And while the perceived absence of inflation clearly enables the central bank to keep the pedal to the metal, trillions have fed asset inflation bubbles from stock markets to oil and condos. Meanwhile producer costs have ratcheted ever higher for both energy and commodities.

Quantitative easing operates primarily through two channels. In the first channel, the central bank purchases government paper bringing down interest rates, making it cheaper for debtors but penalizing savers. However, the artificially low cost of debt instead of reviving the economy, forced savers and investors into higher yielding yet riskier assets. The Bank for International Settlement (BIS) recently warned, "it seems less and less likely that central banks cannot repair the balance sheets of households and financial institutions". The second channel is a consequence of the first, where exchange rates drop as a result of the money printing. Quantitative easing was to lower the dollar and help exports, however, much of the money spilt into other currencies sparking currency battles. And now central banks are intervening in a defacto currency war whilst the Fed eyes an overdue exit. Not only was the Fed's monetary experiment unprecedented but its exit is uncharted and unknown. To be sure, the punch bowl was only just refilled, not taken away and yet another building block for higher gold prices.

Debt Keeps Getting Higher and Higher

In less than five years President Obama added trillions to the national debt currently at $17 trillion or 103 percent of GDP. In 2001, the national debt was some $6 trillion. Too much government spending was financed with too much debt. With America's public spending stuck at 25 percent of GDP, the most since World War II, the Federal Reserve was forced to finance consumption. And the US federal debt burden would surge further if costs for entitlements like social security, Medicare and Obamacare are included. America's debt is greater than the entire Eurozone and UK combined debt. Unresolved is another battle this fall over raising America's borrowing limit which was postponed temporarily until September by raiding billions from Fannie Mae's piggy bank. Unresolved too and not passed is President Obama's budget. Even Jack Lew, the new US Treasury Secretary said, "The bottom line is that the debt limit and the fact that we don't have a solution for the debt is also the reason for the crisis". Future generations are left with a debt they cannot pay and to be sure, this spending and public profligacy is unsustainable.

The amount of debt is one thing but the cost of interest payments is another. Markets mistakenly believe that the real problem is not the level of America's debt since servicing costs appear manageable. How short-sighted. History shows that the average interest cost on a five year Treasury note is almost 6 percent. Today, the burden of servicing America's debt is just 0.9 percent of GDP, the lowest level in 50 years. However with rates returning to the norm, then the US debt burden could cost a whopping $600 billion a year or more than the annual cost of any federal program except Social Security. Another building block for higher gold prices.

So what should policymakers do? After Mr. Bernanke's musings, the world's central bankers lost control over rates in the biggest global bond sell-off in history. The Bank of Japan, after ushering a Japanese-style quantitative easing program caused a reversal of the "carry trade" which encouraged investors to sell offshore holdings resulting in a collapse of their market. After billions of losses, what happens when rates actually do rise and QE ends? Of course, interest rates would rise and so too the cost of debt.

Looks Like An Exit, But Is It An Exit?

But we were told that quantitative easing would allow the economy to grow and buy time for needed structural changes. The pattern is familiar. Ever since the Fed began easing there was a promise of change. Reforms were to complement the Fed's zero interest rate policy. Dodd-Frank hasn't fixed the "too big to fail" problem. Obamacare has been postponed and a majority of states have opted out. The Volcker rule was relegated to the scrap heap. Gone are comprehensive tax reforms mired in a still yet to be passed budget and tax reform instead has become a "war on wealth". Gone is the call for austerity with policymakers pointing to sky high stock prices as evidence that austerity is not needed. Gone also, is the emphasis on fiscal policy as a solution and in its place, rhetoric and promises. The trillions of savings bought time and unfortunately made it too easy for politicians to delay action. More likely is that the Fed's new "tapering" policy will be a "rebranding" exercise of QE to make it look, sound like an exit, but it won't be an exit - just more of the same and another building block for higher gold prices.

Amidst this, Europe's pain continues. Despite a hiatus, new growth sources disappeared. The numbers are grim. Unemployment remains at near record levels as Europe pays for past excesses. Political turmoil has plagued the Eurozone, yet again. Portugal's government is in tatters while Greece and Italy's finances worsen. Europe still hasn't got its act together and despite rhetoric, remains more of a political union than economic union. Over a year ago, the EU planned to unify their banking systems which has become more of a goal than reality since each of the 17 members are clinging to their provincial rules. Germany rightly worries that it faces almost unlimited liabilities if the banks pool their assets and liabilities. At yearend, Greece's non-performing loans were 24 percent of loans, in Portugal 10 percent, Ireland at 15 percent and Spain at 11 percent. Major schisms between Hollande and Merkel have emerged which can't be glossed over in advance of the German elections this fall. And having admitted that they botched the bailout of Greece, the IMF and EU are proposing to use the Cyprus bank "bail-in" template ensuring states will exact pain from both creditors and taxpayers. Taxpayers have become bailout weary so the bail-in provisions are the only way of dealing with the next round of bankruptcies. Particularly odious, is that this confiscation of wealth from bondholders and savers shifts the credit risk again from the government to the private sector, which lays another building block for higher gold prices.

As a consequence of the inflation of both money and credit, the world has some $209 trillion in financial assets consisting of about 75 percent or $156 trillion of debt, exposing the global financial system to trillions of paper losses when rates rise. The health of the global financial system is ultimately tied to the health of the countries and the penchant to increase sovereign debt as a panacea for our problems has again made the banking system vulnerable. The banking system thus remains at the center of mounting concerns over the Fed-induced worries whether "tapering" will trigger a debt crisis. The irony was that the collapse of Cyprus' banks was caused by their loading up on cheap Greek bonds, taking advantage of cheap loans from the European banking system.

An Owl Market - To Who?

Indeed with the Fed financing forty percent of all debt issuances, it has become the market and thus any exit is fraught with liquidity risks - a typical "owl" market - "too who" does the Fed sell the mountain of debt to? Of concern is that despite trillions of handouts, the global banking system remains heavily undercapitalized, even under Basel III. Higher interest rates and more bailouts will make this sector riskier exacerbating vulnerabilities. Today, banks have limited ability to absorb losses of higher interest rates or even another round of bad loans. When the swamp drains even the ugly frogs are exposed. We also believe the health of the sovereigns will become a concern again and the prospect of higher rates and an eventual end to quantitative easing will cause a flight from the US dollar, the currency of a heavily indebted sovereign and much weaker than Europe. Although possessing the world's reserve currency, the Fed's balance sheet is at a record $3.47 trillion and the country has again exceeded its debt limit, further debasing its currency. Washington must relive the debt limit this fall which raises the risk of a run on the Treasury causing turmoil in the financial markets and damage to the economy. Déjà vu? The largesse and patience of lenders cannot continue forever, and another building block for higher gold prices.

Then there are derivatives, the main tools of the shadow banking system which were supposed to act as insurance against the debt default by a company or a sovereign government but morphed into "weapons of mass destruction" causing the subprime crisis and the financial meltdown of 2008. Dodd-Frank was supposed to fix the system, but its rules were so complex that many parts have not been enacted including tightening restrictions on the use of derivatives. Since sovereign health remains a concern, the biggest risk in our view remains the largely unregulated $600 trillion derivative market at ten times the size of the world's economy. While the derivative community says that the derivatives are matched, recent data shows that the interest rate and currency swaps are more leveraged than in 2008 and an Italian inquiry is looking into the usage of derivatives alarmed at the potential losses of billions following the restructuring of contracts last year. And of course, derivatives remain a big source of profits for the banks which have become bigger after the bail-outs and yet those same players are considered safer today despite JP Morgan managing to lose $570 million in one trade. Does anyone learn? Never mind.

Is Gold's 12 Year Bull Run Over?

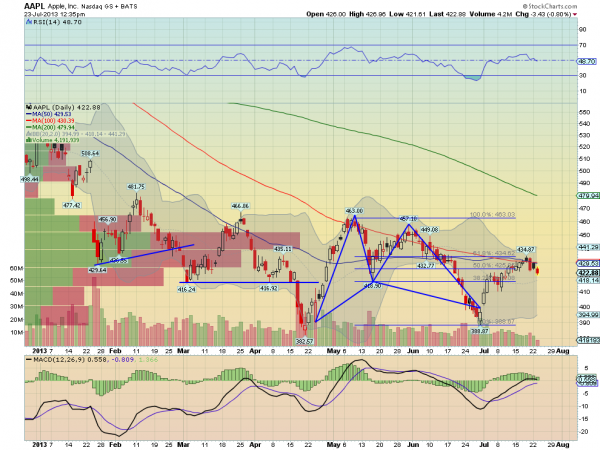
Currently the bandwagon for gold is empty. Although the price drop was sharper than expected, the price collapse pales in comparison to the drop in Apple or Facebook or even recently, the Japanese market. Yet gold receives more media attention than Mayor Ford receives in a week.

The Commodity Exchange (Comex) is owned by the CME group, the world's largest futures market where investors and commercials buy or sell commodities for future delivery. The price and size of the commodity contracts are linked to the physical commodity, in name only, since only a small portion of the commodity is actually held in the Comex warehouses. Indeed commodities no longer are consumption based but driven by the financialisaton of our markets where low rates and excess liquidity are bigger influences.

We believe the gold market like other markets has been manipulated by the financial engineers of today. In fact, in any month, less than five percent of the open interest is actually delivered against contracts while the majority is rolled over into the following month. At times, there is a growing "short" position but surprisingly, Comex physical inventories are being drawn down and curiously, as the gold price went lower, so did withdrawals from Comex warehouses. The other price determinate is the London gold fixing where the price of gold is set twice each day by the five members of the London Bullion Market Association. Many of those members are also big traders in the futures market. Not surprisingly something like three million ounces worth $3 billion or more than 10 times the annual supply of gold is traded daily. Unlike the LIBOR lending rate, which was overhauled by regulators who found that the members manipulated interest rates in their favour, the London gold fixing mechanism remains untouched and open to abuse. Something similar might be happening in the gold market.

Paper or Fiat Gold vs Physical Gold

With almost a thirty percent drop in bullion, physical ownership has become increasingly desirable as ownership becomes nine tenths of the law. The gold market has seen a shift away from paper or fiat gold (futures, contracts and ETFs) to the physical market. Paper gold has counterparty risk, while physical gold is tangible and always fungible. Unlike paper gold and fiat money, the supply of physical gold is limited. ABN Amro, the Dutch state-owned bank recently defaulted, offering cash instead of gold to their customers holding gold at the bank. We believe that the squeeze will continue as more and more central banks repatriate their gold and sop up what physical supplies are out there. There is even a school of thought that the April collapse was orchestrated by certain central banks and bullion funds in need of physical gold. After all, some 700 tonnes of gold from the ETFs somehow found a home among those needing physical gold.

The ownership issue even raised questions over the gold stored in Comex warehouses which is actually a tally of the individual holdings of Comex members. Amazingly those holdings are not audited, just like the gold in Fort Knox. The Comex legal beagles recently issued a disclaimer, "The information in this report is taken from sources believed to be reliable, however, the Commodity Exchange Inc disclaims all liability whatsoever with regard to its accountancy or completeness. This report is produced for information purposes only". Today that disclaimer seems not as boiler plate. No wonder then that physical gold trades at a premium to paper gold, there is simply a growing shortage of physical gold.

We believe there is a structural change happening to the market, akin to a classic short squeeze. We note the lack of physical gold backing those contracts as the net position of Comex stocks have plummeted to lows. Comex short positions skyrocketed on bets that the price would fall further according to the Commitment of Traders Report. Traders are taking advantage of the financial arbitrage utilizing cheap financing to leverage, purchase or sell forward, exposing themselves to huge risk changes. Given the large number of short positions, we expect that the next few months will force some of those shorts to cover their positions, underpinning the gold price as the eventual unwind will take gold to new highs.

Where is the Gold?

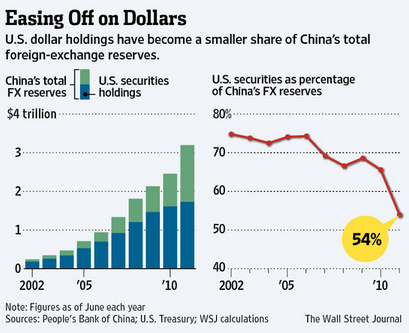
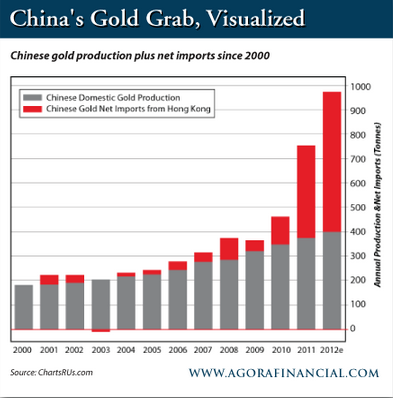
We also believe the fundamentals of the gold market are changing and ironically, while the world central banks were big sellers in the eighties, they are now big buyers, in particular the creditor nations like China, Korea, Russia, and Kyrgyz Republic. Nineteen central banks bought gold last year. Gold is slowly moving from the indebted West to the East, particularly since China is sitting with foreign exchange reserves of $3.5 trillion and in need of an outlet other than the dollar. Chinese physical demand in the first six months has exceeded the entire amount taken on the Shanghai Gold Exchange last year and more than double that country's annual production.

The global central banks are loading up on gold because they too are worried about the supply of physical gold and the safety of their reserves. At one time, central banks lent gold to the bullion banks to help hedge programs of the gold miners. Of course that turned into a disaster when the gold price moved upward, resulting in Barrick taking a $5 billion beating. However when Barrick reversed its position it caused a rush for gold, and for some central banks, the gold they had thought they had did not return. In addition, during the European crisis, some members' gold was loaned out as collateral, but the actual physical location of the gold became a mystery and that gold too is missing. As a result

Germany requested the repatriation of its gold held at other central banks but were told it could take up to seven years for delivery. And following the Cypriot debacle a few months ago, when savers' assets were seized there was an inevitable a rush for physical gold and all of a sudden, investors are talking of "allocated gold" and "unallocated gold". The bottom line is that while there appears to be a lot of gold, no one knows how much physical gold resides in any vault.

Gold's 34 percent correction is in line with the 2008 price correction that saw gold recoup all its losses, posting record highs in 2011. Gold miners fell a whopping 76 percent and 52 percent in one month alone, but soared 95 percent to new highs. We also recall the seventies when gold went from $35 an ounce in 1971 to almost $200 an ounce but fell back nearly 50 percent to $104 an ounce. The bandwagon emptied and gold's bull market was declared over. Of course, gold rallied eight times to close at $850 an ounce in January 1980. Gold always posts new highs.

Some say that interest rates are set to rise and gold would not do well in those conditions. Looking more closely, gold does well when there are negative interest rates, as there is now. Even, with the recent increase in interest rates, rates are still negative which is good for gold. Still others point to the fear that central banks would sell their gold when they got into trouble. That is untrue since gold sales were suspended a couple of years ago and even during the European crisis, gold was used as collateral for loans. Ironically, Canada, among the strongest industrial countries was an exception selling a paltry 615 ounces in May leaving our nation with 101,820 ounces. The last major sale was the UK government's disposal of 395 tonnes over 17 auctions at an average price of $275 per ounce, raising $3.5 billion. Today, that gold is worth $15.8 billion.

We further believe that gold's pullback was not due to the absence of inflation or that gold's role as a hedge against inflation is over. Although we have asset inflation in stock prices as well as other commodities and to be sure, in services like the high inflation period of the seventies, everyone misses that gold's twelve year run to $1,900 an ounce came when inflation was moribund or almost non-existent.

Still many have declared gold's glory days over, but few remember that for thousands of years, gold has been money, a store of value and barometer of investor anxiety. To be sure today, there is a lot of anxiety over the Fed's exit from ultra-loose policies. Yesterday's problems are today's. Gold's role as a hedge against debased currencies has not gone away just because of a bout of profit taking, particularly during the money printing episodes so prevalent today. For twelve years, gold has provided protection against this money printing.

We thus believe, gold's correction was normal. The world's stock markets have been among the biggest beneficiaries of the US Federal Reserve's ultra-loose monetary policy. That golden era is ending. A new era was sown with the seeds of easy money. We thus believe we are at the end of gold's correction and bullion's bull market is only half over. While gold is an ancient currency, it underpins the world economy - it has become the default currency, independent of governments. We continue to expect gold to reach $2,000 an ounce this year and ultimately $10,000 an ounce. Near term we expect gold's technical bounce to $1,350 and then find meaningful resistance at $1550 from which the "johnnies come lately" will declare a new bull market. Gold's obituary is premature and the so called money illusion called quantitative easing ensures new highs.

Recommendations

The once popular gold ETFs suffered its biggest losses, losing more than $54 billion in value this year. Assets in the SPDR Gold Trust, the biggest, fell below 1,000 tonnes for the first time since February 2009. The gold miners did worst, losing half of their value in reaction to the collapse in gold and the fallout from their overpriced and overbuilt acquisitions that were bought recklessly in the golden heydays. In recent weeks the gold miners have recorded mega writedowns of more than $19 billion of their assets led by the senior companies Barrick, Newmont, Newcrest in Australia, and AngloGold Ashanti.

The industry has been forced to write down billions after spending almost $250 billion on acquisitions in the past decade. While gold has dropped 24 percent so far this year, the stocks have done even worse losing more than half of their value. The lower price of gold will also force writedowns of reserves since many like Barrick used $1500 to value their reserves. The miners have become leveraged bets on gold and the market is afraid of revenue leverage not the upside, but the downside. The industry is set to shrink itself and Barrick axed 100 office jobs in Toronto. In addition, gold miners are reassessing projects with a lower price deck. Kinross is expected to take a $720 million charge in the second quarter after it shelved Fruta del Norte in Ecuador. The industry has long talked about growth but now the new industry mantra is profitability. The industry is going to have to boost margins, cut back exploration and rid themselves of high cost assets. The major players have scaled back projects and exploration, taking big writedowns. Many are embroiled in negotiations with hostile governments who are pushing for either higher returns or in fact ownership of those deposits. As such many miners are starved for cash. So far there have been six CEOs replaced and where changing the coach might work in hockey, the track record to date is not so good for the mining industry.

Our view is that the gold market is tightening and that the gold mining companies are the only new source of new unallocated supply. Mining stocks are leveraged bets on the gold price. As such, we do not expect the gold stocks' non-performance to last long. The in-situ reserves of the gold miners are trading at less than $250 an ounce - too cheap. The markets are wrong footed at this time. The fundamentals have not changed and the realities of the gold market are that this bull market is only a calf.

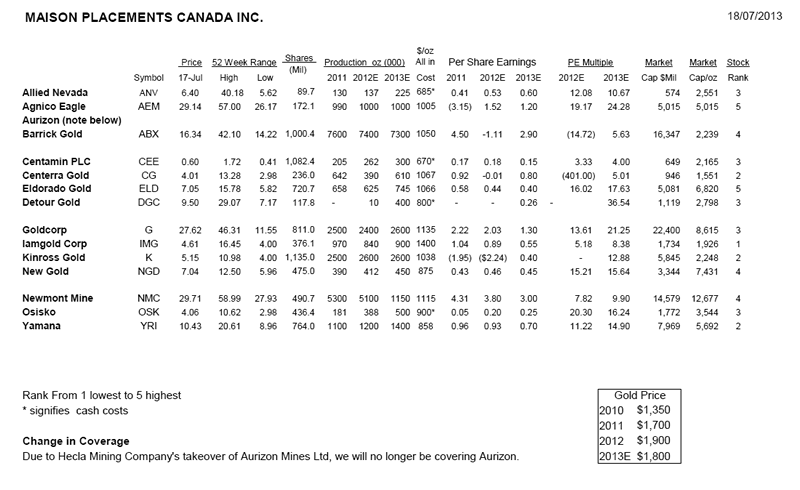
But not all gold companies are created equal. Some are undervalued. There is an ever dwindling supply of gold deposits, and in fact in the last five years, there has been a reduction in the discovery of deposits of more than five million ounces. Indeed, there have been only six discoveries in the past three years of that size. In addition the huge capital required to develop those deposits have resulted in a financing problem for even the mid-tier companies. We believe that gold stocks offer compelling value here, particularly since they have discounted and at long last recognized many of the problems outlined earlier. We continue to recommend the midcap like Agnico Eagle and Eldorado. Barrick is even a trade here.

Agnico-Eagle Mines Ltd

Agnico-Eagle's quarter was in line with the Street's expectations and importantly all-in costs remain less than $1000 an ounce. Nonetheless, Agnico-Eagle's shares are trading at net asset value (NAV). Agnico has taken advantage of the collapse by spending $50 million to buy stakes in four junior mining companies with interesting exploration upside. Rather than blow the bundle on a single takeover, as its competitors, Agnico is making strategic investments looking to build a portfolio of future producers. The LaRonde mine in Quebec remains the flagship with Goldex and La India in Mexico will make contributions this year. Agnico has operations in Quebec, Mexico, Finland and Nunavut. We like the shares here.

Barrick Gold Corp.

Barrick is facing a fresh wave of analysts' downgrades on concerns that the albatross Pascua Lama will sink the company. Barrick has lost almost half of its value, following a stunning $5.5 billion writedown for Pascua Lama. The cost of Barrick's Pascua Lama has escalated following the court decision that caused the suspension of the project and the total price tag could reach $10 billion. In addition the panic selling of gold has caused a reassessment of Barrick's other assets. Further writedowns of the African mines are expected. Barrick has since wrote down $3.8 billion of its Equinox Minerals which it acquired for $7.5 billion. The Lumwana Mine in Zambia continues to lose money and is a disappointment. Barrick has reduced its capital expenditures by $1.4 billion to $1.8 billion yet, investors are concerned that with a debt load in excess of $13 billion and having spent $5 billion at Pascua Lama that Barrick is caught between a rock and a hard place. We believe that Pascua Lama should be shelved, and that the 18 million ounces of proven and probable reserves will stay in the ground and not disappear.

Not only is Barrick facing operating problems but its shareholders have criticized the company for feathering their nest with $200,000 a year director fees, and a whopping payment to co-chairman, John Thornton. That investors are focusing on what is normally overlooked is a reflection of how far the world's biggest gold miner has fallen. However, we believe that Barrick's misfortunes are overdone and over-exaggerated. Barrick still has a treasury of $2 billion in cash and an undrawn credit line of $2 billion. The debt bullet repayments are not due until 2016, so Barrick has flexibility. Even if Barrick should halt construction at Pascua Lama, they will owe Silver Wheaton some $625 million. Barrick has already paid some of that with silver deliveries and could repay a good portion with output from its other mines or in fact take advantage of the drop in silver price and make delivery with silver open market purchases. The bottom line is that with 60 percent of Barrick's production from only five mines, Barrick has options. Asset sales are thus likely. In addition, Barrick has already begun reducing costs selling assets and could slow down work at higher cost mines. Further Barrick could monetize some of its assets and in fact why not a royalty scheme, which would show investors some money. In essence, there is flexibility. We believe that Barrick is a trade down here.

Goldcorp Inc.

Goldcorp has a great balance sheet with almost $2 billion in cash, however its multi-billion cornerstone Peñasquito poly-metallic mine in Mexico has become Goldcorp's Pascua Lama with another disappointing quarter (water and low grades this time). And now a legal dispute over ownership of part of the open pit has surfaced. Peñasquito continues to underperform and is a candidate for writedowns. In addition, newly open Pueblo Viejo mine, which it shares with Barrick, also faced a revised deal, after the government pushed for a bigger stake. While the main deal was kept intact, Goldcorp and Barrick will have to accelerate payments to the government, further reducing the margins on that project. Goldcorp has some big plans to expand production by 2017, but with those big plans come big capex. We expect Goldcorp like others to pare down its portfolio including highly prospective Eleonore in Quebec which is scheduled to

start up in 2014. Other projects that could be deferred including Cerro Negro in Argentina and 70 percent El Morro in Chile. Goldcorp should produce about 2.6 million ounces this year at a total cash cost of $1100 per ounce. We prefer Barrick here.

IAMGold Corporation

IAMgold's results have been a disaster as costs rise. Despite a capital constrained environment, IAMGold persists in the development of Côté Lake despite the $1 billion expenditure. IAMGold's focus on costs, is also limited because they are not the operator of some of its mines and thus have no control over costs. IAMgold should also sell Niobec and concentrate on gold mining. We would avoid the stock here.

Kinross Gold Corp

As expected Kinross has walked away from the Fruta del Norte project in Ecuador because the company could not come to an agreement with the Ecuadorian government over on extension of its contract. Consequently Kinross intends to write-off $720 million in the quarter. Kinross acquired Fruta del Norte in a $1.2 billion takeover of Aurelian in 2008 but Kinross was unsuccessful in getting the contract extended after five years of negotiations. Instead, Kinross plans to proceed with a full feasibility study at the problem prone Tasiast open pit mine in Mauritania but at a more modest 38,000 tonnes per day mill which could produce 800,000 ounces or so. We believe that Tasiast is an albatross and the revised mine plan is still questionable given that Kinross expects to spend $2.7 billion more to develop the project. While management insists that a final construction decision has not been made, Kinross plans to spend $624 million this year. After writing off $5.5 billion, mostly due to Tasiast, we believe Paul Rollinson's decision to prune expenses should include Tasiast. Sell.

Newmont Mining Corp

Newmont's results were disappointing as its costs creep up. Newmont has cut back its spending because all-in costs are between $1100 to $1200 an ounce. Still, Newmont is spending half a billion dollars in Africa, South America and North America so we believe there is still room to cut back, particularly since its guidance is for another flat year. The $4.8 billion Minas Congo project in Peru is stillborn and Newmont faces a problem of ageing mines and rising costs. Newmont should think of merging with another entity to prune costs and maximize the value of its assets.

Yamana Gold Inc.

Yamana owns seven operating mines in Mexico, South America and reported a drop in earnings due to higher costs. Yamana's all-in costs are low at $900 an ounce producing 1.4 million gold equivalent, principally ounces from flagship El Penon. Yamana's heavy copper exposure will hurt overall costs as well as higher cost Jacobina and Ernesto/Pau-a-Pique. Although Yamana commissions three new Brazilian mines this year, Yamana might shelve the stalled Cerro Morro project a gold/silver project in Argentina (bought for almost $400 million) because of the government's desire to increase revenues. We prefer Agnico-Eagle at this time.

See the original article >>

Are lumber futures pointing to stabilization in residential construction?

by SoberLook

Lumber futures turned out to be a good predictor of US housing starts. The large decline earlier this year (see post) translated into weaker than expected residential construction in June (see post). That means we should certainly pay close attention to lumber as a leading indicator. And July is showing a steady increase in prices, potentially pointing to improving demand.

After a disappointing result in June, is construction picking up this month ? Many economists think so. The key data that researchers point to is the Homebuilders' survey, which is at the highest levels since 2006.

Source: DB

The index had certainly diverged from housing starts in the past, but the combination of this survey and higher lumber prices may be pointing to an improvement in residential construction for July. The US economy could certainly use it.

See the original article >>

Equity markets are discounting the rally in crude oil

by SoberLook

Energy shares have underperformed the broader market starting in April when crude oil prices touched the lows for the year. Stock valuations clearly responded to the downside. On the up-side however, in spite of the recent sharp rally in crude (see discussion), energy shares continue to lag.

Source: Ycharts

Equity markets are not convinced by the recent spike in oil prices and view it as temporary. The US government economists seem to agree. The recent projection of average cash prices for 2014 puts Brent forecast 9% below the current level while WTI is predicted to be almost 15% below where it currently trades.

Source: EIA

The general consensus seems to be that unless we have further unrest in the Middle East or an unlikely event of materially improving economic fundamentals globally, prices should decline. Of course the question remains: How long should oil prices stay elevated relative to forecasts before energy shares begin to outperform?

See the original article >>

Goldman cuts coffee, sugar hopes, but lifts cattle

by Agrimoney.com

Goldman Sachs cut its forecast for coffee and sugar prices, and said it was downbeat on prospects for lean hog futures, but upgraded hopes for live cattle values on expectations of a boost to the beef market.

The investment bank, which in April lowered its forecasts for New York arabica futures by up to 30 cents a pound, on Tuesday downgraded them again, to 130 cents a pound on three, six and 12 month horizons.

The bank acknowledged the rise in prices from a Brazil frost scare which has taken some contracts above that level, although the best-traded September contract stood at 126.45 cents a pound at 06:15 local time (11:15 UK time), up 0.9% on the day.

However, it also flagged an upgrade by the International Coffee Organization to its forecast for world coffee output in 2012-13, and a US Department of Agriculture forecast of a surplus in 2013-14 despite the season being an "off" year for Brazil, which has alternate higher and lower production years.

"The expected 2013-14 surplus that would bring stocks to their highest level in five years is leading us to lower once again our forecasts," Goldman said.

'Market in surplus'

For sugar, the bank cut its forecast for New York futures in three months' time by 1.0 cents to 16.5 cents a pound, and cautioned of "downside risk" to its forecast for futures further ahead too, citing strong world production prospects.

Goldman arabica coffee, sugar price forecasts and (change on previous)

Coffee, three, six and 12-month horizons: 130 cents per pound, (-15 cents)

Raw sugar, three-month horizon: 16.5 cents per pound, (-1.0 cents per pound)

Six-month horizon: 17.5 cents per pound, (unchanged)

12-month horizon: 19.0 cents per pound, (unchanged)

Forecasts for price of New York spot contract

"A record large Centre South Brazilian sugarcane harvest and a promising start to the Indian monsoon will keep the global sugar market in a surplus for the third consecutive year in 2013-14," Goldman said.

The comments will further ease nerves among hedge funds, which have appeared at risk of being wrong-footed in their hefty net short positions in coffee and raw sugar futures and options, as Brazil weather fears continue to revive prices.

New York raw sugar for October was 0.1% higher at 16.42 cents a pound.

'Record pig crop'

Goldman also cautioned of lower lean hog prices ahead, flagging the prospect of a "record pig crop in coming quarters", as signalled by a quarterly USDA hog report last month.

Goldman lean hog price forecasts

Three-month horizon: 82 cents per pound

Six-month horizon: 81 cents per pound

12-month horizon: 87 cents per pound

Forecasts for price of Chicago spot contract

The USDA data showed that while the US hog and pig herd as of June 1 was smaller than expected, at 66.647m head, numbers of breeding animals were, at 5.882m head, up 48,000 quarter on quarter, and with farrowings for the September-to-November period expected to show a small rise.

"Despite continued strong domestic demand," as high beef prices switch consumers to pork, "the prospect for large hog supplies later this year, as well as lower feed prices and continued weak exports, lead us to forecast prices below the forward curve," the bank said.

'Sustain their rebound'

However, for live cattle, the bank lifted price forecasts to levels slightly above those suggested by Chicago futures, forecasting that the prospect of lower beef supplies later this year would allow prices to maintain their recent resilience, after a soft performance in the first half of 2013.

Goldman live cattle price forecasts and (change on previous)

Three-month horizon: 128 cents per pound, (+5 cents per pound)

Six-month horizon: 130 cents per pound, (+5 cents per pound)

12-month horizon: 128 cents per pound, (unchanged)

Forecasts for price of Chicago spot contract

Data on Friday showed placements of cattle on US feedlots falling 5.1% year on year to 1.587m head, with animals that were placed unusually large – meaning that they are likely to be slaughtered earlier than might be expected, in the early autumn, and leaving smaller beef supplies later in 2013.

"While cattle prices have declined year to date on the combination of weak exports, competition from lower pork prices as well as resilient production, we expect prices to sustain their recent rebound given our expectation for declining beef supplies later this year," Goldman said.

It also flagged the prospect of competition between packers and ranchers for feeder cattle, assuming pasture condition improves, encouraging herd rebuilding.

"The potential for heifer retention under normal weather this summer could further tighten [feeder cattle] supplies this fall."

See the original article >>

Follow Us