Saturday, September 7, 2013

Unrealistic Expectations

By John Mauldin

Unrealistic Expectations
Nominal or Real?
Voting versus Weighing
Chicago, Bismarck, Denver, Etc.

"In the short run, the market is like a voting machine, tallying up which firms are popular and unpopular. But in the long run, the market is like a weighing machine, assessing the substance [intrinsic value] of a company."
– Benjamin Graham

Way back in the Paleozoic era (as far as markets are concerned), circa 2003, I wrote in this letter and in Bull's Eye Investing that the pension liabilities of state and municipal plans would soon top $2 trillion. This was of course far above the stated actuarial claims at the time, and I was seen as such a pessimist. Everyone knew that the market would compound at 9%, so any problems were just a rounding error.

Now it turns out I may have been a tad optimistic. Two well-respected analysts of pension funds have produced reports this summer suggesting that pensions are now underfunded by more than $4 trillion and possibly more than $5 trillion. I would like to tell you that the underfunding is all the bad news, but when you probe deeper into the problems facing pension funds, it just gets worse. The two reports conclude that pension plan sponsors seem determined to keep digging themselves an ever-deeper hole. But to hear the plan sponsors tell it, the situation is readily manageable and the risks are minimal. Except that pesky old reality keeps confounding their expectations.

And that is the crux of the problem. Whether you believe there really is a problem boils down to the assumptions you make about future returns. If you believe the projections trotted out by pension fund management and the bulk of the pension consulting groups, the underfunding is a mere $1 trillion — a large amount to be sure but manageable for most states.

The emphasis here is on most. Some states and municipalities are in far worse shape than others, and to be honest with you, I don't see how some of them can meet their commitments. Others are trying to be responsible and fulfill their pension fund obligations based on the assumptions their "experts" come up with, but the problem is that those assumptions may be overly optimistic. The seemingly small difference of just 1% of GDP growth can make a huge difference in pension liabilities (and thus taxpayer obligations).This week we begin a series focusing on the problems facing US state and local pension funds. This issue has relevance to you not only as a taxpayer but also as an investor, because it goes to the very core of the question, what is the level of reasonable returns we can expect to see from our investments in the future? This is not a problem that is restricted to the US — it's global. Sadly, we don't live in a Lake Wobegon world where all pension funds and investment portfolios are above average. Not everyone can be David Swenson, the famous chief investment officer of Yale University. Truth be told, David Swenson will have a difficult time being David Swenson in the next 20 years.

Unrealistic Expectations

The past 10 years have seen a growing number of economists and financial analysts questioning the propriety of the methods used to forecast pension fund liabilities. This is more than an academic exercise, as the numbers you choose to base your models upon make massive differences in the projected outcomes. As we will see, those differences can run into the trillions of dollars and can mean the difference between solvency and bankruptcy of municipalities and states. The implicit assumption in many actuarial forecasts is that states and cities have no constraints on their ability to raise money. If liabilities increase, then you simply raise taxes to meet the liability. However, fiscal reality has begun to rear its head in a few cities around the country and arrived with a vengeance in Detroit this summer. It seems there actually is a limit to how much cities and states can raise.

"Aah," cities assure themselves, "we are not Detroit." And it must be admitted that Detroit truly is a basket case. But it may behoove us to remember that Spain and Italy and Portugal and Ireland and Cyprus all said "We are not Greece" prior to arriving at the point where they would lose access to the bond market without central bank assistance.

In response to growing concerns over public pension debt, the Governmental Accounting Standards Board (GASB) and Moody's have both proposed revisions to government reporting rules to make state and local governments acknowledge the real scope of their pension problems. (While it is possible to ignore Moody's, based on the fact that it is just one of three private rating agencies, it is impossible to ignore GASB, which is the official source of generally accepted accounting principles (GAAP) used by state and local governments in the United States.

Under the new GASB rules, governments will be required to use more appropriate investment targets than most public pension plans have been using, bringing them more in line with accounting rules for private-sector plans. Pension plans can continue to use current investment targets for the amounts the plans have successfully funded; but for the unfunded amounts, pension plans must use more reasonable investment forecasts, such as the yield on high-grade municipal bonds, currently running between 3 and 4 percent. From my perspective, not requiring reasonable investment forecasts on already funded accounts is still unrealistic, but the new GASB rules are a major step in the right direction, and I applaud GASB for taking a very politically difficult stance.

Moody's has also proposed new rules to require states to use more appropriate investment targets. Their new rules require pension plans to use investment targets based on the yield of high-grade, long-term corporate bonds, currently just over 4 percent. (Source: http://illinoispolicy.org/uploads/files/Pension_debt_more_than_doubles.pdf)

What difference does a more "realistic" forecast make? According to the survey done by Moody's, it makes a difference of more than $3 trillion, or more than double the total actual assets of the 255 largest state-funded pension plans. This is illustrated in the chart below.

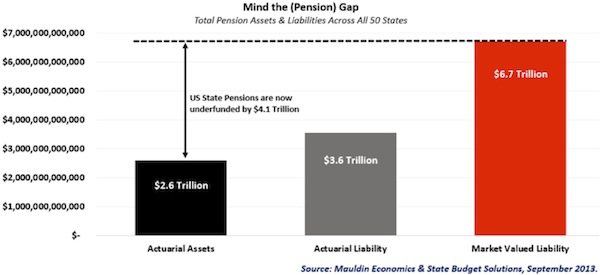
Current official reporting suggests that states have funded 73% of their pension liabilities. The fair-market-value approach used by Moody's and GASB suggests that funding is only at 39%. The difference is almost entirely due to the assumptions one uses about the discount rate for future expected returns.

The next two charts provide an illustration. I'm simplifying a bit, but the principles are correct. If you are a pension plan manager, you have to be thinking over very long periods of time. Someone retiring today at age 60 will likely require almost 30 years of pension payments. Someone aged 40 paying into your pension program will likely be getting his or her pension returns 50 years from now. Let's look at a few scenarios of what might happen to $1 billion over the next 40 years under various assumptions of investment returns.

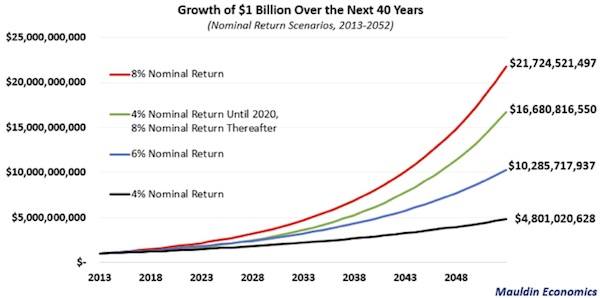
Many state-funded pension plans today assume an 8% nominal return for the indefinite future. Some are beginning to forecast lower returns, but very few would forecast lower than 7%. Moody's argues that somewhere in the range of 4% nominal is more realistic. Notice that the difference after 40 years is well over four times. Even if you assume that magic returns to the markets after 2020 and returns go up to 8% thereafter (the green line in the chart), there is still a gap of $5 billion after 40 years. On assets of $2 trillion, that is a gap of $10 trillion. If you assume only a 4% nominal return for the entire 40 years, the gap is $30 trillion. For the mathematically challenged, that is not a rounding error.

Nominal or Real?

Nominal returns are only part of the story. We live in a world of inflation, and almost all pension funds are inflation-adjusted. The next chart takes the same $1 billion and extrapolates into the future but assumes a modest 2% inflation rate over the 40-year period. The small difference of just 2% annually reduces the real returns by over half. Assumptions can have very wicked children. And grandchildren.

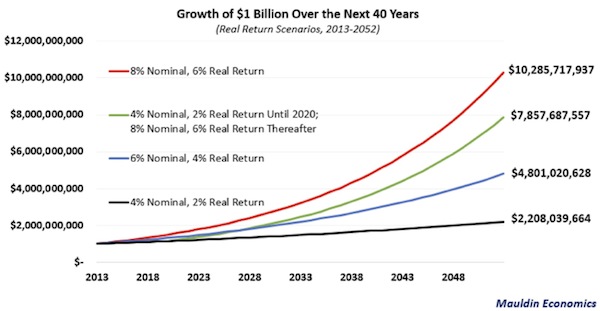
A 4% nominal growth rate, or 2% real growth, sounds so pessimistic, but it is actually in line with what we've experienced over the last 18 years. And you want your assumptions about the future to be as conservative as possible, so that if there are surprises they are pleasant ones. Looking ahead, economic growth does not appear likely to yield pleasant surprises. We use the following chart from Jeremy Grantham at GMO about a month ago, but we need to look at it again in more detail. These are the forecasts that Grantham makes for real (inflation-adjusted) returns over the next seven years:

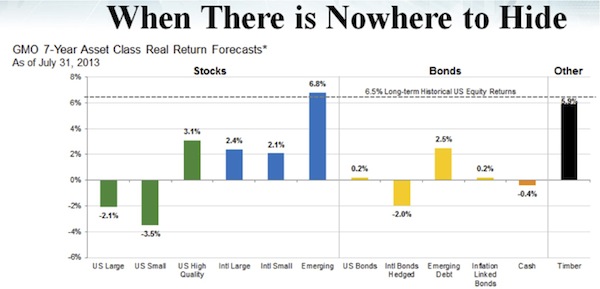
Notice that if you had a "balanced portfolio," equally distributed among the six equity-asset classes, your total annual real return would be in the 1.5% range. Using the same balanced approach with bonds, your total return would be 0.1%. In the black bar at far right we see Grantham's projected returns for investments in timber, which can be taken as a proxy for "alternative" investments in general. A pension fund investing 55% in equities, 35% in bonds, and 10% in alternatives (not an uncommon pension allocation scheme) would see a total annual real return of around 1.5% real, if Grantham is correct. To bring returns up to even 2% real for the next 10 years, you would have to knock the lights out for the final 3 years of the 10-year time frame.

You may ask, why does Grantham project equity returns to be so small? Can't we assume that over longer periods of time returns will be in the 8%-plus range? Sadly, 8% is an unrealistic number for long-term growth in the equity markets, as Grantham has so ably demonstrated.

Voting versus Weighing

The father of value investing, Benjamin Graham, gave us a simple illustration for looking at market valuations. He noted that "In the short run, the market is like a voting machine — tallying up which firms are popular and unpopular. But in the long run, the market is like a weighing machine — assessing the substance of a company." The message is clear: what matters in the long run is a company's actual underlying business performance and not the investing public's fickle opinion about its prospects in the short run.
(Source: Morningstar)

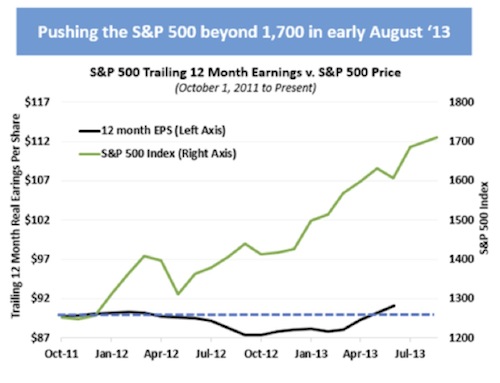
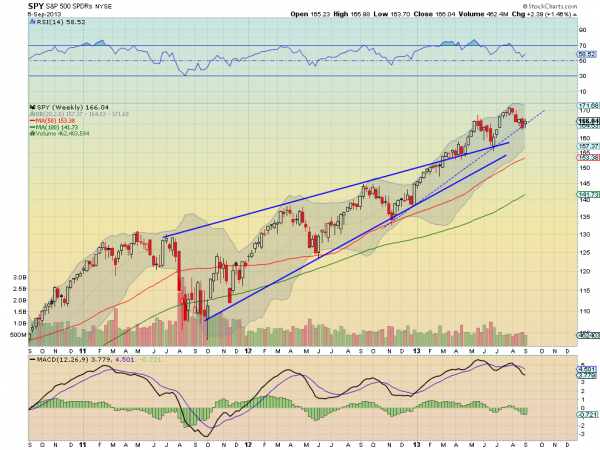
At the end of the day, what the market really weighs is earnings, and that judgment is reflected in the valuation it puts on those earnings. Is $1 worth of earnings worth $8, or $25? Are you expecting a 12% return, or a 4% return? Of course, your answers depend on your view of inflation, what you think of the growth prospects of the company in the economy, and your alternatives for that dollar of investment. The markets can fluctuate a great deal around long-term trends, but they always come back to the average. We've had quite a nice stock market run over the last four years, but let's look at just the last two years, which have theoretically been part of a recovery period. Notice in the chart below that trailing 12-month earnings have been essentially flat, while the market has gone up almost 40%. Almost all of the growth in the stock market has occurred because people were willing to pay a higher multiple for the same dollar's worth of earnings. Valuations are not at nosebleed levels, but they are certainly high; and without something to seriously boost earnings, it is hard to see how the market can justify still higher valuations.

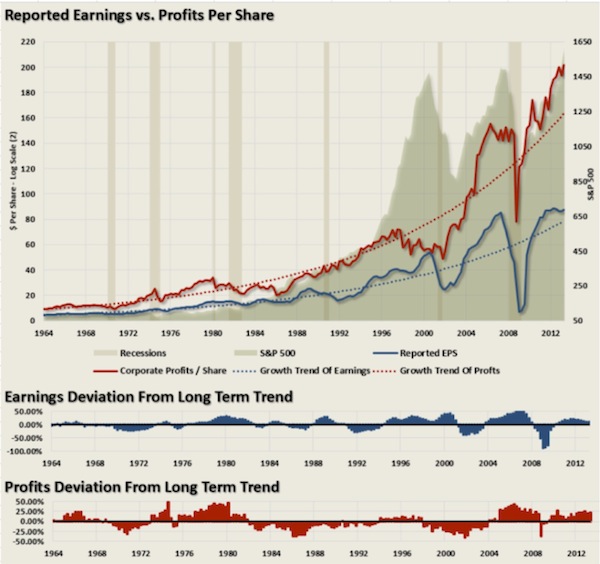
The next chart is from my friend Lance Roberts. Quoting Lance:

As you will notice each time that corporate profits (CP/S) and earnings per share (EPS) were above their respective long-term historical growth trends, the financial markets have run into complications. The bottom two graphs [see below] show the percentage deviations above and below the long-term growth trends.

What is important to understand is that, despite rhetoric to the contrary, "record" earnings or profits are generally fleeting in nature. It is at these divergences from the long-term growth trends where true buying and selling opportunities exist.

Are we currently in another asset "bubble?" The answer is something that we will only know for sure in hindsight. However, from a fundamental standpoint, with valuations and profitability on a per share basis well above long-term trends, it certainly does not suggest that market returns going forward will continue to be as robust as those seen from the recessionary lows.

So what does this academic discussion about future returns have to do with pension funds? It matters because pension funds make assumptions about their future ability to meet their obligation to pay retirees a monthly check based upon their assumptions about returns. In the next few weeks we're going to look at specific states and their assumptions and what that means for their taxpayers in terms of their budgets.

We all know that Illinois is in difficult straits. The state of Illinois has set aside $63 billion to pay for future benefits. But between now and 2045 they're going to have to pay out 10 times that much — $632 billion. By the state pension fund's own estimate, they need another $83 billion to be adequately funded. Just a few years ago their deficit was a mere $50 billion. Compound interest means that the longer you ignore your problem, the faster it gets worse.

Total state revenues for Illinois were $33 billion for fiscal year 2012. Let's see if we can find a politician to propose that they take 25% of the budget every year for the next 10 years to reduce their underfunded pensions (as opposed to the 12% they allot currently). Mayor Emanuel, do you have a plan?

Because the pension plans are so underfunded, they would need to see average investment returns of nearly 19 percent per year to cover future payouts. The state predicts its pension funds will earn investment returns between 7 and 8.5 percent per year. Even these returns may be overly optimistic. Over the last decade, the pension funds have earned average investment returns of only 4.5 to 6 percent per year. The funds' unrealistic investment targets have already increased the state's total pension debt by more than $14.3 billion since 1996. (Source: http://illinoispolicy.org/uploads/files/Pension_debt_more_than_doubles.pdf)

The unfunded liability in Illinois is $22,294 per person. What we will find next week is that there are states that are actually in worse shape than Illinois in that regard. And no, California is not one of them. (Hint: they have Republican governors. Oops. That's not supposed to happen. Especially if the governors are considered to be vice-presidential material. Just saying…)

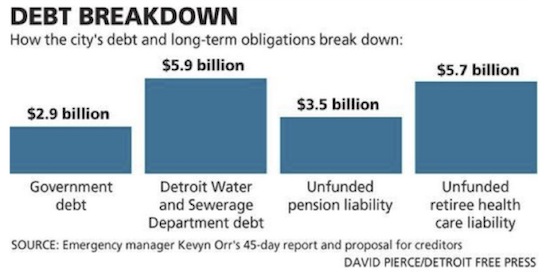
We will also look at the specifics of Detroit. One of the ugliest reports I've read in the last year is the report of the new "emergency" manager of Detroit, outlining his proposal to take the city out of bankruptcy. It makes for some of the most dismal reading anywhere. But buried in the data is this interesting chart that the Detroit Free Press created. Note that the unfunded healthcare liability is far larger than the pension liability. That provides another avenue for us to look down. In the meantime, you might look and see what your city or state assumes about the returns on its pension funds. Then look at what the difference between that amount and 4% nominal might be and see what the effect would be on your tax rate. I suggest you do that only with an adult beverage close at hand.

We will close with one sentence from the report of the Detroit emergency manager, referring to the ability of the city to pay its obligations to those who have already retired: "Because the amounts realized on the underfunding claims will be substantially less than the underfunding amount, there must be significant cuts in accrued, vested pension amounts for both active and currently retired persons." Sadly, that sentence is likely to be cut and pasted into many similar documents around the country unless changes are made now. If you wait until you are Detroit (or Greece), it is too late.

Chicago, Bismarck, Denver, Etc.

Tonight was the theatrical premiere of the documentary Money for Nothing here in Dallas. I predict this movie will soon be winning awards everywhere. The producer and editor, Jim Bruce, has done a magnificent job of giving us a balanced history of the Federal Reserve, with a perspective on how they manage their responsibilities. The movie will open next week in New York and Washington DC and then begin to open around the country. You can find out more by going to www.moneyfornothingthemovie.org. I may be biased because this is a subject that is near and dear to my heart, but everyone in the theater tonight seemed to conclude that this is one of the best documentaries that has been produced in a long time. Jim Bruce makes his living editing major movies in Hollywood, and his talent shows up in spades in this film. Only about 1% of the interviews they recorded (in terms of time) made it from the camera to the actual film. The craftsmanship of weaving all those interviews, one after another, taking small slices here and there and creating one continuous, compelling narrative, is truly amazing. You simply have to see this film if you get the chance.

I know that a lot of Senate staffers (and even a few senators) read this letter from time to time. You have a very interesting vote coming up in a few weeks after President Obama nominates a new Federal Reserve chairman. I strongly suggest you view this documentary prior to casting your vote or asking your questions (if you're on the committee). That will certainly make for a more lively and entertaining committee meeting. Drop me a note and I will arrange for you to get a copy of the film. (If you're in the White House, you might possibly want to watch just to see what kinds of questions could be coming up for your nominee. Just a thought.)

Monday evening I fly to Chicago for a speech and then on to Bismarck for a presentation for BNC Bank. Before ending up in Bismarck, I will fly to Rapid City, South Dakota, to gaze at Mount Rushmore and put my feet on to South Dakota soil, at which point I can say that I've been to all 50 states. My friend Loren Kopseng will pick me up and fly me up to the Bakken oil fields for another tour of the area. The next week I will be in Denver and the following week in Toronto and New York.

It is quite late and time to hit the send button. I might have lingered too long at my friend David Tice's after-moving party, as the conversation was just so much fun. But great conversation didn't get the letter done, so as usual I am up until I can meet the deadline. But it was worth it. I can always sleep late another day. But not today. I promised some of the kids and my sister I would have brunch with them, and I have to set my alarm clock early enough to be on time. Then, in the evening, my daughter Abbi and her new husband Stephen will be down from Tulsa. We will spend the next day or so catching up and doing family stuff. Have a great week.

Your hoping he can find above-average returns somewhere analyst,

See the original article >>

Offshore tax evasion Swiss finished?

by Economist

America arm-twists the bulk of Switzerland’s banks into a painful deal

WOODY ALLEN once remarked that believing in God would be easier if He would show Himself by making a large deposit in a Swiss bank account in the director’s name. Parking riches in the Alps has become a less heavenly experience in recent years, thanks to America’s assault on its tax-dodging citizens and the moneymen who serve them.

Fearful that other banks could suffer the same fate as Wegelin, a venerable private bank that was indicted in New York in 2012 and put out of business, the Swiss government has been seeking an agreement with America that would allow the industry to pay its way out of trouble in one go. Instead, it has had to make do with one covering banks that are not already under investigation, which excludes some of the country’s biggest institutions.

The deal is cleverly structured. Of Switzerland’s 300 banks, 285 will be able to avoid prosecution if they provide certain information about American clients and their advisers, and pay penalties of 20-50% of the clients’ undeclared account balances, depending on when the account was opened and other factors. Banks that persuade clients to make disclosures before the programme starts will get reduced fines. Banks will not have to take part but the legal risks are daunting for those that don’t, even if they hold little undeclared American money. Those with no foreign clients will have to produce independent reports proving they have nothing to hide if they want a clean bill of health.

One Swiss newspaper likened the deal to “swallowing toads”. Another called it “the start of an organised surrender”. The bankers’ association sees it as a necessary evil: the only way to end legal uncertainty, albeit at a cost that will strain some institutions. Small and medium-sized Swiss private banks are already struggling. In 2012 their average return on equity was 3%; the number of private banks fell by 13, to 148, mostly because of voluntary liquidations. KPMG, a consultancy, expects this to fall by a further 25-30% by 2016 as receding legal threats encourage the return of mergers.

Some of the prospective buyers in any future M&A wave still have to make their peace with the Americans. Excluded from the deal are 14 mostly large banks that have been under investigation for some time, including Credit Suisse and Julius Bär. They will have to settle individually, with fines expected to be steep, some perhaps comparable to the $780m paid by UBS in 2009. These banks are also under pressure from European countries that have suffered tax leakage, including Germany, whose parliament has rejected a deal that would have allowed the Swiss to make regular payments of tax withheld from clients while avoiding having to name names.

Swiss bankers gamely argue that bank secrecy remains intact, pointing out that privacy laws have not been dismantled. But banks are being bullied into providing enough information, short of actual client names, to allow the Americans to make robust “mutual legal assistance” requests that leave Swiss courts with no option but to order banks to provide clients’ personal details. The courts still have some flexibility because America has yet to ratify an amended tax treaty with Switzerland, thanks to blocking tactics by Rand Paul, a senator who argues it would violate Americans’ right to privacy. But this obstacle will eventually be cleared or circumvented.

All of which fuels speculation that Switzerland could lose its crown as the leading offshore financial centre, even though it is still well ahead of fast-growing rivals in Asia (see chart). It may find comfort in the fact that the Americans plan to use information harvested from the Swiss— including “leaver lists”, which contain data on account closures and transfers to banks abroad—to go after other jurisdictions. This is part of a “domino effect” strategy, says Jeffrey Neiman, a former federal prosecutor, aimed at forcing tax evaders “so far off the beaten path that they can’t be sure if the pirate waiting to take their money will be there when they return.”

See the original article >>

Slovenia to liquidate two small banks as bailout looms

By Marja Novak

LJUBLJANA (Reuters) - Slovenia - struggling to avoid an economic bailout - will liquidate two small banks, Factor Banka and Probanka, to ensure the financial stability of its banking system, the country's officials said on Friday.

A statement by the finance ministry and the central bank said the government had provided guarantees totaling 490 million euros ($645 million) for Probanka and 540 million for Factor Banka, to ensure the repayment of their depositors.

Local banks, struggling with 7.5 billion euros of bad loans worth more than one-fifth of national output, are the target of speculation that Slovenia may follow other troubled euro zone members and seek an international bailout in the coming months.

Central bank governor Bostjan Jazbec, who also sits on the European Central Bank's governing board, said depositors would not lose out.

He said they would be able to withdraw money as before, "with no extra limitations" and there was "no basis for a run on the two banks", the first lenders to crumble since Slovenia's economy went downhill in 2009.

"What we are doing is designed to increase security of the bank deposits and improve stability of the banking system," Jazbec told an evening news conference.

But analysts said the action showed Slovenia might be on the brink of a bailout.

"The costs of a possible bailout could exceed 10 billion euros if the government continues to cover losses even in small banks which are not of systemic importance and are not state-owned," said Andraz Grahek of consultancy Capital Genetics.

EU APPROVAL

Finance minister Uros Cufer said the controlled liquidation of the two banks had been approved by the European Commission.

The ECB said in a statement later on Friday that "the purpose of this action ... is to contribute to the stability of Slovene banking sector".

The two banks are privately owned and among the smallest lenders in the country of two million, together representing about 4.5 percent of its whole banking system.

Jazbec said earlier on Friday that "further activity of the two banks could significantly reduce financial stability in the Slovenian banking system".

"The Bank of Slovenia and the government are trying to prevent a similar scenario as in Cyprus and representatives of international institutions are ready to prevent that scenario," he said.

He did not give further details but Saso Stanovnik, chief economist at investment firm Alta Invest, told Reuters: "There is an impression that the ECB has a backup plan and will be ready to help Slovenia if needed."

He said he did not expect a bank run next week as officials had made clear deposits were guaranteed in full, not only up to 100,000 euros which is the standard guarantee in the euro zone.

All banks in Slovenia are closed on Saturday and Sunday.

Slovenia plans to start transferring bad loans to a state-owned "bad bank" in October.

Last month the central bank ordered external stress tests of 10 banks, including the two to be liquidated, with results due by December.

The country bought some time in May when it issued two bonds with a joint value of $3.5 billion but will have to tap the markets again no later than in the first quarter of 2014, before its 5-year 1.5 billion-euro bond expires on April 2.

A 10-year bond issued in May carried a yield of 6 percent while on Friday the yield on Slovenia's benchmark 10-year euro bond reached 6.8 percent, up from 6.75 at Thursday's close, according to Reuters data.

Slovenia was the fastest-growing euro zone member in 2007 but was badly hit by the global crisis due to its dependency on exports.

It has been struggling with a new recession since last year amid lower export demand, a credit crunch and a fall in domestic spending caused by budget cuts.

($1 = 0.7600 euros)

See the original article >>

Minister says Italy will dodge political crisis

By Giancarlo Navach

CERNOBBIO, Italy (Reuters) - Economy Minister Fabrizio Saccomanni expressed hope on Saturday that Italy's fragile ruling coalition could avoid a breakdown which he warned would threaten strained finances and risk wrecking credibility won during months of painful austerity.

Saccomanni's comments follow weeks of tension over the political future of center-right leader Silvio Berlusconi following his conviction for tax fraud last month.

"I am confident, I believe there won't be a crisis," he told reporters on the sidelines of a business conference in the northern Italian town of Cernobbio.

Allies of the former premier have said the center-right could pull out of Prime Minister Enrico Letta's coalition if center-left members of a Senate panel vote to strip Berlusconi of his seat in the upper house of parliament.

However, senior allies of the 76-year-old media billionaire have struck a more conciliatory tone in the past two days, raising hopes that a crisis may be averted.

"The country needs responsibility. We have guaranteed this sense of responsibility today," Renato Schifani, the floor leader in the Senate of Berlusconi's People of Freedom (PDL) party, told SkyTG24 television.

The panel begins meeting on Monday, but it may take weeks for the complicated procedure that could lead to Berlusconi's expulsion from parliament to be completed.

Political risks have weighed on Italian government bonds in recent sessions and analysts say Rome could see weaker demand and be forced to pay higher yields at a bond auction next week, unless investors receive some reassurance the government will hold.

A breakdown of the coalition, raising the prospect of early elections at a time when Italy should be planning next year's budget, would push yields on Italian government bonds further up, increasing debt payments, Saccomanni warned.

"Fresh tensions on government bonds would make it more difficult (for Italy) to manage the budget deficit and keep it within the 3 percent limit," he said.

"UNFORGIVABLE LOSS OF CREDIBILITY"

Italy is targeting a 2013 deficit of 2.9 percent of output, a fraction below the European Union's 3 percent ceiling, and has been removed from the EU's list of countries in excessive deficit, but it faces growing headwinds as its longest postwar recession has continued.

Saccomanni said Italy, which came close to dragging the euro zone into a life-threatening crisis in 2011, could not afford to be put back under the constraints of the special list considering it would hold the rotating European presidency in the second half of next year.

"It would be a totally unforgivable loss of credibility," he said.

A worse-than-expected economic contraction and a recent agreement to modify an unpopular property tax threaten Italy's deficit commitment, and some analysts say it will need to take additional belt-tightening measures.

Saccomanni said Italy, with a youth unemployment rate running at about 40 percent, still aimed to cut taxes on labor in a bid to spur job creation.

Italian Labor Minister Enrico Giovannini said measures to fund a lower tax burden on labor would be included in the budget law to be presented in mid-October.

Saccomanni expressed confidence about a state bailout for Italian bank Monte dei Paschi di Siena that needs EU approval ahead of a meeting with EU Competition Commissioner Joaquin Almunia in Cernobbio on Saturday.

"I believe the prospects are positive, we've done a good job."

Monte dei Paschi received 4.1 billion euro ($5.4 billion) in state aid earlier this year to plug a capital shortfall. But the European Commission is demanding it toughens up its restructuring plan before it approves it.

See the original article >>

America’s Broken Dream

by Carol Graham

WASHINGTON, DC – The United States has long been viewed as the “land of opportunity,” where those who work hard get ahead. Belief in this fundamental feature of America’s national identity has persisted, even though inequality has been gradually rising for decades. But, in recent years, the trend toward extremes of income and wealth has accelerated significantly, owing to demographic shifts, the economy’s skills bias, and fiscal policy. Is the collapse of the American dream at hand?

This illustration is by Paul Lachine and comes from <a href="http://www.newsart.com">NewsArt.com</a>, and is the property of the NewsArt organization and of its artist. Reproducing this image is a violation of copyright law.

Illustration by Paul Lachine

From 1997 to 2007, the share of income accruing to the top 1% of US households increased by 13.5%. This is equivalent to shifting $1.1 trillion of Americans’ total annual income to these families – more than the total income of the bottom 40% of US households.

Inequality’s precise impact on individual well-being remains controversial, partly because of the complex nature of the metrics needed to gauge it accurately. But, while objective indicators do not provide a complete picture of the relationship between income inequality and human well-being, how they are interpreted sends important signals to people within and across societies.

If inequality is perceived to be the result of just reward for individual effort, it can be a constructive signal of future opportunities. But if it is perceived to be the result of an unfair system that rewards a privileged few, inequality can undermine individuals’ motivation to work hard and invest in the future.

In this sense, current US trends have been largely destructive. Economic mobility, for example, has declined in recent decades, and is now lower in many other industrialized countries as well, including Canada, Finland, Germany, Japan, and New Zealand. An American worker’s initial position in the income distribution is highly predictive of his or her future earnings.

Moreover, there is a strong intergenerational income correlation (about 0.5) in the US, with the children of parents who earn, say, 50% more than the average likely to earn 25% above their generation’s average. Indeed, the US now lies near the middle of the World Bank’s ranking of economic opportunity, well below countries like Norway, Italy, Poland, and Hungary.

Some argue that, as long as the US maintains its economic dynamism, leadership in technological innovation, and attractiveness to immigrants, income inequality is irrelevant. But other pertinent trends – such as failing public schools, crumbling infrastructure, rising crime rates, and ongoing racial disparities in access to opportunities – seem to refute such claims. After all, having some of the world’s top universities means little if access to them is largely a function of family income.

This does not matter only to Americans. In a world in which individuals’ fates are increasingly linked, and effective governance depends on some consensus on norms of social and distributive justice, growing income differentials in one country – especially one that has long served as a beacon of economic opportunity – can shape behavior elsewhere. Without the belief that hard work begets opportunity, people are less likely to invest in education, undermining labor-market development; they may even be driven to protest.

More generally, declining economic mobility in the US could undermine confidence in the principles of a market economy and democratic governance that America has espoused for decades – principles that are fundamental to many countries’ development strategies. As Nobel laureate Joseph Stiglitz has pointed out: “[T]he extent to which the global economy and polity can be shaped in accord with our values and interests will depend, to a large extent, on how well our economic and political system is performing for most citizens.” Given increasing evidence that the system is performing much better for wealthier citizens than for poorer ones, America’s soft power seems bound to erode substantially.

Reducing inequality will require long-term, comprehensive solutions, such as fiscal-policy reforms that reward public investment in health and education without adding disincentives to an already cumbersome tax code. But pursuing such measures requires significant political will, which the US seems to be lacking.

Indeed, given political paralysis at the national level, initiating a constructive debate about an issue as divisive and consequential as inequality will depend largely on the American public. If more people recognized the constraints that inequality places on their future prospects, they would be likely to press policymakers to confront it. This would not only benefit the US; it would have a positive impact on global governance.

Americans have long prided themselves on their country’s status as the land of opportunity, a destination that people have endured immeasurable adversity to reach. A public-education campaign aimed at highlighting the challenges that inequality poses to the very foundation of this reputation is a low-risk first step toward reviving America’s promise.

See the original article >>

Syria’s G-Zero Fate

by Ian Bremmer

NEW YORK – The G-20 has concluded its meetings and dinner discussions of what to do about charges that Syrian President Bashar al-Assad has used poison gas to kill more than 1,400 of his own people. France, Britain, Turkey, and Canada expressed varying degrees of support for US President Barack President Obama’s call for military action, while Russian President Vladimir Putin called US Secretary of State John Kerry a liar and claimed that the evidence against Assad is inconclusive. Russia and China insisted that the US cannot take action without approval from the United Nations Security Council, where they will veto any such move. From the sidelines, the European Union and Pope Francis warned that no “military solution” is possible in Syria.

This illustration is by Paul Lachine and comes from <a href="http://www.newsart.com">NewsArt.com</a>, and is the property of the NewsArt organization and of its artist. Reproducing this image is a violation of copyright law.

Illustration by Paul Lachine

In other words, it all went exactly as expected. The Americans, French, and others continue to push the Russians to accept that Syria’s government has used chemical weapons; the Russians, anxious to protect their Syrian ally, reject the evidence as inconclusive; and the carnage continues. The focus of the fight now moves to the US Congress, where a rare coalition of liberal Democrats and isolationist Republicans will try to block the president’s plans.

Those who would seek to halt the bloodshed have no good options. That is true for Obama, for Europeans preoccupied with domestic political headaches, and for Arab leaders eager to see Assad’s government collapse but unwilling to say so publicly.

British Prime Minister David Cameron says that his government has new evidence against Assad, while Parliament has voted to withhold support for a military response. France is ready to follow, but not to lead. The Arab League wants the “international community” to end the carnage, but without using force. Obama will ask Congress to approve limited air strikes that may deter the future use of chemical weapons, but will not shift the balance in Syria’s civil war.

Assad, Syrian rebels, Americans, Russians, and Arabs all merit criticism. But finger-pointing misses the point: Syria’s situation is the strongest evidence yet of a new “G-Zero” world order, in which no single power or bloc of powers will accept the costs and risks that accompany global leadership. Even if the US and France struck Damascus, they would not end the conflict in Syria – unlike in the former Yugoslavia, where they halted the Kosovo war by bombing Belgrade – for three reasons.

First, there are too many interested parties with too diverse a range of interests. While bombing would give Assad plenty to think about, it would not force his surrender or encourage his allies to turn against him. Nor would it clarify how to restore stability and build a more stable and prosperous Syria, given the need for cooperation among so many actors with conflicting objectives.

The US and Europe want a Syria that plays a more constructive role in the region. Iran and Russia want to retain their crucial ally. Turkey, Saudi Arabia, and Qatar want a Syria that keeps Iran at a distance and does not become a source of cross-border militancy. As a result, Syria is most likely to become an arena in which regional powers, with the backing of interested outsiders, compete for leverage.

Second, the US – the one country with the muscle to play a decisive role – will continue to resist deeper involvement. Most Americans say that they want no part of Syria’s pain; they are weary of wars in the Middle East and want their leaders to focus on economic recovery and job creation. Obama will tread carefully as he approaches Congress and, even as his Republican opponents vote to offer limited support, they will make his life as difficult as possible.

Finally, the US cannot count on its allies to help with the heavy lifting. In Libya, it was relatively easy to bomb Muammar el-Qaddafi’s armies as they advanced through open spaces. By contrast, bombing Damascus – which remains a densely populated city, despite the flight of refugees – would undoubtedly kill a significant number of Syrian civilians.

As in the Balkans a generation ago, when Western leaders moved to end the bloodiest European conflict since World War II, the French are ready to send planes and pilots to Syria. But Britain is speaking with more than one voice on the issue. Moreover, most of Europe’s leaders are preoccupied with the domestic fallout of the eurozone’s ongoing struggles. In Germany, for example, Chancellor Angela Merkel will avoid unnecessary risks ahead of the upcoming general election.

Likewise, Arab leaders – mindful of the turmoil in Egypt, rising violence in Iraq and Libya, and the threat of social unrest within their own countries – will not openly invite Western powers to bomb a Muslim country. Even Canada will sit this one out.

This G-Zero problem will not last forever. Eventually, the political wildfires that are allowed to burn out of control will threaten enough powerful countries to force a certain level of cooperation. Unfortunately for Syrians, their suffering alone will not be enough.

See the original article >>

Microsoft Hell

by Vitaliy Katsenelson

As a value investor I used to spend a great deal of time in Microsoft hell – on one hand there was the company with enormous cash flows, an incredible return on capital, a huge moat, a cash-rich balance sheet, and trading at single-digit multiples (if you adjust for cash).  But on the other hand it threw away cash away for multi-billion-dollar acquisitions, followed up by inevitable write-offs.  Its founder and chairman was not interested in running the company, so he delegated to his best friend, who has been wrong at every single technological inflection point, and quite frankly not a very good leader.  Every few years the company airbrushes its old products (think of Office), calls it an upgrade, and goes on charging subscription fees; but new products quite frankly … suck.  Microsoft’s competitors are getting better, and while a strong balance sheet helps in bad times, it is not a competitive advantage against competitors that have even more cash.

I was stuck in the middle– Microsoft was too cheap, but if it kept doing what it was doing it would become a declining annuity, at best.  Finally last year, after I previewed Windows 8, we sold the stock and bought Oracle – it has all the aforementioned positive Microsoft’s qualities (competitive advantage, recurrence of revenues, balance sheet, etc…) with one significant bonus: it is run by Larry Ellison.

Larry owns a third of the company.  He is the third-richest person in the world.  Normally this would not matter, but Larry is extremely competitive and he wants to be the richest person in the world.  The only way for him to get there is by increasing the value of Oracle.  With Larry running the company I don’t have to worry about dumb acquisitions, dilutive stock options, or share repurchases that will destroy value.  Oracle is facing competition, but Larry is very aware of it and has been fighting different competitors for decades.  Larry is on every earnings conference call.  (By the way, if you have never listened in on Oracle’s conference calls, I highly recommend it – very entertaining).  Finally, Oracle’s valuation is similar to Microsoft’s.

Back to Microsoft.  By the time I finished writing the following article (read article here) I had achieved this clarity: unless a new outside CEO is brough in to fix the Microsoft culture, Microsoft as a stock is dead to me.

One more thing: Samsung introduced their watch on Wednesday. I think that is great news for Apple shareholders.  The watch looks like it came straight out a 1990s Timex catalog; they have set the bar for Apple’s watch very low.

See the original article >>

Quick & Dirty

by Marketanthropology

We're running low on available time today - but wanted to put out a few charts we've kept our eyes on this week. A few of the charts are duplicates - with alterations to scale.

See the original article >>

Is The U.S. Dollar Set To Spike?

by James Gruber

Does America’s energy boom change everything?
Possible impact on Asia & beyond
Potential problems with thesis
Conclusions

So markets wait with bated breath on the words of a bearded academic-turned-central-banker on September 18. Bond king, Bill Gross of Pimco, probably has it right suggesting Ben Bernanke and his Fed have already agreed on a small cut to QE even though economic data out of the U.S. has shown only marginal improvement. I’d add that that Bernanke and his minions would remain concerned with rising bond yields and interest rates and if both head higher in the months ahead, all bets on further QE tapering are likely to be off. Perhaps the word “re-tapering” may soon enter the financial lexicon?

Today I’d like to step back from the “will he or won’t he taper” debate and look at an interesting, and still minority, view developing that there are structural factors beyond QE tapering which may drive both the U.S. dollar and U.S. bond yields higher in coming years. The argument goes that an energy boom in America will result in a further decline in the U.S. trade deficit, reducing the number of U.S. dollars being supplied to the global economy and thereby creating a scarcity of U.S. dollars which will inevitably push the currency higher. A reduced U.S. trade deficit will also result in contracting foreign exchange reserves for overseas countries, reducing foreign demand for U.S. Treasuries and pushing up government bond prices which will help the dollar further.

Don’t worry if you didn’t get the full thread of the argument as I’ll lay it all out for you below. Suffice to say though that if the view is correct, it’ll have enormous ramifications, including for our neighbourhood of Asia. For instance, it may mean the recent currency turmoil in Asia is only a taste of things to come (higher U.S. yields leading to reduced flows into Asia ie. tighter liquidity).

I don’t happen to agree with much of the argument and will outline why. But it seems like a debate worth having as it goes to the heart of some of the key issues which will drive economies and markets going forward.

Does America’s energy boom change everything?
Here’s a theory: the majority who read my newsletter on a regular basis agree with most of what I have to say. Don’t worry, I’m not trying to be arrogant or belittle but just to point out that science suggests that people primarily read things which confirm their pre-existing biases and views. It’s called confirmation bias and everyone does it to an extent.

Today is my attempt to shake things up. To offer a well thought-out view which is contrary to my own and perhaps yours. This particular view has made me question and re-examine some of my beliefs and perhaps it can have the same effect on you.

The view is that there are structural trends which will lead to a higher U.S. dollar and higher U.S. interest rates. It’s a line that’s been pushed by some stock brokers over the past year. But financial blogger, Charles Hugh Smith is perhaps its most thoughtful proponent.

In his most recent article, “America’s Energy Boom and the Rising U.S. Dollar”, Smith puts forward a strong case. He argues that to understand the trends which will lead to a higher dollar, you need to appreciate why the U.S. currency is the world’s reserve currency. And he suggests that it’s because the U.S. is willing to provide the world with an extra supply of the dollar to fulfill global demand for the reserve currency and thereby cause a trade deficit (where imports exceed exports). Put another way, the U.S. must export U.S. dollars by running a trade deficit to supply the world with dollars to hold as reserves and to pay debt denominated in dollars.

Of late though, the U.S. trade deficit has been falling. In June, the deficit hit four-year lows, before increasing again in July. The fall is primarily attributed to America’s energy boom. The U.S. has been able to provide more of its own energy. That’s significant because oil imports account for 40% of America’s US$750 billion annual trade deficit. And the importing of oil has been the main reason why the U.S. has been running trade deficits for decades. Remember too, trade deficits negatively impact GDP.

TradeDeficitJuly2013

Anyhow, Smith argues that the American energy boom will lead to further falls in the U.S. trade deficit. A lower deficit will mean fewer U.S. dollars being exported to the global economy. Basic supply and demand suggests fewer U.S. dollars in circulation will push the value of those dollars up.

Smith goes on to say that the uptrend in the U.S. dollar over the past 18 months has aligned with a rise in U.S. energy production. He suggests that’s not coincidence, but causation: the latter is causing the former.

Possible impact on Asia and beyond
If that’s right, it will turn the trend of recent decades, featuring growing U.S. trade deficits and a lower U.S. dollar, on its head. For America, it will be positive for the economy, as Smith explains:

“As the dollar strengthens, the U.S. will pay less for imported energy and earn more for exported energy. This decline in energy costs will ripple through the real economy, offsetting any decline in exports. A strengthening dollars lowers the cost basis for all goods and services originating in the U.S.”

Smith acknowledges though that a strong U.S. dollar won’t be good for listed U.S. companies. That’s because more than 50% of their earnings come from overseas. In other words, their profits will be negatively impacted with the higher dollar reducing earnings from overseas operations.

When it comes to the effect of a higher U.S. dollar on the rest of the world, Smith loses me. He argues other countries will also benefit from an increasing dollar as it will increase the value of their existing foreign exchange (forex) dollar reserves, enlarging the base for their own credit. But he acknowledges future forex reserves will start to contract with a higher dollar.

Won’t the latter more than offset the former? If so, as I suspect, it’d be negative for the likes of Asia. Contracting forex reserves mean Asian countries, particularly China, would start selling local currencies to maintain currency pegs against the U.S. dollar. Previously China has been printing yuan to maintain the peg which has created inflation at home and supported local asset prices (think real estate, for instance). Contracting forex reserves will result in the opposite occurring.

Declining forex reserves though mean there’ll be reduced demand for U.S. treasuries and potentially higher U.S. bond yields, which could well feed back into a higher U.S. dollar.

The other issue is the impact of a rising U.S. dollar on commodities. Traditionally, an increasing dollar has been seen as commodity-negative. But Smith thinks for gold least, there’s no evidence of a correlation between the dollar and gold prices. He seems to have a point here, but for other commodities, less so. Broadly falling commodity prices would be another deflationary force for the likes of Asia.

Potential problems with thesis
It seems to me that there are a couple of other, broader potential issues with the view, namely:

1) Whether the boom in unconventional oil and gas in the U.S. is overstated, particularly in terms of the probable economic gains in the short-term. It should be noted that a recent study by IHS Global Insight found that the increased energy production had lifted disposable income in the US by US$1,200 in 2012. IHS suggests that figure will rise to more than US$2,000 by 2015. Call me a sceptic, but any forecasts are likely highly dependent on oil prices. Lower oil prices would substantially lower the gains.

2) More importantly, the view largely discounts the role of QE in money creation and lowering the dollar as well as bond yields. Smith counters the influence of QE on the dollar by suggesting that base money isn’t rising in the U.S. because banks are holding onto the printed cash and not lending it out. But QE is playing a role in demand for bonds and keeping yields low. Any rise in yields would surely have a dampening effect on the U.S. economy (it’s already impacting the housing sector). And a further yield rise would therefore likely be met with more QE. Suppressed bond yields would cap the value of the dollar.

Conclusions
In sum, I remain unconvinced that an energy boom will drive a U.S. economic recovery. And though I see a case for a modestly higher dollar on slower global economic growth, it seems that lower rather than higher U.S. bond yields are likely, for the following reasons:

1) Reduced U.S. inflation expectations. Inflation plays a central role in long-term interest rates. All current signs point to low inflation (disinflation in economic parlance) given a higher dollar and lower commodity prices.

2) GDP in the U.S. has seen the slowest growth of any economic expansion since 1948. Post-war growth has averaged 3.5%, compared with current GDP growth of 2.5%. Nominal GDP growth (real GDP growth plus inflation) drives bond yields and therefore growth has to quicken from here to justify higher yields.

3) U.S. consumers are still paying down debt and will need to do so for many more years. As economist David Levy of the Jerome Levy Forecasting Center has demonstrated, private sector leverage in the U.S. remains very high, despite what the bull market propagandists tell you. Given consumption accounts for 70% of GDP, stronger economic growth from here seems a stretch. An oil boom won’t mitigate this headwind.

US household debt

4) The history of U.S. and Japanese balance sheet recessions suggests that bond yields bottom around 13 years following a crisis, meaning we should expect lower bond yields for several years to come.

US bonds vs previous panic yrs

And that’s a wrap for this week.

See the original article >>

SPY Trends and Influencers September 7, 2013

by Greg Harmon

Last week’s review of the macro market indicators suggested, as September began to look for Gold ($GLD) to continue to bounce in its downtrend while Crude Oil ($USO) rose with a chance of consolidation. The US Dollar Index ($UUP) looked to be reversing higher while US Treasuries ($TLT) were biased higher in the short term in their downtrend. The Shanghai Composite ($SSEC) looked to continue to consolidate with an upward bias as Emerging Markets ($EEM) were poised to move lower. Volatility ($VIX) looked to remain subdued but creeping higher keeping the wind at the backs of the equity index ETF’s $SPY, $IWM and $QQQ, despite the moves lower last week. Their charts suggested that the downside is not over yet though, with the SPY and IWM looking lower while the QQQ looked the strongest and most likely to just consolidate instead of falling.

The week played out with Gold ripping higher while Crude Oil also moved up, but consolidated some gains later in the week. The US Dollar broke lower and found a bottom while Treasuries rebounded to fill upside gaps. The Shanghai Composite continued to consolidate in a tight range at the recent lows while Emerging Markets gave up some of their gains, perhaps rolling over. Volatility bounced off of the lows but remained subdued. The Equity Index ETF’s peaked with the SPY and QQQ making new multi-year highs before all gave back some ground late in the week. What does this mean for the coming week? Lets look at some charts.

As always you can see details of individual charts and more on my StockTwits feed and on chartly.)

SPY Daily, $SPY
spy d
SPY Weekly, $SPY
spy w

The SPY moved higher out of consolidation this week, falling just short of the 50 day Simple Moving Average (SMA). The move closed one gap above, leaving one left unfilled. The Hanging Man candle Friday, if confirmed lower Monday, could signal a reversal. The Relative Strength Index (RSI) on the daily chart is flattening at the midline, not a sign of strength to push higher, but the Moving Average Convergence Divergence indicator (MACD) is crossing higher, which is a positive sign. On the weekly view the price continues to hold above the rising trend support from the November low with a RSI that is turning higher. The lower low in RSI combined with the higher low in price, if holds, would confirm a RSI Positive Reversal with a target of 178.29. The MACD on this timeframe though is turning decidedly lower, suggesting the downside is not over. There is resistance higher at 166.50 and 167.45 followed by 169 and 170.97. Support lower comes at 164.50 and 163 followed by 161.60. There is a mixed picture on both timeframes. Consolidation with Short Term Upside Bias.

Back to a full week after the holidays Gold looks to continue lower in the short term uptrend while Crude Oil marches higher. The US Dollar Index is biased higher in the long consolidation while US Treasuries are poised to continue lower. The Shanghai Composite looks to continue higher while Emerging Markets join it after a strong reversal. Volatility looks to remain subdued keeping the bias higher for the equity index ETF’s SPY, IWM and QQQ. The charts themselves show that the QQQ is very strong looking for new highs while the IWM is next and the SPY the weakest of the bunch. Use this information as you prepare for the coming week and trad’em well.

See the original article >>

Gold Daily and Silver Weekly Charts - Holding the Line On a Breakout

by Jesse

Today was filled with cross currents, as the Non-Farm Payrolls report came in light, and looked even worse if you peered into the details of it.
The unemployment rate is less meaningful now because of the large number of people who have been long term unemployed and are falling off the unemployment benefits rolls. Labor Participation Rate and average workweek are therefore a bit more important.  And things are not looking good because the jobs that are being created tend to be low wage and often part time.
There is no real sustainable recovery, except for a few sectors that were ironically at the heart of the financial crisis five years ago: FIRE sector and the Beltway Elites. Except for some regional pockets of recovery, most everyone else is just getting by.
As you know the failure to reform a broken system is very high on the list of policy failures. Close behind are the Fed's trickle down stimulus approach, and the sequester and failure to act meaningfully on the fiscal side by the political class.
But the more jarring event today was Putin's strong stand on Syria. The case the US has been making is weak, and allies are few. It seems like the Obama Administration is listening to a few groups and advisers, and is tone deaf to what the mass of the public and the rest of the world is saying. This is not to say that Putin is right.
Rather, Putin is playing chess, and Washington is playing checkers, and also playing footsie under the table with the usual special interests, and ignoring the persuasion that must accompany any movement to military action. And the explanations and evidence that must accompany a grave decision were facing a high bar given the context of a war weary public that feels, with much justification, that their politicians are not listening to them, and are quite willing to say whatever it takes to get their way.
When a former US president, Jimmy Carter, says that the country no longer has a functioning democracy, it is hard to make a case that you just didn't know things were that bad. Well, they are, and they are getting worse with every week that passes and the political class continues to muddle through a credibility trap of their own making.
So in times of uncertainty and deception, when it is difficult to correctly price risk, people seek safety in certainty where they can obtain it, and that involves places a percentage of their wealth in things with less counterparty risk.
And so we saw a rally in gold and silver, although there is quite an effort behind the scenes to keep them from breaking out. They will break out, eventually, and the shorts are going to be hard pressed to deliver the bullion which has been rehypothecated many times. And when this does result in a market dislocation, the economists and the politicians and the regulators will stand open mouthed and say, 'who could have known?'
So let's see what happens.  Things are not all that bad from an historical perspective, unless you have a somewhat romantic view of the past.  My grandparents and parents faced things that were just as bad or worse,  and I myself grew up during the Cold War, the Cuban missile crisis, and Vietnam, and riots that tore cities apart.  
I remember as a young boy riding a public bus with an overhead advert of Khrushchev pounding a shoe on the table saying, "We will bury you."  Now we have the Tea Party and would be demagogues, and then we had the Dixiecrats and Joe McCarthy.  And three of our greatest lights for hope, John F. Kennedy, Martin Luther King, and Robert F. Kennedy, were all brutally killed by assassins bullets within a few years. 
If you were not a part of it, it is hard to imagine what it was like.  Some of my friends say that we are doomed, and things are much worse now than they ever were.  Well, they are like this for most generations, that face difficult, almost seemingly insurmountable obstacles.  And yet life goes on.
But certain times call for certain actions, and now is a good time to look to your portfolios, and to remain calm and discerning in your thoughts as you take whatever measures that you can to not become a part of the problem, and look to your families and friends.
Have a pleasant weekend.

See the original article >>

The Week Ahead: How Much More Pain Can Bond Holders Expect?

by Tom Aspray

Investors were bombarded by economic data after the long Labor Day weekend, ending with the widely anticipated monthly jobs report on Friday. It came in weaker than expected, though the overall unemployment rate dropped. The downward revisions of the previous months were the real story, as they suggest that the economy may not be strong enough yet for the Fed to change its policy.

The gyrations after the report were not surprising, as a whole cottage industry has developed around trying to train traders on how to trade the report. To give you an idea of how crazy the markets were, the yield on the 10-Year T-Note had a range of 2.972% to 2.864% in the first five minutes after the report. The S&P futures had a range of 1656.25 to 1663.50 in the same five minute period.

chart
Click to Enlarge

The more important question for most in today’s current environment is, how much more pain can bond owners expect? It has been a rough year for bond holders, as the chart above shows the strong rise in the yield on the 10-Year T-Note, which closed Thursday at 2.977%.

At $11.3 trillion dollars, the Treasury market is the world’s largest. Flows out of both, taxable bond ETFs, and bond mutual funds, reached $50 million in June. The leading bond benchmark, the Barclays U.S. Aggregate Bond Index (AGG) is showing a negative return for the first time since 1994.

In the May 27  Eyes on Income, I noted that the upside target from the reverse head and shoulders bottom formation on the 30-Year T-Bond yield chart was in the 4% area. The yield as risen from 3.205% to a high of 3.882% last week.

chart
Click to Enlarge

The monthly chart of the 10-Year T-Note Yield shows that the downtrend from the 2007 high, line b, has been broken. The upside target from the bottom formation is in the 3.10-3.12% area. Many big bond holders have been quoted as saying they were going to start buying T-Notes when the yield reaches the 3.00-3.10% area.

This could cause a short-term pullback in yields in line with the short-term technical outlook with initial support now in the 2.82-2.85% area. There is more important support in the 2.72% area.

Any pullback should be followed by another rise in rates. The long term downtrend is now at 3.667% and a move above this level will confirm a major trend change. The next major resistance for yields is in the 5.186% area.  I would not be surprised to see the yield on the 10-Year T-Note close the year well above 3.00%.

There were plenty of warning signs for bond holders at the start of the year, as the high yield market became very overextended. At the end of May (“4 Ways to Summer-Proof Your Portfolio”)  I focused on the completed H&S top in the Vanguard Total Bond Market Index (VBMFX) which is one of the largest bond funds. It has dropped 3.7% since the end of May.

One of the hardest hit funds has been Bill Gross’s Pimco Total Return Fund (PTTRX),  as its assets have dropped from $292 billion at the end of April, to $251 billion at the end of August. This was due to a combination of withdrawals and declining prices.

chart
Click to Enlarge

There were $7.7 billion of net outflows in August from PTTRX according to Reuters. The monthly chart shows that the long term uptrend, line a, was broken at the end of May (point 1). There was further confirmation of a top at the end of July (point 2), when additional support at line b, was broken. The top formation has major downside targets in the $9.86-$10.00 area.

Global tensions regarding Syria are still running high, while the economic outlook for the Eurozone continues to improve, as the ECB raised its 2013 growth forecasts. This however was followed by cautionary words from the ECB’s Mario Draghi, who commented “These shoots (of recovery) are still very, very green.”

Other than the disappointing jobs data on Friday the rest of the economic news last week was quite promising for the manufacturing sector. The ISM Purchasing Managers Index rose to 55.7 which was the best reading since 2011.

chart
Click to Enlarge

The chart of the PMI, as well as those of new orders and production, have all broken their downtrends, consistent with an improvement in manufacturing. The strengthening of the Euro zone economies have helped. Factory orders last Thursday were down, but better than expected, and the ISM Non Manufacturing Index shot up to 58.6, which is the best reading since the peak of the last recovery.

The economic calendar is fairly light this week with jobless claims and Import and Export Prices out on Thursday.  Friday we get the most reports, including The Producer Price Index, Retail Sales, the University of Michigan Consumer Sentiment and Business Inventories.

What to Watch
So far, the correction in the stock market has been less than I expected, as the Spyder Trust (SPY) from the August high to low was down just 4.6%. Though the technical studies did improve with last week’s higher close, they have not yet all turned positive. However, in reviewing quite a few charts I am seeing more that appear to have held support and are looking much better.

This suggests that one should start to concentrate on buying individual issues, even though the overall market may continue to be choppy. It is still vulnerable to further downdrafts as we head into the FOMC meeting next week. It looks like the first scenario I outlined two weeks ago is looking more likely, but so far, the advance is not broadly based.

chart
Click to Enlarge

One of the most positive signs is the action of the number of S&P 500 stocks that are above their 50-day MAs. This chart shows a 5-day moving average of the S&P stocks above their 50-day moving averages. It has dropped  below 40 and now turned up, point d.  It shows a similar pattern as was evident at the late June lows, point c.

The market reached much more oversold levels at the June and November 2012 lows, points a and b. This technical approach was discussed in a recent trading lesson. Also a positive is the OBV analysis on both, the PowerShares QQQ Trust (QQQ), and the iShares Russell 2000 Index (IWM) have turned positive.

On the negative side, we still have bearish divergences in several of the key advance/decline lines, and also, the sentiment is not negative enough in my view. There are a few analysts who were telling everyone to buy at any price near the recent highs that have now turned negative. This is a good sign.

Individual investors have continued to get more positive about the market as the bullish%   rose from 28.9% on August 22 to 35.5% this week. The number of bears has declined from its high of 42.8% two weeks ago.

The financial newsletter writers have gradually become less bullish, as they are at 37.1%, down from 52.1% on July 17. The number of bears is quite low, still at 23.7%.

The NYSE Composite has rallied nicely after testing the minor 50% Fibonacci retracement support at 9246. The close on Friday was just below the previous swing high, with next resistance at 9533, line a. The wide range and higher close after the jobs report is a positive sign.

chart
Click to Enlarge

The McClellan oscillator broke its downtrend from the early July highs on August 22 and then rallied back to the zero line. It held up much better than prices, as it was only at -70 as the NYSE was making its correction low. This is not a typical bottom formation for the oscillator but has now clearly moved above the zero line.

The NYSE Advance/Decline line closed the week above its WMA, but is still below the bearish divergence resistance at line c. A move above this resistance would be a sign that the worst of the selling was indeed over.

S&P 500
The Spyder Trust (SPY) also had a very wide range on Friday, as it dropped as low as $164.48, before rebounding  to close higher for the week.

There is minor resistance now at $167.30 and then stronger at $168.29.

The close was back above the 20-day EMA at $165.95. There is trend line support now at $163.17, with the daily starc- band at $161.88. There is more important support now in the $160 area.

The daily OBV rallied sharply late last week, moving well above its WMA, and clearing the short term resistance at line f. A pullback to the rising WMA should be a good time to buy.

The daily S&P 500 A/D line has broken its downtrend, line g, after holding above the longer term support at line h. It is well above its WMA, which is now starting to flatten out.

Dow Industrials
The SPDR Dow Industrials (DIA) is trying to form a bottom in the $147-$147.77 area, as it tested the lower weekly starc- band a few weeks ago.

The monthly pivot is at the $150.59 area, with further resistance at $153-$153.60.

The technical studies (not shown) are still acting weaker on the Dow, as the relative performance analysis indicates it is lagging not leading the S&P 500. Given the overseas exposure of many of the Dow stocks, this could change if the Euro zone continues to improve. The analysis of the most oversold Dow stocks did reveal that several are not far above important support.

chart
Click to Enlarge

Nasdaq-100
The PowerShares QQQ Trust (QQQ) has held in a narrow range over the past six weeks, as it held above the August monthly pivot at $74.44. It is now very close to making a new closing high and has certainly become a market leading sector.

The monthly pivot for September is at $75.90 for September with the projected high at $78.22. This is just above the daily starc+ band at $78.06 with the weekly at $80.41.

The daily OBV has overcome its bearish divergence resistance, as it closed Friday well above the August highs, line b.

The daily Nasdaq-100 A/D line has moved back above its WMA, but is still well below the bearish divergence resistance at line c. A strong move above this level will confirm the price action. The A/D line did hold the support from the June highs.

There is first support at the rising 20-day EMA, which is at $76.11.

Russell 2000
The iShares Russell 2000 Index (IWM) has also been acting quite well, as it has held the support in the $100 area and then closed above the last six day’s high on Friday, gaining close to 2.0% for the week.

There is next resistance at $103.68, and a close above the high at $104.68 should confirm that the correction is over.

The daily OBV has moved well above its flat WMA and it acting quite positive. The Russell 2000 A/D line tested its longer term uptrend, line g, several times during the correction, but has now turned higher. It is still well below the bearish divergence resistance at line f, which needs to be overcome to confirm a new uptrend.

See the original article >>

The Only Chart Of Employment That Matters

by Lance Roberts

The most recent release from the Bureau of Labor Statistics on employment for the month of August was mostly disappointing.  Despite there being less jobs created than originally thought coming in at 169,000 both previous months of "super jobs reports" turned out to be not so "super" after all.  Most importantly, and the only thing that really matters, is that the labor force participation rate fell to the lowest level in the last 35 years.

Despite much attention to the headline number, where hope rests with each passing months job report that an economic recovery has arrived, the reality is much different.  With roughly 1 out of 3 people no longer counted as part of the work force, 1 out of 3 individuals dependent on some sort of social support program, and over 17% of personal incomes comprised of government transfers it is not hard to see why hopes of recovery remain high.

The only chart of employment that really matters is the number of full-time employees relative to the working age population.  Full-time employment is what ultimately drives economic growth, pays wages that will support household formation, and fuels higher levels of government revenue from taxes.  If the economy was truly beginning to recover we should be witnessing an increasing number of full-time employees.  Unfortunately, that has not been the case.

Employment-FullTime-Claims-090613

As I stated in "The Labor Hoarding Effect:"

"Since the end of the recession businesses have been increasing their bottom line profitability by massive cost cuts rather than increased revenue.  Of course, one of the highest 'costs' to any business is labor. 

The problem that businesses are beginning to face currently is that while they have slashed labor costs to the bone there is a point to where businesses simply cannot cut further.   At this point businesses have to begin to 'hoard' what labor they have, maximize that labor force's productivity (increase output with minimal increases in labor costs) and hire additional labor, primarily temporary, only when demand forces expansion.

The issue of 'labor hoarding' also explains the sharp drop in initial weekly jobless claims.  In order to file for unemployment benefits an individual must have been first terminated, by layoff or discharge, from their previous employer.  An individual who 'quits' a job cannot, in theory, file for unemployment insurance.  However, as companies begin to layoff or discharge fewer workers the number of individuals filing for initial claims decline.   However, the mistake is assuming that just because initial claims are declining that the economy, and specifically full-time employment, is markedly improving."

The problem is that employment gains are significantly lagging population growth.  In August the population of working age individuals, 16 and older, rose by 199,000 while employment only gained 169,000.  In other words, the increases in population lead to incremental demand on the economy and businesses respond by hiring only to meet demand increases rather than hiring on expectations of future growth.

With the onset of the affordable care act beginning in the next few months combined with higher taxes, interest rates and energy costs; it is likely that we will see weaker economic growth in the months ahead which will continue to weigh on employment gains.  The problem is that stronger economic growth is needed to drive employers to increase levels of full-time employment but it is full-time employment that leads to stronger economic growth.  How you solve that puzzle should be the sole focus of our economic policy makers.

See the original article >>

Follow Us