Wednesday, April 20, 2011

Silver at its peak, what should be the ideal strategy?

By Amrita Mashar

In 2010, Silver performed much better than other precious metals in the international market with prices rising by an surprising 80% rise which is two and half times the rise in price of Gold

In the first quarter of 2011, Silver’s price has increased at a steady 40 percent. Along with being considered a safe investment, the relatively low supply of the metal as compared to the high demand has also contributed to the firm increase in Silver prices.

Main reason for investment in Gold and silver is the continuous stability witnessed in the global market. Liquefaction is also an easy process for Gold or Silver bars, jewelry, ETF and coins. Do note that purity of the mineral is of utmost priority and should be given its due importance in ongoing time.

In market reports it has been observed that due to strong Industry demand in US and Asia will be key factor for driving growth in worldwide market. Healthy developing country demand especially in Asian market such as China and India will also be important factor.

China’s silver consumption already accounts for 70% of the global total of industrial use, and its middle class isn’t even close to reaching its spending potential. Fundamentally, Silver has strong upside momentum till 100 Dollar. Industry demands are key driver for movement in Silver price. Silver uses of total consumption in 53 % in electronic equipment, 24 % jewelry, 7 % coins, 13% photos and as 2% as investment purpose .

The talk is there in market that Silver is technically overbought and it may correct any time. But from last few months it have been observed that short term correction can be emerge as opportunity for long term buying.

My view is there in current environment its best option for return is to invest your money is silver. Bullion commodities provide protection again the inflation and also with higher return in long run. Those who are in short from 40 Dollar since beginning of year 2011 can clear out their position in next month. Silver price expected to correct till 41 Dollar before reach to all time high levels in coming months.

The price ratio of Gold versus Silver has been dropping in the last couple of years in favor of the white precious metal. Although the drop seems overdone and the ratio set for upward recoil, the technical damage caused by breaking through the 40 level has been done. Analysts are now predicting silver prices can reach as high as $100 in 2011 and $250 by 2015. In conclusion we can say that for coming months “Gold is strong and Silver is strongest”.

Stock Market Elliott Wave Patterns, Quick Primer on OEW


We received a request over the weekend to provide a bit more detail about OEW labeling. OEW applies most of the same terminology as standard EW with one major exception. We added a Major wave between the Primary and Intermediate degrees. It makes more sense, to us, that a Minor wave should be complemented by a Major wave with an Intermediate wave in between them. Our labeling scheme is provided below:

Labeling: LEGEND
tentative labeling … green
Supercycle … shocking blue … SC
Cycle … light blue … C
Primary … blue … I
Major … black … 1
Intermediate … purple … i
Minor … dark blue … 1
Minute … dark green … i
Micro … orange … 1
Nano … gray … i
Pico … red … 1

We provide an example of OEW labeling in a bull market with the chart below. This is the Supercycle wave between 1932 and 2007: labeled SC1. Notice Cycle waves [1] and [2] completed between 1937 and 1942, then Cycle waves [3] and [4] ended between 1973 and 1974. Cycle wave [5] completed at the Supercycle wave SC1 top in 2007. Now notice, Cycle wave [1] was simple, and Cycle waves [3] and [5] both subdivided into five Primary waves. In each of these extended Cycle waves, both Primary waves I and V were simple but Primary wave III subdivided into five Major waves. The last observation is that Major wave 3, of Primary III, of Cycle [3] subdivided into five Intermediate waves. While Major wave 5, of Primary III, of Cycle [5] subdivided into five Intermediate waves. This chart offers an example of how bull markets unfold over short and very long periods of time.


The next chart displays the typical OEW bear market labeling. It has been our observation that all bear markets are corrections to larger bull markets and thus unfold in ABC patterns. Simply put, bull markets consist of five wave advances, and bear markets consist of three wave declines. There are no five wave bear markets, nor three wave bull markets. Illustrated in the chart below is the 2007-2009 bear market consisting of three Cycle waves [A], [B] and [C], (which ended at the SC2 low). Cycle waves [A] and [C] each divided into five Primary waves. Therefore the entire bear market was a zigzag (5-3-5) of Supercycle degree. Naturally this bear market could have formed a flat (3-3-5), a triangle (3-3-3-3-3), or a complex three … which are all standard correction EW patterns.


To summarize, OEW added a Major wave in between the Primary and Intermediate waves. OEW also states that all bear markets are three wave corrections to larger bull markets. Finally, we state all waves are determined quantitatively by OEW, and the appropriate label is placed at the point of wave termination. We can only place final labels at the end of completed waves, not where we think they have ended. In other words, we do not use the market waves to fit our count, we count and label the waves the market creates. Best to your trading/investing.

See the original article >>

Monetary System is Like a “Drunken Sailor”


The below is an excerpt from Richard Russell’s excellent daily newsletter, Dow Theory Letters.

“A clearer picture is seen in the precious metals market. The bull market in the precious metals is underscored by the ominous weakness in the Dollar Index. I say “ominous” because the dollar weakness is setting off international demands for a new reserve currency. If the US dollar loses its status as the world’s reserve currency, it will be a disaster for the US, which can print “money” in the same currency that its debts are denominated in. If the US has to borrow foreign currency to cover its debts, interest rates will head higher.”

“Once the US mountain of debt is subject to rising interest rates, the game is over, and the compounding cost of carrying the Federal debt will throw the nation into virtual bankruptcy, an emergency that the US can’t print itself out of.”

The chart that no one wants to look at…It’s the Dollar Index, heading inexorable lower, perhaps to test it record low of 70.50. At stake — the reserve currency status of the “almighty dollar.” Already there are plans for a new reserve currency made up perhaps of the euro, the French franc, the renminbi and gold.

Russell prediction — sooner or later (probably sooner) gold will re-enter the world monetary system.
The current monetary system based on competing fiat currencies is like a drunken sailor who is unsteady on his feet while trying to adjust the ship’s broken compass.

See the original article >>

Sector Relative Strength: Days of Outperformance

by Bespoke Investment Group

Typically when we look at the relative strength of sectors, we compare the performance between a sector and the S&P 500 over a period of months or years. While this is generally the preferred way to look at relative strength, it does have its shortcomings. For example, if a sector has a big move on one day, that day's move will skew the overall relative strength measurement for as long as the day is included in the time frame analyzed. It's a minor issue, but one worth noting nonetheless.

With that in mind, we analyzed the relative strength of sectors using a slightly different approach. In this method we looked at the number of days (in percentage terms) over a 50-day rolling period where a sector's single-day return was greater than the one-day return of the S&P 500. In the charts below, we have provided the relative strength charts under this method for each of the ten S&P sectors. For each chart, high readings indicate that the sector has frequently outperformed the S&P 500 on a daily basis, while low readings imply that the sector routinely underperforms the S&P 500 on a daily basis.

Interestingly, as of today eight sectors have outperformed the S&P 500 on a daily basis at least 50% of the time over the last 50 trading days. The only two sectors that have underperformed the S&P 500 more often than they have outperformed are Financials (38%) and Technology (32%). However, given the fact that these are the two largest sectors in the market, any weakness certainly makes its presence felt. While Technology currently has the weakest frequency of outperforming the S&P 500 over the last 50 days, Energy and Health Care are tied for the highest rate of daily outperformance at 62%.


See the original article >>

Customize Your Earnings Season Calendar

by Bespoke Investments Group

While earnings season has been going on since last Monday, only 3% of total US companies have reported their quarterly numbers. As shown below, earnings season will really kick into gear tomorrow, however, when 101 companies are set to report. Only 78 companies have reported thus far. Next Thursday and Thursday, May 5th will be the biggest earnings report days with 324 and 349 companies reporting, respectively.

Below are the key companies set to report for the remainder of this week. As shown, IBM, INTC, ISRG, and YHOO all report after the close today. ISRG has historically been the best of this bunch in regards to earnings reports. Since its IPO, ISRG has beaten earnings estimates 93% of the time and averaged a whopping gain of 6.93% on its report days. Intel, on the other hand, has averaged a decline of 1.02% on its past earnings report days.

Over at Bespoke Premium, we provide members with an in-depth earnings season calendar that shows all of the companies set to report throughout earnings season. For each stock, we provide info on earnings and revenue beat rates, guidance, and historical price reaction to past reports. The calendar is a very useful tool for regular market followers. Premium Plus subscribers have the ability to request a custom earnings season calendar for stock in their portfolios or on their watch lists.


See the original article >>

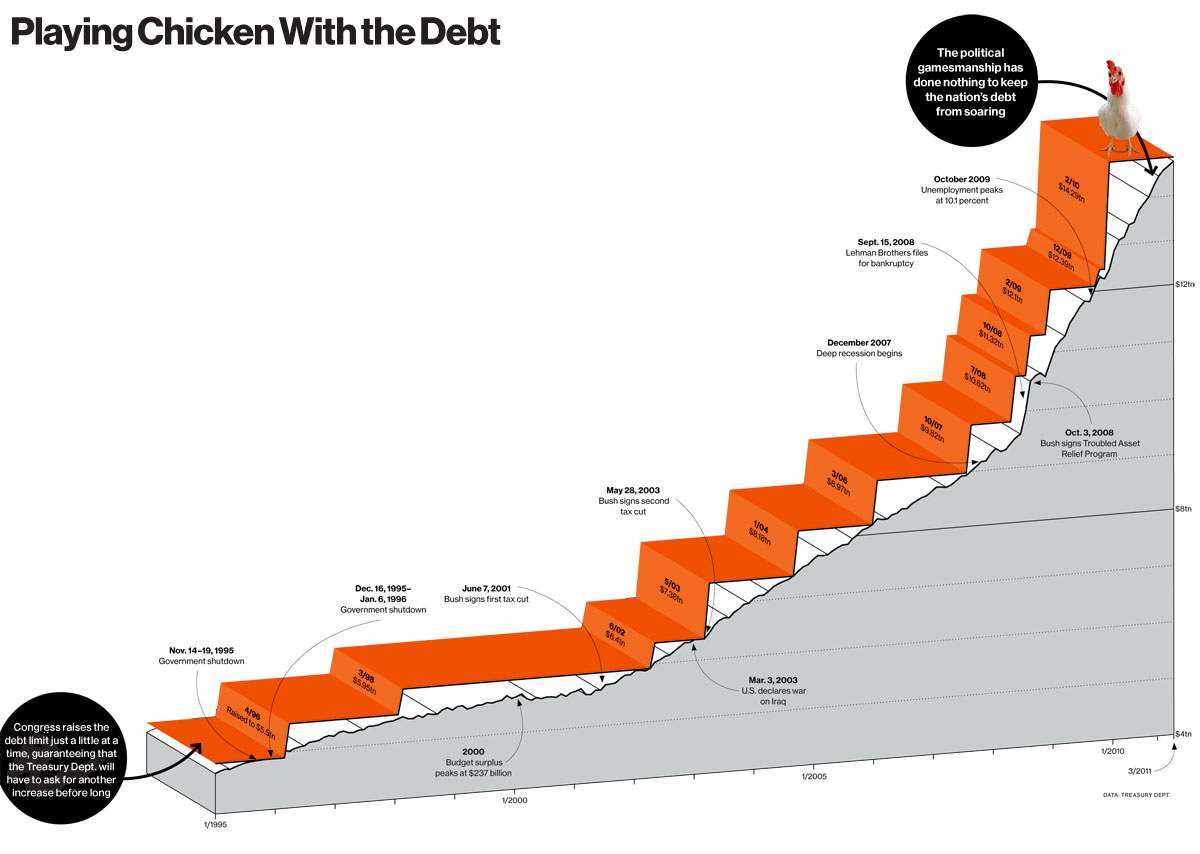
Playing Chicken With Federal Debt Ceiling

By Barry Ritholtz
 
Bloomberg Businessweek on the debt ceiling: “Forcing a U.S. default is no small matter, yet many Americans say they want just that. It’s time for cooler heads on Capitol Hill to step up and lead.”
I love this graphic:
>
click for ginormous graphic

RECOGNIZE THIS PATTERN?

by Cullen Roche

If there’s been one thing that has been most apparent during QE2 (and QE1) it has been the repetitious trading patterns. There’s the Monday rally, the overnight futures ramp, the random intra-day surge and of course, the most obvious one – the buy the dip. If you don’t recognize the pattern you haven’t been paying attention. In essence, every morning dip is followed by a nice steady climb throughout the day. It’s been pretty obvious over the last 6 months, but has been particularly apparent over the last 5 trading sessions:
Like I discussed with the “mystery buyer” – this could be sheer coincidence. But I am guessing it’s not. My guess is our computer driven market is taking advantage of slow trading periods to drive action. Combined with the Bernanke Put and you have a market that is ripe for a unidirectional trade. So, the volume dies out and the computers kick in and take the market where they want. There’s nothing really fundamental about it. During QE it’s as easy as “risk on = computers on”.

There’s nothing conspiratorial about any of this. It just is what it is. We live in a market where modern technology drives much of the action. These profit driven algos grab the bull by the horns and steer it where ever it will result in a profit. But now, in a weird sort of Terminator-like way, we have to wonder whether it’s good that the machines are taking over. I view this is as one more sign of the financialization of our economy. The exchanges are now in the pockets of the banks and as public companies (as opposed to non-profit market regulators) they don’t really care about anything except volumes. Clearly, I don’t think that’s a good thing, however, I’d be very interested in reader opinions.

IS GOLD REALLY AN INFLATION HEDGE?

By SymmetricInfo

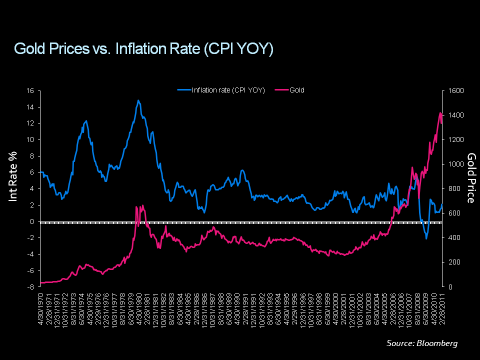
We often hear the phrase that gold is an “inflation hedge”. If gold were the perfect inflation hedge, then changes in gold prices would be perfectly contemporaneously correlated with the rate of inflation. Is this actually true?

Gold vs. realized inflation

The chart below shows the inflation rate (CPI Yoy) vs. the one year change in the price of gold. Its clear that the lines seem correlated back in the 70’s and 80′s, but lose their relationship in the past decade. This makes it difficult to believe that the recent increase in price of gold has been solely due to a change in realized inflation and weakens the case for gold as a good inflation hedge.

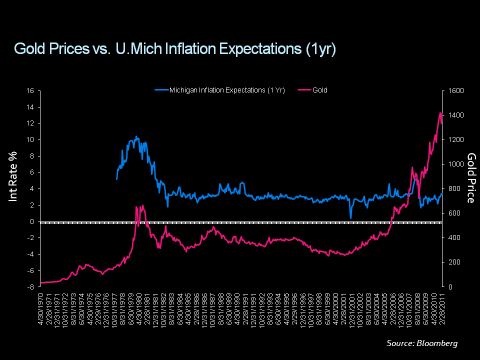
Gold vs. inflation expectations

One might reason that it is not realized inflation that gold is a hedge for, but the expected inflation rate. Below we show the same graph of gold prices, but this time we compare it to the University of Michigan Survey of Inflation Expectations 10 years out. Again, we see a correlation in the 70’s, but none in the past decade.

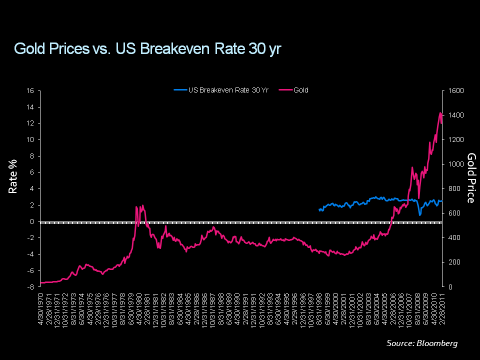
Gold vs. Breakeven rate

Just to be thorough we’ll assume that it is conceivable (though frankly not probable) that because the Michigan Inflation Sentiment surveys the general population, the survey results are not representative of inflation sentiment amongst financial market participants. In the graph below, we show gold prices vs. the 30 year breakeven inflation rate (the breakeven inflation rate is calculated from the difference in yields from 30 yr inflation linked bonds and treasuries). You see that in recent years the implied inflation rate 30 years out is only ~2%, which is in line with inflation expectations in the previous decade and does not signify high inflation expectations.

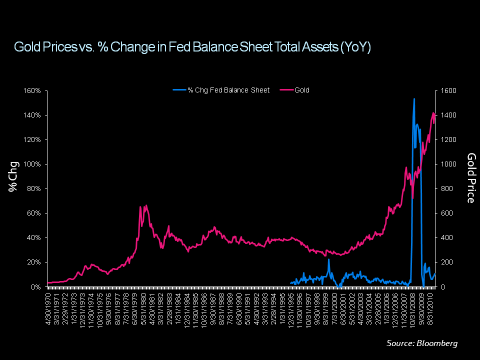
Gold vs. Federal Reserve Balance Sheet

One sometimes hears that the recent increase in value of gold is due to the radical increase in the size of the Fed’s balance sheet, but for one reason or another, this hasn’t been reflected in the inflation expectations of the market. Here is a graph showing changes in the size of the Fed’s balance sheet alongside gold prices. Again, we do not see any compelling relationship. The increase in the Fed’s balance actually coincided with a decrease in the price of gold and prior increases in Fed’s balance sheet did not coincide with increases in the price of gold.

Conclusion

There isn’t much empirical evidence to make one believe that the decade long gold rally has exclusively to do with either realized inflation, inflation expectations or the federal reserves balance sheet. However, based upon our previous post about the macro exposure obtained by buying/selling gold, thinking of gold simply as a hedge for inflation may miss the bigger picture. The fundamental reason gold has value is that it is an alternative to paper currency, and what makes gold attractive to hold vs. a paper currency is what it yields on a real basis. While high inflation rates might be one variable that goes into determining whether a currency is attractive to hold, it is likely not the whole picture. It is key to understand that the exposure you obtain from buying/selling gold is not exclusively linked to the inflation rate.

See the original article >>

IBM raises full-year profit forecast but shares flat

by Reuters

IBM raised its profit forecast as the tech giant released quarterly earnings ahead of Wall Street projections, citing strong sales of its mainframe computers and brisk business in emerging markets.


Some investors were disappointed that the company did not raise its full-year forecast by a wider margin.

"The concern is they didn't really guide a whole lot higher than they had originally for the year, if you take into account the earnings surprise," said Fort Pitt Capital Group senior analyst Kim Caughey Forrest. "That's a little disappointing."


IBM shares were little changed, dropping to $165.36 from their New York Stock Exchange close of $165.40.

The world's largest technology services firm managed to beat expectations for the first quarter, even though it does about 11 percent of its business in crisis-stricken Japan.


That was partially because of strong performance in the red-hot markets of Brazil, Russia, India and China, where revenue was up a combined 26 percent from a year earlier.


"These numbers show IBM's resiliency. They beat on just about every area I had hoped," said Ted Parrish, co-portfolio manager of the Henssler Equity Fund.


International Business Machines Corp raised its forecast for full-year profit, excluding items, to at least $13.15 from its previous view of at least $13.00.


IBM benefited from strong demand for the latest version of its mainframe computer, which it introduced in the third quarter of last year. Sales of that product were up 41 percent from a year earlier.


The company also reported first-quarter profit, excluding items, of $2.41 per share, ahead of the average analyst forecast of $2.30, according to Thomson Reuters I/B/E/S.


Revenue rose 8 percent from a year earlier to $24.6 billion, beating the average analyst forecast of $24.0 billion.

See the original article >>

Intel and VMWare give downtrodden tech sector a lift

By Noel Randewich and Edwin Chan

Strong results from a clutch of technology heavyweights, led by top global chip maker Intel Corp and "cloud computing" specialist VMware Inc, may give the battered U.S. tech sector a boost.

International Business Machines Corp also blew past Wall Street targets, raising its profit forecast and citing strong sales of mainframe computers and brisk business in emerging markets.

Those results set a brighter tone for a bedraggled tech sector than recent analysis might have suggested. Still to report are heavyweights, from Cisco Systems Inc and Apple Inc to Hewlett-Packard Co.

Concerns that the growing popularity of Apple's iPad is hurting personal computer sales, as well as the disruption to the global supply chain from Japan's earthquake, had walloped bellwether tech stocks in recent weeks.

"Expectations for this quarter -- despite the fact there were no pronouncements -- were low. There were concerns about semiconductor inventories, the decline in PC shipments or the competition from the iPad on PC shipments," said Tim Ghriskey, chief investment officer at Solaris Asset Management.

"The (stock index) futures are pointing to a stronger opening and that is really as a result of the strong earnings primarily from technology companies we saw after the close," he said.

Fund managers have sold down sector bellwethers since Japan's March 11 disaster, fearing worse-than-expected damage to margins as they battle to secure critical components from a country that supplies 14 percent of the world's electronics.

But with Intel's revenue forecasts for this quarter shattering expectations and defying fears of a slowdown in global PC sales, relieved investors piled back into the chipmaker's shares and other possibly oversold stocks.

Though some say the PC market looks better after Intel's report, the jury is still out on its longer term prospects. And Intel remains far behind Britain's ARM Holdings in designing mobile processors.

"Everybody, including myself, was overly pessimistic in the near term," said Roth Capital Partners analyst Arnab Chanda. "But the issues are still not resolved unless they tell us, 'Hey, we got four design wins on Tier 1 (high profile) handsets.'"

VMware, which specializes in helping corporations set up virtual computer hardware and software networks, also surprised Wall Street with evidence of a surge in corporations upgrading equipment as they emerged from recession.

VMware surged 10 percent and Intel climbed 4 percent. But IBM held steady as some investors had hoped for IBM to raise its full-year forecasts even more than they did.

SHOPPING FOR BARGAINS

On Tuesday, Intel said third-party forecasters -- such as Gartner -- might have failed to take emerging markets' astonishing growth into account. Other analysts said the gradual shift of manufacturing toward less-visible China from Taiwan and Japan might have clouded the picture somewhat.

Concerns that iPad tablets are squeezing sales of PCs have hung over Intel. Computer sales in the first quarter fell for the first time since 2009 as the iPad attracted buyers in droves and Japan focused on recovering from the earthquake and tsunami, according to research firm Gartner.

Intel's stock has shed about 12 percent of its value since the first iPad hit store shelves in April last year, while the Standard & Poor's 500 Index has gained 11 percent. With its shares trading at about 9.5 times expected annual earnings, some analysts say Intel has become a bargain despite its problems.

"I still think (Intel's) shares look undervalued," said Ralph Shive, portfolio manager for the $1.7 billion Indiana-based Wasatch-1st Watch Income Equity Fund.

"Everyone was saying that their margins couldn't hold up, that they don't have enough exposure to tablets, but the sales look strong and they're talking about filling in some of the product holes they have." 

VMware, one of the leading companies in the shift toward so-called cloud computing, or online access to data and computing power, beat Wall Street earnings estimates for the first quarter and indicated its margins would grow this year. 

Shares of VMware, which vies with Microsoft Corp and Oracle Corp in the fast-growing field of computer virtualization, doubled in value last year, but came down to earth 3 months ago as VMware said it would focus on internal investments in 2011. 

Some argue that major players such as Dell Inc, Cisco and Hewlett-Packard present attractive bargains despite uncertainty about how much the sector will be affected by Japan over the next few months.
Intel, HP, Dell and Microsoft had traded around 10 times forward earnings versus the market's 13.5 average. All have underperformed the market in past weeks. 

Even Apple -- hurt by a rebalancing of the Nasdaq 100 and fears of supply hiccups for components like memory chips and touchscreen glass -- now trades at 13 times forward earnings. 

Analysts say the Cupertino, California, company -- which reports earnings on Wednesday -- remains a bargain despite gaining about 37 percent over the past 12 months. Apple has the highest projected earnings growth among major tech stocks yet is still valued lower than Google Inc.

See the original article >>

Yahoo 1Q results top analyst views; stock climbs

By MICHAEL LIEDTKE

Yahoo Inc. is delivering on its promise to boost its earnings even though a bumpy beginning to its Internet search partnership with Microsoft Corp. is causing it to fall further behind in the Web's most lucrative advertising market.

Despite the Microsoft problems, the results released Tuesday showed signs of progress, which could help Yahoo CEO Carol Bartz persuade skeptical investors that the company is getting better after years of financial infirmity.

Yahoo hired Bartz in January 2009 to revive revenue growth, a goal that has proven elusive so far. She spent most of the first two years on the job cutting and reshuffling staff, closing unpopular services and cobbling together the Microsoft alliance to reduce Yahoo's costs.

Yahoo's higher earnings have come from primarily from savings that have included paring the company's staff to 13,300 employees, a 6 percent decrease from 14,200 people a year ago. Investors generally prefer to see robust revenue growth, particularly in companies trying profit from an Internet ad market that has been expanding at a much faster rate than the overall economy.

Those expectations mean Yahoo eventually will have to increase its revenue if it hopes to restore investors' confidence. Facebook's increasingly popular online hangout also has been luring visitors and advertising from Yahoo, posing another serious threat for Bartz to confront.

The results released Tuesday showed a 10 percent revenue increase in Yahoo's stronghold — the online billboards known as display advertising — after subtracting commissions. Earnings exceeded expectations, as did another gauge followed closely by Wall Street.

"Our turnaround is proceeding on schedule," Bartz assured analysts in a conference call. "We are very confident we are headed in the right direction."

But an upturn in revenue isn't imminent, partly because the Microsoft alliance isn't providing the payoff that Bartz envisioned. Yahoo's forecast for the current quarter pointed toward revenue slipping again for the three months ending in June.

Investors appeared willing to settle for the earnings improvement while they await a revenue revival. The company's shares gained 50 cents, or 3.1 percent, to $16.62 in extended trading.

With Yahoo's revenue slipping below its levels before Bartz's arrival, the company's stock has been a lackluster performer. The shares have fallen by more than 40 percent since Google Inc. went public in August 2004 and proceeded to establish itself as the dominant force in Internet advertising. At the time of Google's IPO, Yahoo's stock stood at $28.11. Since then, Google's market value has increased by more than fivefold.

Measuring Yahoo's strides in the first quarter proved difficult because of various one-time gains and charges that muddled the comparisons to last year.

Yahoo earned $223 million, or 17 cents share, for the first three months of the year. That's a 28 percent decline from $310 million, or 22 cents per share, a year ago.

If not for unusual items, Yahoo said it would have earned 19 cents per share in the latest quarter compared with 15 cents per share a year ago.

Analysts surveyed by FactSet expected earnings of 16 cents per share. That meant Yahoo topped the expectations guiding Wall Street, no matter how the earnings were chopped up.

Yahoo's revenue fell 24 percent to $1.21 billion. That decline is deceiving because it reflected the divestiture of some divisions and accounting adjustments dictated by the Microsoft partnership.

In a gauge followed more closely by Wall Street, Yahoo's revenue came in at $1.06 billion after subtracting ad commissions. Although that was $10 million higher than analyst estimates, it was 6 percent below $1.13 billion on the same basis last year.

In a long-running problem, Yahoo is still losing ground in search — an advertising gold mine that Google dominates.

Part of the decline stems from Yahoo's financial arrangement with Microsoft. The deal calls for Microsoft's technology to provide Yahoo's search results in return for $12 of every $100 in revenue from the ads placed alongside the recommended links. But Bartz said the Microsoft partnership isn't delivering as much revenue per search as the two sides envisioned. 

Until the trouble is worked out, Yahoo is delaying its plans to rely on Microsoft's search ad system outside the United States. Bartz didn't quantify how much Yahoo's revenue per search in the U.S. is lagging projections. 

She said guarantees promised under Yahoo's contract will cover some of the shortfall through March 2012.
After taking out commissions, Yahoo's ad revenue from search totaled $357 million in the first quarter. That was down 19 percent from the same time year ago. 

Yahoo, which is based in Sunnyvale, Calif., fared better in display advertising as net revenue in that category increased to $471 million. 

Combined, Yahoo's ad revenue after commissions dipped 3 percent from a year ago to $828 million. Google's net ad revenue surged 32 percent to $6.3 billion in the first quarter. 

Google's stock, though, has plunged since the company released its first-quarter report because its expenses are rising rapidly.

Follow Us