Monday, January 31, 2011

Inflation Rates vs Your Birth Year

by The Big Picture|Barry Ritholtz

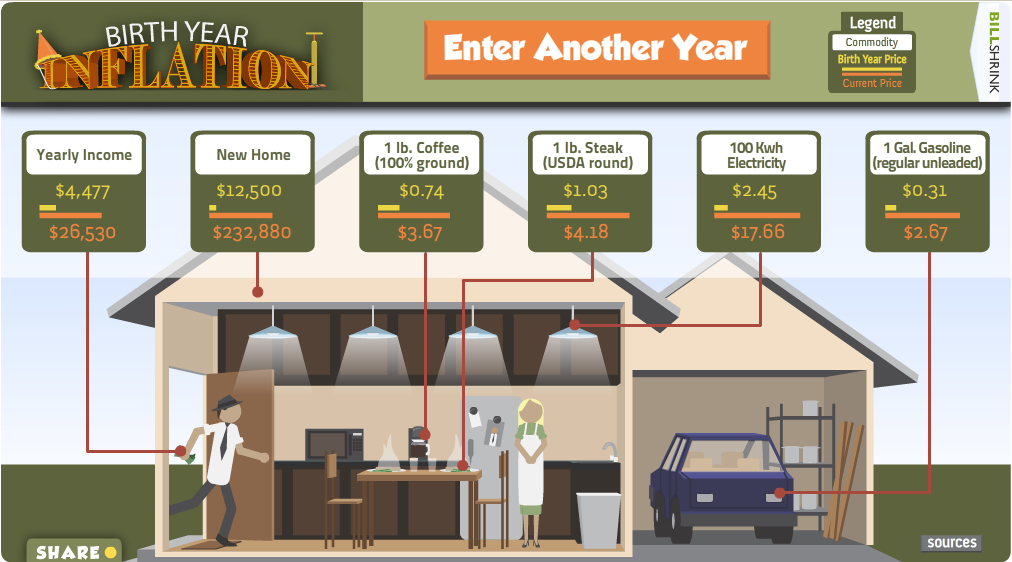
This is fun: Enter the year if your Birth, and see what various items cost vs today:

click for interactive graphic


Here’s mine:

Continue

Seculators cut bullish positions in all metals

By Debbie Carlson

(Kitco News) - Speculators cut bullish positions in all the U.S. metals futures markets in the week ending Jan. 25, according to data released late Friday from the Commodity Futures Trading Commission.

In its weekly commitment of traders report for futures and options combined, the CFTC showed speculators in both the disaggregated and legacy reports reduced gross long positions across the precious and base metals. Morgan Stanley noted precious metals’ prices spent most of the week under pressure until Friday’s rally because of civil unrest in Egypt.

During the timeframe covered by the report, front-month April gold futures on the Comex division of the New York Mercantile Exchange fell $36.10 an ounce, settling Jan. 25 at $1,333.80. March silver dropped $2.107 an ounce, settling at $26.805.

The funds continue to chip away at their net-long positions in gold, with this week’s data the fourth straight week of declines. In the disaggregated report, managed-money accounts are now net-long 129,664 contracts as they cut 1,993 gross longs and added 2,817 gross shorts. Producers and swap dealers cut exposure on both sides in gold but cut more gross shorts than longs, reducing their net-short position.

As in the disaggregated report, funds in the legacy report cut gross longs and added to gross shorts. The non-commercials cut 9,337 gross longs and added 4,269 gross shorts, leaving them net-long 175,828 contracts. Commercials carved out both gross shorts and longs, but significantly more shorts, dropping their overall net-short position. [..]

Continue reading this article »

Chicago PMI: Highest Level Since 1988

by Think BIG|Bespoke


This morning's report of the Chicago PMI for January was not only ahead of expectations (68.8 vs. 65.0), but it also came in at the highest level in over twenty years.  While the headline number was strong some of the sub-components were even stronger.  For example, Employment (64.1) was at its highest level since May 1984, while New Orders (75.7) haven't been this high since December 1983.
In the charts below we highlight the Chicago PMI headline index as well as its employment component going back to 1967.  Each chart shows a similar story of a sharp rebound, followed by a pause (last Summer's weakness) and a new leg higher.  With the employment component surging to multi-decade highs, bulls will no doubt anticipate strength in Friday's employment report. [..]


Copper eyes record high, demand hopes fuel gains

(Reuters)

LONDON - Copper came within touching distance of record highs on Monday as expectations of healthy demand from top consumers China and the United States boosted sentiment, despite a firmer dollar.
Tin hovered near record highs on worries about supplies from top exporter Indonesia.
Benchmark copper hit $9,722 a tonne, its highest since prices rose to an all-time high of $9,781 a tonne on Jan 19. The metal used in power and construction was trading at $9,695 a tonne at 1022 GMT from $9,635 on Friday. Investors have retreated from copper recently on expectations of a lull in activity because of a week-long holidays in China starting on Wednesday and on worries about tighter monetary policy in the country.
“Fears that China’s monetary policy would choke off economic growth have been overdone,” said Peter Fertig, a consultant at Quantitative Commodity Research.
“Even if China were to grow at a slower pace this year than last it would not change the picture, there would be a deficit.”
Markets expect another rise in Chinese interest rates in the first quarter. The country hiked rates twice and raised banks’ reserve requirements six times last year.
Traders say the market is waiting avidly to see the results of purchasing managers survey of manufacturing sectors in China and the United States on Tuesday.
The dollar has risen recently as investors sought safety in U.S. assets because of unrest in the Middle East.
Normally a higher U.S. currency would weigh on dollar-priced metals as it makes them more expensive for holders of other currencies, but so far this time, the market has ignored it.

RED HERRING

China accounts for nearly 40 percent of global copper demand estimated this year at around 21 million tonnes. The United States is the second largest consumer, accounting for about 15 percent of consumption.
“We anticipate accelerating economic growth in the U.S. at a similar level as seen in 2010, coupled with robust growth in emerging markets,” Swiss private bank Sarasin said in a note.
“This is likely to have a positive impact overall on the share prices of metals and mining companies.”
Aluminium, which is tracking copper, rose to two-week highs of $2,495 a tonne. The metal used in transport and packaging was at $2,482 a tonne from $2,472 on Friday.
Tin saw $30,000 a tonne, only $40 away from the record high of $30,040 a tonne seen on Friday. It was last at $29,800 a tonne from $29,600 on Friday.
Prices are up more than 10 percent so far this year. Last year the gain was nearly 60 percent. Behind the rise has been constraints on output in Indonesia.
“It started with Indonesia, but there is still a lot of momentum there,” a trader on the floor of the LME said. “If the funds pull the plug though, we could see a sharp correction.”
Lead was trading at $2,464 a tonne from $2,437 on Friday. The battery material has in recent weeks come under pressure from stocks in LME warehouses, which at 279,925 are at their highest since 1995.
But Macquarie in a note said: “We think that this stock build should be seen as a red herring rather than a red flag.”
“While the level of lead stocks in LME warehouses is at multi-year highs, total reported industry stocks in relation to the size of the market are not unusually high today.”
Zinc was at $2,355 a tonne from $2,354 and nickel at $26,900 from $26,620. [..]


Continue reading this article »

Gold Is Looking Risky, But Silver Looks Much Worse

Clemens Kownatzki, FXIS Market Insights

The World Gold Council recently issued its Gold Investment Digest for 2010 which provides, among many other interesting data points, a listing of official gold holdings of various countries. Notable highlight in our chart is the fact that the ETF GLD has been the 6th largest holder of gold at the end of 2010 (in case you were wondering what has been driving the price of gold in recent years).

chart

Gold continues to fascinate although it has been under pressure since the beginning of 2011. The precious metal has gained in investor acceptance and many advisors have been advocating to include a (small) percentage of gold as part of a well-diversified portfolio.  That in turn has led speculators to continue to invest in gold based exchange traded funds such as GLD (chart above). There are other gold funds though all seeking to share the gain on this unprecedented gold bull run.  How much of a speculative element there is remains to be seen but there sure are plenty of funds trying to imitate the precious... [..]

Continue reading this article »

WHERE IS INFLATION HEADED?

by Cullen Roche

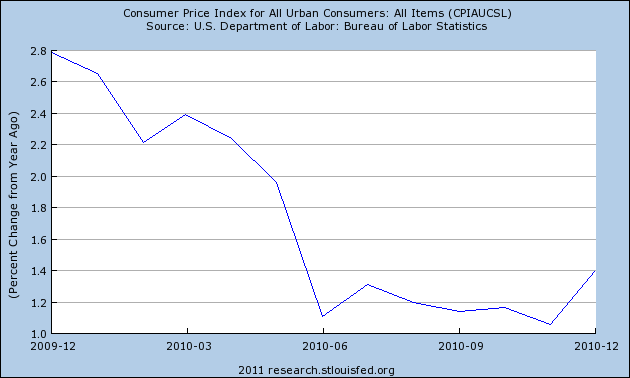
A little over a year ago I said inflation concerns in the USA were blown out of proportion and that we were likely to see an environment of disinflation “with a greater risk of deflation than hyperinflation”.  One year later that’s clearly what has occurred in the USA as disinflation ensued.  Overall inflation has continued to decline and deflationary fears became so substantial in Q3 2010 that the Fed panicked into implementing QE2.  In retrospect, it looks like the Fed jumped the gun as September economic data proved that the summer slowdown and double dip fears were overblown (not that it matters as we remain mired in one continuous balance sheet recession).  The good news is we’re not repeating the mistakes of Japan (yet), but we’re also not growing fast enough to meaningfully close the output gap.


But where are we now?  Is deflation still the greater risk?  What about commodity prices and global inflation?  How is this all going to play into the USA’s future inflation/deflation problems?
One thing we know from the credit crisis is that the Fed’s various “money printing” operations have had a far lesser impact on the rate of inflation than most presumed they would.  Despite an explosion in the monetary base inflation is near its lows.  As I’ve previously discussed, this unusual recession (a balance sheet recession) exposed many flaws in the way we understand the functions of modern banking.  The primary myth that has been exposed in recent months is the money multiplier.
Because we’re working in an unusual environment we have to throw out the old playbooks when estimating future rates of inflation.  The Fed’s actions are and will continue to be relatively futile in influencing future inflation.  Fiscal policy remains intact, however, is likely to come under increasing pressure in the coming years.  All of this occurs during a process of de-leveraging by the private sector.
From a demand-pull perspective the story remains little changed from last year.  This environment of low capacity utilization and tepid aggregate demand is likely to result in benign inflation.  This is due to the continuing strains at the consumer level.  A lack of job growth, de-leveraging, falling house prices, etc are likely to continue exerting pressures on the U.S. consumer in the coming years and make demand-pull inflation unlikely .... [..]

Continue reading this article »

Sunday, January 30, 2011

Fed Days Become Non-Event Days

Weekend Reading from Bespoke »

While it barely made news, the Federal Open Market Committee (FOMC) last week held the first of its eight regularly scheduled meetings for the year.  On Wednesday -- the day that the Fed released its policy statement from the meeting -- the S&P 500 gained 0.42%. 
For those that have been following the markets for longer than a year or so, a change of 0.42% on a Fed Day seems pretty small.  Up until just recently, the market would move around like a jumping bean on Fed Days as investors reacted to policy changes and tried to interpret what Ben Bernanke and his predecessor Alan Greenspan had just done.  But it has now been 538 days since the Fed last changed the Fed Funds Rate, and the inactivity has become so telegraphed that traders are hardly aware of when the next Fed Day is, nor do they care.
At some point this will change, but for now Fed Days have basically become non-event days.  To quantify this, we looked at the average absolute change of the S&P 500 on Fed Days over the last 10 Fed Days and calculated this going back to 1994 when the Fed started announcing policy changes immediately following their meetings.  During the back half of the 90s and the first half of the 2000s, the S&P 500 was averaging a change of +/-0.80% to 1.20% on Fed Days.  The peak 10-day volatility reading came in the thick of the financial crisis when the S&P averaged a +/- move of 2.36% over the last 10 Fed Days.  As shown below, the average +/- move over the last 10 Fed Days has been 0.40%.  This is a tick above the prior reading which was +/-0.37% and also the lowest reading ever. [..]


Continue reading this article »

THE RISK OF EGYPT: OIL PRICES

by Cullen Roche

Friday’s surge in oil prices due to the turmoil in Egypt and other parts of the Middle East was a wake-up call to the market that the economic ramifications could be wide reaching.  The protests in Egypt represent the people’s cries for a more democratic nation.  This is obviously a long-term positive and could have a wide ranging impact on the future of Middle Eastern politics and government, however, in the near-term this has the potential to disrupt a very fragile global economy.
The primary risk comes thru the potential for higher oil prices.  There is no telling how long the turmoil in Egypt will last and whether or not it will spread to other regions.  The risk here is that the uprisings will disrupt oil production and shipment in the Middle East.  The WSJ elaborates:
“In the short term, the biggest global economic worry remains oil prices. Egypt itself isn’t a big energy producer. But significant shipments of oil and petroleum products pass through Egypt each day on their way from the Mideast to European and U.S. markets.
About a million barrels a day of crude and refined products are shipped northward on the Suez Canal, according to estimates from the U.S. Department of Energy. A separate pipeline linking the Red Sea and the Mediterranean carries another 1.1 million barrels a day. Together, that is roughly 2% of global oil production.
If oil shipments through Egypt were disrupted, European supply—and global prices—would be “affected tremendously,” said Dalton Garis, an associate professor in petroleum-market behavior at the Petroleum Institute, an energy-research center in Abu Dhabi.
So far, oil flowing through both conduits appears unhindered. But a dusk-to-dawn curfew across the country had shippers operating in the canal warning customers over the weekend of potential delays and difficulty in contacting shipping agents and pilots and arranging for spare parts. Including the oil flows, about 8% of the world’s seaborne trade passes through the canal, according to Egyptian government figures.
“The protests have no effect on the shipping traffic,” Abdul Ghani Mohamed Mahmoud, a spokesman for the Suez Canal Authority, said Sunday. “Everything is going as usual,” he added. Officials at Arab Petroleum Pipeline Co., which owns the Suez-Mediterranean pipeline, couldn’t be reached to comment. [..]

Continue reading this article »

Global aluminum consumption to double by 2020 - Alcoa

By Steel Guru

Mr Klaus Kleinfeld CEO of Alcoa Inc said that it expects demand for the metal to double by 2020 driven by consumption in Asia, Brazil and the Middle East. According to Mr Kleinfeld, we see places like China continuing to lead with growth of 21% last [..]

Continue reading this article »

Future scramble for rice supply

by JASON SZEP

Fresh demand for rice in two big Asian countries is sending a worrying signal the region’s main staple may join a surge in prices for other grains, worsening Asia’s spiralling food inflation.Asian rice traders say aggressive buying in heavily populated Indonesia and Bangladesh could spread, pushing up world rice prices even though bumper crops in Thailand and Vietnam should mean ample supplies.
“This is only the start of the panic buying,” said Ker Chung Yang, commodities analyst at Singapore-based Phillip Futures, referring to Bangladesh’s recent tripling of its rice import target and Indonesia’s purchase this week of 820,000 tons of Thai rice, nearly five times the volume initially sought. “I expect we’ll have more countries coming in and buying grain.”
Still, analysts see little risk of a 2008-like food crisis, when rice prices rose above $1,000 a ton, double their current level. Vietnam’s rising supply and lower imports from the Philippines, the world’s top importer last year, could mean rice continues to defy a broader trend of fast-rising global prices for wheat, soybeans and other foods.
Thailand’s benchmark 100 percent B grade white rice was offered at $540 per ton on Friday, unchanged so far this year after falling 13 percent last year. In comparison US wheat and corn futures have risen by more than half since the start of last year. A sustained rise in the price of rice, a staple in the diets of nearly half the world’s population, would squeeze the budgets of millions of Asians living near the poverty line, raising the risk of unrest in a reprise of the 2008 food security crisis.
The aggressive purchase by Indonesia seems aimed more at bringing down 20-month high inflation, a view reinforced after the country followed up Friday by scrapping import duties on rice, soybeans and wheat.
“The Indonesian buying is a classic example of countries doubling their imports of rice in a very short span of time,” said one Singapore-based trading manager with an international trading company. “The way Indonesia has bought smells of food security fears rather than genuine demand.” [..]
Continue reading this article »

Here’s Why The Financial Crisis Could Not Have Been Prevented

by Robert Lenzner

The multi-trillion dollar meltdown of financial markets in 2007-09 could not have been prevented.  It was absurd speculation on the part of the special Presidential Commission to even suggest this impossible nirvana. No way Jose!
Let me tell you why. As my esteemed friend Jim Stone, chairman of Plymouth Rock  Assurance, headquartered in Boston puts it so succinctly; “We have wagered our place in history on our relative strength in finance. Bad bet.”
The  financial markets crisis  could not have been prevented because Alan Greenspan, chairman of the Federal Reserve Bank,  for 18 long years the power center in the nation for monetary  policy, did not believe in reining in the animal spirits on Wall Street. He chose to ignore pleading from wise titans like Loews Corp. Laurence Tisch, and Wall Street great John Whitehead, who begged him to turn off the spigot of easy money and rock-bottom interest rates.
Yeah, it could have been prevented if Greenspan had actually  taken steps to dampen down “irrational exuberance,” his description of the craziness that began in the mid-1990s– and continued to accelerate until mid-2007. Regrettably, Greenspan’s utter and naive  faith in free market ideology, makes him look a fool– not the God-like figure we all created.
Yeah- this here “irrational exuberance” blinded Wall Street biggies like Citigroup, Lehman, Merrill Lynch, Baer Stearns,and others from employing the necessary risk controls required to remain in control of their  fortune. Risk control, they thought, what’s that in light of the money we foolishly think were making, when we’re losing.
Yeah, it could have been prevented if the Clinton administration led by Robert Rubin and Larry Summers had not blithely agreed to deep-six the discipline of the Glass-Steagall Act- which in 1933 wisely separated  the activities of the investment banks and the commercial banks– and had ensured  relative stability on Wall Street for over half a century. [..]

Continue reading this article »

China central bank says Fed easing ineffective and dangerous

Reporting by Zhou Xin and Michael Martina; Editing by Simon Rabinovitch

(Reuters) - Quantitative easing by the Federal Reserve and other central banks cannot address fundamental economic problems but may lead to excessive global liquidity and competitive currency depreciation, China's central bank said on Sunday.
In its monetary policy report for the final quarter of 2010, the People's Bank of China (PBOC) also confirmed that it would target 16 percent growth of the broad M2 measure of money supply this year, down from the 19.9 pct growth recorded at the end of 2010.

The central bank said the Fed's monetary easing was pushing up international commodity prices and asset prices in emerging markets, including China.

"Quantitative easing policy cannot fundamentally address economic problems, and it may cause excessive liquidity on a global scale as well as risks of competitive currency depreciation," the Chinese central bank said in its 59-page report.

"It is creating imported inflation and short-term capital inflows, pressuring emerging markets," it said.

As a result, China needed to work hard to soak up liquidity from foreign exchange inflows in order to minimize the impact on the domestic economy, it added.

The central bank reiterated that it would keep the yuan basically stable while making the exchange rate regime more flexible  [..]

A REAL STATISTICAL RECOVERY

by John Mauldin
The following is an excerpt of John Mauldin’s weekly letter (see his full letter here):

The Recent GDP Numbers – A Real Statistical Recovery

Now, before we get into our panel discussion (and the meeting afterward), let me comment on the GDP number that came in yesterday. This is what Moody’s Analytics told us:
“Real GDP grew 3.2% at an annualized pace in the fourth quarter of 2010. This was below the consensus estimate for 3.6% growth and was an improvement from the 2.6% pace in the third quarter. Private inventories were an enormous drag on growth, subtracting 3.7 percentage points; this bodes very well for the near-term outlook and means that current demand is very strong. Consumer spending, investment and trade were all positives for growth in the fourth quarter; government was a slight negative. The economy will see very strong growth in 2011 as the tax and spending deal passed in December stimulates demand and the labor market picks up, creating a self-sustaining expansion.”
This 3.2% followed a 1.7% in the second quarter and a 2.6% in the third quarter. The trend is your friend.
Well, maybe not so much. That inventory number seemed odd to me, and looking into it with Lacy Hunt, it turns out there is more than the headline number. For some of you, this is going to be a little like “inside baseball;” but the way they calculate the GDP number can have some odd effects every now and then. And this quarter the effect was way more than normal. This is going to be somewhat counterintuitive, but hang in there with me as I try to make it simple.
You remember our old friendly equation:
GDP = C + I + G + (Net Exports) or
Gross Domestic Product is the combination of domestic Consumption (both consumer and business) plus Investments plus Government Expenditure plus Net Exports (exports minus imports). This latter category has been negative for quite some time, as imports, especially oil, have been larger than exports.
Now to get Real GDP (actual GDP after inflation) you have to take away the effects of inflation/deflation. This is done by the use of a deflator built in for each category. But the deflator for exports/imports is a little tricky at times.
Moody’s correctly noted that “private inventories were an enormous drag on growth” and concluded that this was a good thing, in that they assumed that meant inventories went down and thus inventory rebuilding in future quarters will add to GDP growth. And that is where you have to look at the numbers, and there we find our anomaly. There really wasn’t that big a drop in inventories. It was in large part in the statistics, not in the warehouse.
Oil in the 4th quarter rose from roughly $81 to $89, or about 10%. On an annualized basis, this is 40%. Inventory investment is equal to the change in book value of the inventories, minus what is known as the IVA, or inventory valuation adjustment, which is used to correct for prices going up or down. Because the value of oil rose and thus cost more to acquire, the accounting requires that you reduce the value of the current inventories. Thus “real” imports fell at a 13% annual rate. Why? Because the deflator rose by 19%, largely because of the rise in the price of oil.
I know, I know, I just wrote that because the price of oil went up, the “real” value of imports went down, as well as inventories. Some of you are getting economic whiplash right about now.
If oil were to go back down this quarter by the same amount, that “growth” could be wiped out. There is no conspiracy here. It is just a statistical necessity, like hedonic measurements, and it is all very clear in the fine print; but when there are wide swings in oil prices over a quarter, and because our imports of oil are so large, you can get these odd accounting factoids. Which the gunslingers on TV (and elsewhere) miss in their urge to be the first to get out a bullish statement!
How much did it change things? Lacy thinks by anywhere from 0.5% to 1%. That means GDP is still a positive number, but there is not a “3” handle at the beginning of it. In the grand scheme of things, no big deal, as it will balance out over the coming quarters and years. But I just wanted to point out (once again) that you have to take some of the numbers we get from our government with a few grains of salt. That’s the key takeaway here. And they CERTAINLY should not be traded upon. (Anybody who trades on the employment numbers deserves what they get, which is usually a loss. But back to our story.)

Consumer Spending Rose? Where Was the Income?

The really surprising number you saw the talking heads on TV mention was the growth of consumer spending, at 4.4%. Is the US consumer back? After all, real final sales rose by 7.1%, a number not seen since 1984 and Ronald Reagan. But real income rose a paltry 1.7%. Where did the money that was spent come from? Savings dropped a rather large 0.5% for the quarter. That was part of it. And I can’t find the link, but there was an unusual drawdown of money market and investment accounts last quarter, somewhere around 1.5%, if I remember correctly. (David Walker remembered that article as well.) That would just about cover it. But that is not a good thing and is certainly not sustainable.
Let’s see what good friend David Rosenberg (more on Rosie below) has to say about those numbers:
“Even with the Q4 bounce, real final sales have managed to eke out a barely more than 2% annual gain since the recession ended, whereas what is normal at this stage of the cycle is a trend much closer to 4%. Welcome to the new normal [..]


Try A Long Trade On Euro Bund

Continuano le divergenze positive sull'Euro Bund, in questo caso accompagnata da una figura rialzista a livello di barra giornaliera. A queste condizioni si può provare un Long con rigido Stop Loss sotto il minimo di venerdì scorso. 

Even a positive divergence on Euro bund, in this case accompanied by a bullish daily bar. We can try a Buy Long trade with rigorous stop below the low of last Friday.

Try A Short Trade On Sugar

Continuano le divergenze negative sul Sugar scadenza Maggio, in questo caso accompagnata da una figura ribassista a livello di barra giornaliera. A queste condizioni si può provare uno Short con rigido Stop Loss sopra il massimo di venerdì scorso.

Even a negative divergence on May Sugar, in this case accompanied by a bearish daily bar. We can try a sell short trade with rigorous stop loss above the high of last Friday.

Saturday, January 29, 2011

Marine Diamond Mining

By Leia Michele Toovey
Pioneered by Sam Collins, marine diamond mining began in the 1960s off the coast of southern Namibia. The first marine diamond mining technique was an archaic dredging system; however, despite the simplicity of this original technique, Mr. Collins was able to recover around 788,000 carats of diamonds. In the years since, a handful of players, particularly De Beers, have sunk money and research into marine diamond mining. The result was a new exploration method that produced 1 million carats of diamonds in 2009.

Marine diamond mining takes place primarily along the 1,400 km stretch of coastline of southern Namibia and northwestern South Africa. Namibia has the richest known marine diamond deposits in the world, estimated at over 100 million carats. The marine diamonds were transported to the coastline over a roughly 100 million year time period. All of the diamond deposits in Namibia originate from kimberlites in South Africa. These diamonds were washed down the Orange River, and deposited at the river mouth as well as along the coastlines of Namibia and South Africa.

Despite the early successes of Mr. Collins and other entrepreneurial explorers, marine diamond mining has only gathered major interest over the last 15 years due to the unavailability of proper technology that would enable the miners to embark upon the large-scale mining operations necessary to turn a profit in this expensive endeavor. Also, the relatively low prices of diamonds at that time made the undertaking economically unfeasible.

Things started to change in 1970 when De Beers bought out existing marine operations along the Namibian/South African Coast and embarked upon a widespread exploration program. De Beers did not get immediate gratification;wasn't until the late 1980s that they were able to commission mining vessels and commence offshore diamond mining.
The two primary marine mining methods used by De Beers are the horizontal system, and the vertical system. In the horizontal system a seabed crawler brings diamond-bearing gravels to the vessel through flexible slurry hoses. In the vertical system, a large-diameter drilling device mounted on a compensated steel pipe drill string recovers diamond-bearing gravels from the seabed following a systematic pattern over the mining block. The De Beers Marine fleet consists of five mining vessels and one evaluation sampling and mining vessel. Mining takes place on the ocean floor at water depths ranging from 90 to 140 meters.  The rehabilitation of marine mining environments occur naturally, once the mining has been completed in a particular area.
Marine diamond mining has overtaken land mining in terms of carats produced, as land-based mines have seen a recent decline.  De Beers reported that in 2009, marine-mined diamonds accounted for around 60 percent of total diamond output from all their Namibia based mines.

How John Paulson Made $5 Billion Last Year

by Robert Lenzner

The secret to the spectacular returns  Paulson  and his employees  reported for 2010 is due to their keeping  much of their money- $14.9 billion or 42% of the total assets under management($35 billion)– in the funds. That’s called putting your money to work alongside your clients. That $14.9 billion commitment is revealed in Paulson’s yearend letter to investors.
Some of Paulson’s personal share  in his funds must come from the $4 billion he made going short against the subprime mortgage bubble in 2007.
The Paulson funds  made gross gains in 2010 of $8.4 billion before fees.  So, 42% (their share)  of  the $8.4 billion meant $3.5 billion in gains for Paulson and his employees.
Add to that a 2% fee on $35 billion of capital– $700 million– and then the 20% fee on the total profits made adds another $1.7 billion to the pot shared by Paulson and his team.
By my figuring then, the total take comes to roughly $6 billion before  taxes.
Overall, the fund’s strategy made a transition during the year from a short equity bias  with a focus on being long distressed securities to a long equity event focus, according to Paulson’s yearend letter.
This growing  bullishness on the stock market  is due to  Paulson’s careful  tracking of  the equity risk premium measured by J.P. Morgan; the difference between the yield on equities and the yield on bonds. Paulson  is a buyer of stocks because he sees the equity risk premium in the market as “the highest it has been in over 50 years., indicating to us that equities are due to rise as the current economic environment is by no means the most challenging it has been in 50 years,” he wrote in his yearend letter which was posted Friday on the internet.
Last year, for example, Paulson made a 43% return  or over $1 billion on Citigroup– buying shares at $3.20 a share and selling them for $4.60 a share later in the year.
The Paulson Gold Fund was up over 35% on the year, as positions in Anglo Gold, Osisko and GLD, the giant gold ETF all paid off bigtime. Paulson is optimistic that gold will outperform for the next 5 years and is “the ideal vehicle to hedge against the risk of the U.S. dollar.”
The funds held $20 billion in 40 different distressed situations where most of the companies have “repaired their capital structures.”
He also sold off positions in major banks like Bank of America, and went long Anadarko, the oil and natural gas producer.
Paulson’s hedge fund has piled up gains of 26 billion since inception in 1994– 3rd biggest killing of all hedge funds. Quantum Endowment Fund, begun by George Soros in 1973,  has racked up $32 billion in net gains. Renaissance Medallion Fund, founded in 1982 by James Simons, has delivered net gains of $28 billion.
He  expects all his funds “to outperform in 2011.”

IS CHINA DIFFERENT? A FLAWED ECONOMIC MODEL VERSUS TIGER MOTHERS

By Guest Author

“We do not believe in Chinese exceptionalism. China’s economy is no different from any other, in spite of the inevitable Chinese characteristics. If there are such things as economic laws, they work just as well in China and for Chinese businesses as they do in other markets.”
From Red Capitalism, The Fragile Financial Foundation of China’s Extraordinary Rise, p ix
~~~
“What Chinese parents understand is that nothing is fun until you’re good at it. To get good at anything you have to work.”
From “Why Chinese Mothers Are Superior” by Amy Chua, Wall Street Journal, January 8, 2011
In the long run the laws of economics apply everywhere and there is no escaping the dismal science’s somber logic. But our knowledge about economic laws is incomplete. Economics – believe it or not – is really about people and the decisions they make about work and money. What traditional economic models don’t factor in – perhaps because it can’t be quantified and it’s politically incorrect in academic circles to even talk about it – is the character of a people.
From the viewpoint of a free market economist China is following the wrong economic model. Of course anything would be better than the1949-1978 Chinese “model” of continuing chaos and suppression of private enterprise. But today China is following its own version of the mercantilist East Asian model, which involves predominantly state rather than market-directed investment, over-reliance on exports (largely at the expense of the United States), undervalued exchange rates and excess reliance on investment vs. consumption. The model is deeply flawed and unless modified sooner or later will reach a dead-end as Japan has discovered. But “sooner or later” is not a useful concept for investors for whom timing is everything.
As I have previously argued, East Asia is populated by disciplined, hard working, well educated people obsessed with material improvement and conditioned by the obedience/work-oriented Confucian ethic. This type of people can take even a flawed economic model a long way. Read Amy Chua whose Wall Street Journal article about Chinese tough love and “tiger mothers” has caused an international uproar. Chinese mothers program their children to work and achieve. The bottom line for economic forecasters: from an economic perspective all those tiger mothers turn out hard-working model ..........

Continue reading this article »

(Reuters) Egypt riots knock Wall St to biggest drop in 6 months


(Reuters) - Stocks suffered their biggest one-day loss in nearly six months on Friday as anti-government rioting in Egypt prompted investors to flee to less risky assets to ride out the turmoil.
Increased instability in the Middle East drove up the CBOE Volatility Index .VIX, the stock market's fear gauge, as investors scrambled for protective positions.

"The market hates uncertainties, especially geopolitical ones, and based on how that shapes up throughout the weekend (in Egypt), next week's trading will be impacted," said Thomas Nyheim, portfolio manager for Christiana Bank & Trust Co in Greenville, Delaware.

Trading volume was the highest of the year at 9.97 billion shares on the New York Stock Exchange, the American Stock Exchange and Nasdaq, compared to last year's estimated daily average of 8.47 billion shares.

The market drop ended the Dow's eight-week winning streak and pushed the S&P 500 below its 14-day moving average for the first time in two months. Disappointing results from Amazon.com (AMZN.O) and Ford (F.N) further added to the gloom.

Developments in the Middle East could be a trigger for investors to sell at a time when many expected a correction after a market rally of about 18 percent since September.

"I think the next two to three weeks, the crisis in Egypt and potentially across the Middle East, might be an excuse for a big selloff of 5 to 10 percent," said Keith Wirtz, president and chief investment officer at Fifth Third Asset Management in Cincinnati, Ohio.

Nasdaq quotations for its main stock indexes suffered an outage of nearly one hour at the open, causing confusion among traders. Nasdaq OMX Group (NDAQ.O) blamed a glitch with its global index data service.

The Dow Jones industrial average .DJI ended down 166.13 points, or 1.39 percent, at 11,823.70. The Standard & Poor's 500 Index .SPX was down 23.20 points, or 1.79 percent, at 1,276.34. The Nasdaq Composite Index .IXIC fell 68.39 points, or 2.48 percent, at 2,686.89.

PUTTING THE GOLD DECLINE IN PERSPECTIVE


Today’s chart provides a long-term view of the gold market. As today’s chart illustrates, gold has been in a strong bull market since 2001. Today’s chart illustrates that the pace of that upward trend increased beginning in mid-2005. Following the financial crisis of late 2008, gold surged once again. More recently, gold has pulled back from resistance (red line) of its accelerated trend channel. However, gold has pulled back to and is currently testing what is two-year, intermediate support (see green dashed line) for the eighth time.
Notes:
- Does the gold rally continue or is the party over? The answer may surprise you. Find out now with the exclusive & highly regarded charts of Chart of the Day Plus.

Continue reading this article »

Friday, January 28, 2011

YIELD CURVE PREDICTS: 1% GDP GROWTH, BUT NO RECESSION

by Cullen Roche

“Continuing a recent trend, the yield curve became steeper over the past month, as long rates increased nearly 0.2 percent, and short rates inched up. The three-month Treasury bill rate moved up to 0.15 percent—just above November and December’s 0.14 percent. The ten-year rate rose to 3.36 percent, up from December’s 3.18 percent and well above November’s 2.89 percent. The slope rose 17 basis points (bp), staying above 300 bp, a full 46 bp above November’s 255 bp.
Projecting forward using past values of the spread and GDP growth suggests that real GDP will grow at about a 1.0 percent rate over the next year, the same projection as in November and December. Although the time horizons do not match exactly, this comes in on the more pessimistic side of other forecasts, although, like them, it does show moderate growth for .....


U.S. Commercial Real Estate Market Moves on Healthcare

by Marian Anthony

Growing concern with higher commercial vacancy in the U.S. real estate market continues to weaken confidence while defaults in the Commercial Mortgage-backed Securities Market (CMBS) increase.
President Obama’s new healthcare bill is now encouraging more investors back into the commercial Healthcare real estate market. Some have moved on the growing opportunity as aging baby-boomers fuel the increasing demand for more long-term care facilities.
Healthcare REITs (Real Estate Investment Trust) have been identified as the next “hot ticket” for speculators in the distressed U.S. ...

IS THE CONSUMER REBOUND SUSTAINABLE?

by Cullen Roche

“The story within the story was the resurrection of the American consumer who lifted his/her spending at a 4.4% annual rate. This is the strongest gain since the first quarter of 2006, when credit was flowing freely, unemployment of 4.5% was triggering sizeable organic wage growth and rallies in both equities and housing were generating personal wealth, at least on paper. It would be a bit dangerous to extrapolate what we just saw in the fourth quarter because the QE2 juice squeezed by Uncle Ben generated a sizeable wealth effect that helped pull down the savings rate from 5.9% in the third quarter to 5.4% in the fourth (it should NOT be lost on anyone that real consumer spending at +4.4% growth managed to more than double the comparatively sluggish 1.8% annualized increase in real disposable income). Strip out this non-recurring factor and real GDP growth would have come in closer to a ho-hum 2.8% annual rate last quarter. That actually is not really that impressive for a sixth quarter of post-recession recovery, when real GDP growth is typically chugging along at roughly ......

Continue reading this article »

Help! We’ve fallen and we can’t get up!

By Barry Ritholtz

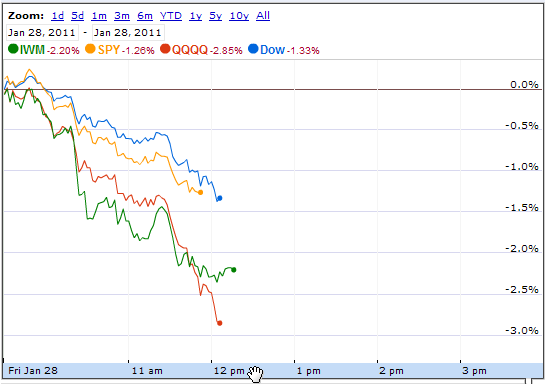
Today seems to be the first day the major indices have fallen, and are unable to muster a rally.
It is still early — its only noon EST as I type this — but I don’t get a feel for the market’s ability to come charging back.  That’s no surprise, given the over-extended over bought condition we find ourselves in.
Note that the Nasdaq (QQQQ) and the Russell 2000 (IWM) are leading tot he downside.
Hence, the news flow may amount to little more than an opportunity to pullback, consolidate, and work off some excesses of recent weeks. We will have a better sense as the correction unfolds if this is a minor (8-12%) pullback, something less, or something more.
Stay tuned . . .
>


Deutsche Bank CEO: Bailout Risk Lurks for Hedge Funds

          By: MoneyNews.com
Deutsche Bank AG Chief Executive Officer Josef Ackermann said unregulated financial companies such as hedge funds may pose a systemic risk to the economy if oversight isn’t increased.
“You have an unregulated area which becomes — as a consequence of all the regulatory changes — more and more important,” Ackermann, 62, said in an interview at the World Economic Forum in Davos, Switzerland. “You may one day wake up and realize that the systemic challenges are so big that you will have to bail out or at least help support the unregulated sector.”
Ackermann’s warning echoes comments made by former U.S. Treasury Secretary Lawrence Summers, who said this week in Davos that regulators haven’t paid enough attention to problems that could emerge in “a large, less healthy buccaneer sector.” Hedge funds have dodged the brunt of new global banking regulation aimed at avoiding a repeat of the worst global financial crisis since the Great Depression.
“If you separate utility banks from casino banking, you will one day realize that casino banks are also counterparties to corporations but also to other banks and to asset management and to governments,” Ackermann said yesterday. “It would be somewhat naïve to assume that if you have a strong regulated sector and leave the unregulated in the open, that you will never have systemic risk.”
 

Survivor Trading System - Trades of 27 January

I trades di Survivor System del 27 Gennaio. I risultati real-time sono a disposizione al seguente link: http://www.box.net/shared/5vajnzc4cp  

Trades of Survivor System on 27 January. Real-time results are available at the following link: http://www.box.net/shared/5vajnzc4cp

Thursday, January 27, 2011

Survivor Trading System - Results of 26 January

I trades di Survivor System del 26 Gennaio. I risultati real-time sono a disposizione al seguente link: http://www.box.net/shared/5vajnzc4cp 

Trades of Survivor System on 26 January. Real-time results are available at the following link: http://www.box.net/shared/5vajnzc4cp

Wednesday, January 26, 2011

Survivor Trading System - Results of 25 January

I trades di Survivor System del 25 Gennaio. I risultati real-time sono a disposizione al seguente link: http://www.box.net/shared/5vajnzc4cp


Trades of Survivor System on 25 January. Real-time results are available at the following link: http://www.box.net/shared/5vajnzc4cp

Tuesday, January 25, 2011

Survivor System Trades 24 January

I trades di survivor System del 24 Gennaio 

Trades of Survivor system on 24 January


Thursday, January 20, 2011

Wednesday, January 19, 2011

Thursday, January 13, 2011

+ 209.06% From Early 2009! Try for Free Our Super Commodity System


We pleased to offer to ours readers the opportunity to test and evaluate for free for 30 days the full version of one of our best trading systems, Super Commodity. At the following link http://tradingweeks.blogspot.com/p/portfolio.html there are system features, its historical results and other useful info.


Net Results Year 2009 + 157.61%
Net Result Year 2010 + 52.35%
Net Result January 2011 + 6.47%

Updates with all system trading signals will be sent by email at the end of day, around 6:00pm Eastern time, and in case again a second time in the next morning before 6:00am Eastern time, addition to intraday updates. In addition, customers may view at any time the trading signals also on a special page through secure internet access.

After the free trial period, the service will continue to pay a monthly $ 295.00 fee. To activate the service, use the free trial period and receive daily updates please use the button below.

+ 209.06% Da Inizio 2009! Prova Gratuitamente Super Commodity System

Siamo lieti di offrire la possibilità di testare e valutare gratuitamente per 30 giorni la versione integrale di uno dei nostri migliori trading systems, Super Commodity. Al seguente link http://tradingweeks.blogspot.com/p/portfolio.html sono disponibili caratteristiche del system, i suoi risultati storici ed altre utili informazioni.

Risultato Netto Anno 2009 + 157.61%
Risultato Netto Anno 2010 + 52.35%
Risultato Netto Gennaio 2011 + 6.47%

Gli aggiornamenti con tutti i segnali operativi del system verranno spediti tramite email a fine giornata intorno alle ore 24:00 Italian time, ed eventualmente una seconda volta nella mattinata successiva entro le ore 12:00 Italian time, oltre agli eventuali aggiornamenti intraday. Inoltre, i clienti potranno prendere visione in ogni momento dei segnali operativi giornalieri anche su apposita pagina protetta tramite collegamento internet.

Al termine del periodo di prova gratuito il servizio proseguirà a pagamento tramite fee mensile di € 295.00. Per attivare il servizio, usufruire del periodo di prova gratuito e ricevere gli aggiornamenti quotidiani utilizzare il seguente pulsante.

Follow Us