Monday, May 30, 2011

Four Reasons Wheat Prices Should be High

By: Sara Schafer

How much will you earn with your wheat crop this year? Market experts cite several factors will support wheat prices.

Weather concerns across the globe are wrecking havoc on wheat planting and growing, while the word is still out on if and when export bans will be lifted for key wheat-producing countries.
“Right now there are many moving parts,” says Kevin Van Trump, Farm Direction CEO.

Here are four major market movers to watch:

Poor Winter Wheat Crop Condition

Reports of low-yielding hard red winter wheat continue to come out of Kansas, Texas and Oklahoma.
“I am talking to many producers in the area, and I am thinking the worst is yet to come,” Van Trump says. “I have to believe once the farmers get into the fields and actually start to report yields you will see some serious disbelief.”
Alan Brugler, Brugler Marketing & Management president, says that Nebraska and Colorado could still have a decent wheat crop, but with Kansas having the most wheat acreage, supplies will be tight.
He says this will continue to prop up the basis for hard red winter wheat at theKansas City Board of Trade.
Van Trump agrees. “Obviously the market will have no choice but to build premium on fears of a substantially short crop, particularly high-protein wheat.”

Slow Spring Wheat Seeding

With the potential for an extremely low-yielding winter wheat crop, more emphasis is put on spring wheat, Brugler says. “That’s the other place you go to get high-protein wheat to put into bread flour.”
Yet, spring wheat planting has definitely not been ideal this year. As of May 22, USDA reports only 54% of the U.S. spring wheat had been planted. The five-year average for this time is 89%. While states such as Idaho, Minnesota, South Dakota and Washington are mostly on schedule with their planting, Montana and North Dakota are significantly behind.
Even when the crop is finally planted, condition concerns may arise. Emergence for the spring wheat crop came in at 24% on May 22, which is drastically lower than the five-year average of 64%.
Van Trump says late planting in spring wheat brings the potential of a serious yield drag. “The major concern is that all-important flowering stage is pushed back deeper into the hot summer months,” he says. “The U.S.
spring wheat seeding pace is now the slowest on record since 1986, and we are getting so late producers must now seriously consider taking the preventive plant payments or switching acres to a different crop.”

Dry Conditions Across the Globe

Global wheat production is also under threat, Brugler says. Dry and hot conditions are taking toll on the wheat crops in parts of Canada, Germany, Russia, China and France.
“If the weather situation in Europe doesn't start to improve dramatically, we could be setting up for a major run higher as the world eventually looks to the US for supply,” says Van Trump.
While all are significant wheat producers, a smaller crop in Canada could have the biggest impact on the U.S. market. “Normally the U.S. can easily ship in wheat from Canada to make up for a short U.S. crop,” Brugler says. “But that might not be an option this year.”

Continued Ban of Black Sea Wheat

According to Brugler, the million-dollar question for wheat farmers now is how soon will the Black Sea lift their wheat ban and allow the crops to hit the market? And how much will that eat into everybody’s exports once that’s available?
“The U.S. has benefited over the last 12 months because of the lack of competition out of the Black Sea,” he says. “You hear rumors every couple of days that Russia is going to open up their market. But, I don’t think that will happen to at least July 1.”
Van Trump says the thought from many in the trade is if Russia lifts their export ban the global market will breathe a deep sigh of relief and prices will in turn ease. “I don't doubt that the initial market reaction will be lower prices, but you have to ask yourself if and when Russia does announce they will lift their ban on exports, just how much wheat will be available?”
He expects that long-term the market will recognize the move by the Russian government as being strictly political in nature and very few actual bushels will travel beyond the Russian borders.

How You Should React

“With so many balls in the air, I am highly inclined to believe one will bounce the wrong direction and you will have a chance to make some sales at higher prices in the coming months,” Van Trump says. “From a global perspective wheat is extremely expensive right now, the problem however is no one can afford to be without it.”
His advice is to consider waiting for a significant pull back to re-own. Additionally, if you are oversold, stand put and wait for this market to take off if you have more bushels to price. 
“I anticipate global demand will stay strong, therefore global production can ill afford any major glitches,” Van Trump says. “Right now the wheat market currently has ample supplies, but if a couple of countries fail to see significant improvements in weather all bets are off.”

Cocoa price revival 'will not last long'

by Agrimoney.com

The revival in cocoa futures, after they fell 25% from March's 32-year high, may prove nothing more than a temporary interruption in their correction, as the prospect of soaring West African supplies weighs on prices.
Cocoa prices have rebounded more than 5% in New York from a four-month low set on Tuesday, amid talk of bargain-hunting by consumers and lingering concerns over the resumption of exports from Ivory Coast, the top producer, following the lifting of a ban on shipments.
"Cocoa processors have shown a readiness to buy at declining levels," analysts at VM Group said.
"Many of them are able to show their finance departments a good result, as they have fortunately been able to buy well below what they thought they would face at the start of the year."
Meanwhile, among financial investors, there is an "obvious reluctance" to take short positions on cocoa, given that "only the brave or foolhardy" have visited Ivory Coast since December, and the rise of political tensions which led to the export ban.
'Impressively bearish'
However, these factors appeared unlikely to support prices for long, given the prospect of shipments resuming from Ivory Coast in earnest.
Olam International, the Singapore-based multi-commodities group, has forecast that 150,000 tonnes of the 500,000 tonnes of cocoa held up in Ivory Coast – equivalent to approaching 13% of world production – will be shifted in May and June.
On Friday, Eric Koffi, the director general of Ivory Coast's cocoa regulator, BCC, said that 80,000 tonnes of the bean had left the country's ports since the export ban was lifted last month, including 55,000 tonnes last week.
Meanwhile, soaring output from neighbouring Ghana, the second-ranked cocoa producer, was "impressively bearish" for prices, said VM, which undertakes research for ABN Amro.
The International Cocoa Organization on Thursday forecast Ghana's cocoa production soaring 52% to 960,000 tonnes in 2010-11, helping global output outpace consumption by 189,000 tonnes.
'Artificial rally'
"It's likely that international prices will start to crumble. This is a bear market for the time being," VM said.
The comments follow a warning from Barclays Capital analyst Sudakshina Unnikrishnan, who earlier this week forecast "further price weakness over coming months" as growing supplies weigh on the market.
At Hightower Report, Terry Roggensack warned that, technical analysis showed that "the market remains inside of a downtrend pattern on the charts".
He also attributed recent strength to purchases by investors of futures to hedge call option exposure, "which provides another clue of an artificial rally".
Cocoa for July stood $2 lower at $3,008 a tonne in morning trade in New York, after having earlier stood up 1.0%, at $3,040 a tonne.

See the original article >>

Wheat tumbles after Russia lifts grain export ban

by Agrimoney.com

Wheat tumbled nearly 5% in Paris as investors gave their first reaction to Russia's decision lift its grain export ban, forecasting that this year's harvest will be "quite good".
Paris's best-traded November lot hit E239.25 a tonne in early deals in response to Saturday's decision by Russia, renowned as a fierce competitor on prices, to lift from July 1 export curbs imposed in August, as the country's worst drought on record devastated crops.
Russia could export up to 20m tonnes of grain, if the harvest reaches its potential of 85m-90m tonnes, the Russian Grain Union, an industry lobby group, said on Monday.
As a further reason for caution, rain fell on some northern European areas, where a dearth of rainfall has helped spur a revival over the past two weeks.
"Germany has seen some rain these last few days and the three day forecast shows rain on the charts for south eastern UK, Germany and France," Jaime Nolan at broker FC Stone's Dublin office said.
Toepfer International said that showers this month had prevented yields in German grain crops falling below average levels, especially in the north of the country.
'Uncertainties remain large'
However, Toepfer, Germany's largest grain trading house, nonetheless forecast a drop to 22.8m-23.3m tonnes, from 24m tonnes, in the country's wheat harvest, the European Union's second biggest after France's.
The barley crop will fall to 9.0m-9.5m tonnes, from 10.4m tonnes, with rapeseed output set to fall to 4.4m-4.8m tonnes, from 5.7m tonnes - a decline of potentially more than 20% - reflecting irreversible damage from dry weather.
And Mr Nolan urged caution over the impact of the current rains. "It should be noted that areas across north western France will miss out and that the predicted rainfall is not very heavy across most parts," he said.
And Agritel, the Paris-based consultancy, said that the lifting of Russia's grain export ban had been "already relatively well integrated" into prices, having been the talk of the market for the last month or so.
"It should therefore have a limited impact on the market as uncertainties remain large yet."
Paris's November wheat contract had recovered some ground to stand at E242.&5 a tonne in lunchtime deals, down 3.1% on the day. Rapeseed, which was not covered by Russia's export ban, was E0.25 lower at E493.75 a tonne, on track for what would be its first fall in 12 trading days.
US markets are closed for the Memorial Day holiday, with London trading also shut for a bank holiday.
'Satisfactory condition'
Russia's decision to lift its export ban follows an improvement in prospects for spring sowings, after a late start to summer caused one of the slowest starts on record, with plantings now at 24m hectares, some 10% higher than a year ago.
Furthermore, rates of cold weather damage during the winter were relatively low.
"The condition of the winter crop is satisfactory and we believe that this year the grain harvest will be quite good," Russian deputy prime minister Viktor Zubkov said.
Russia expects to harvest 85m-90m tonnes of grain this year, up from 61m tonnes last year, if below the bumper crops of 97m tonnes in 2009 and 108m tonnes in 2008.
'Ever-greater stocks'
The lifting of the curbs also follows lobbying from grain traders alleged to have built up hefty stocks at ports in anticipation of a resumption in trade.
"It's clearly in the interest of Russian traders and farm bodies to talk of ever-greater stocks blocking up the silos as harvest approaches in order to get the ban lifted," a report from a leading European commodities house on Friday said.
However, the politics of the situation are clouded by the prospect of parliamentary elections in 2012, and a presdential vote in 2012, leading some observers to predict the government faces a difficult balancing act between keeping the agricultural lobby onside, but keeping food price inflation in check.

S&P 500 Sector Weightings; Tech Drops While Energy and Health Care Gain

by Bespoke Investment Group

lt has been awhile since we last posted our S&P 500 sector weighting charts, so now is as good of a time as any as we head into the long weekend. As it stands now, Technology remains the biggest sector in the S&P 500 with a weighting of 17.89%. The Financial sector remains the second biggest at 15.16%, followed by Energy (12.66%), Health Care (11.67%), and Industrials (11.02%). The two Consumer sectors (Discretionary and Staples) are the last two sectors with double digit weightings, and then Materials, Utilities, and Telecom are all way down in the 3s.

While the Technology sector holds on to the top spot, it has lost quite a bit of ground recently. As shown below, Technology's weighting has dropped 1.33 percentage points over the last six months. Consumer Discretionary and Consumer Staples have both lost ground as well, but not nearly as much as Technology. The sectors that have gained the most ground over the past six months are Energy (1.04 percentage points) and Health Care (0.49 percentage points). The Industrials sector has also seen a small increase in weighting as well.

Below we provide charts showing the historical changes in sector weightings for the ten S&P 500 sectors. In each chart we highlight the historical average since 1990 as well. The recent rollover in Technology can be seen pretty clearly in its chart. After bouncing back above its long-term average during the early part of the current bull market, the Financial sector has recently dipped back below its average. Health Care, on the other hand, has moved slightly above its average.


See the original article >>

GOLD STRENGTHENS IN REAL TERMS


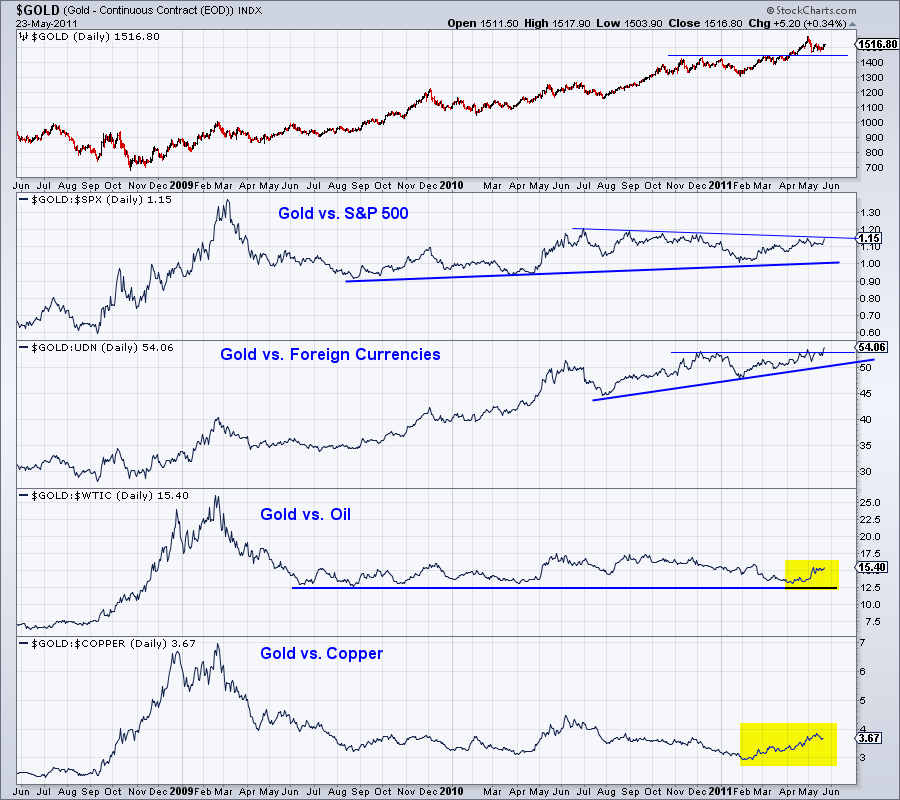
My favorite form of technical analysis is intermarket analysis which is the comparison of various markets and sectors. All markets relate in one way or another. The current market cycle is being dominated by macro-related events. Since all markets have had a stronger link than in the past, it makes intermarket analysis very important. By analyzing markets in the context of one another we can decipher or confirm the cycles within the current secular trends.

Most markets and sectors are digesting recent gains after a very strong run in the past six months. Recently we’ve pointed out that Bonds have caught a bid. More importantly, Gold is strengthening in real terms for the first time since the start of QE 2. Gold outperforms ahead of inflation and underperforms the Commodities sector during an inflationary phase.

Below we chart Gold against other markets.
Note that Gold priced in foreign currencies reached a new all-time closing high today. Keep an eye on Gold against the S&P 500. It is not far from reaching a two year high. Meanwhile Gold is strengthening against Oil and Copper.

Why should we care?

Since early 2009, Gold has actually underperformed equities and Commodities. When the economy rebounds, Commodities will outperform Gold. When the economy is stagnant and there is the threat of inflation or deflation, Gold will outperform. Also, as we’ve written numerous times, the real price of Gold is a leading indicator for the gold shares. The real price of Gold was stagnant over the past nine months and that is why the gold shares haven’t performed as well as anticipated.

With equities nearing multi-year resistance and the economy at risk of rolling over, Gold is currently quietly reasserting its strength against all other classes (except Bonds). This is the type of activity that precedes big moves in the metal and in the shares. This is setting the stage for the move out of conventional assets like equities and Bonds and into Gold.

See the original article >>

WHAT HAPPENS WHEN THE GOVERNMENT TIGHTENS ITS BELT?


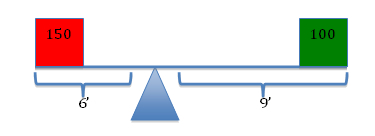
Imagine two people sitting on opposite ends of a 15-foot teeter-totter. The laws of physics dictate that the seesaw will balance if the product of the first mass (w1) and its distance (d1) from the fulcrum (i.e. the balancing point) is equal to the product of the other mass (w2) and its distance (d2) from the fulcrum. Thus, the physicist can show that the teeter-totter will be in balance when the fulcrum is placed 6 feet from the end holding a 150lb person and 9 feet from the end holding a 100lb person. Moreover, the laws of physics ensure that an imbalance will arise if the mass or the relative position of one of the people is changed.
The laws of accounting allow us to demonstrate that similarly powerful concepts apply to the science of economics. Beginning with the simple identity for GDP in a closed economy, we have:

[1] Y = C + I + G, where:

Y = GDP = National Income
C = Aggregate Consumption Expenditure
I = Aggregate Investment Expenditure
G = Aggregate Government Expenditure
 
For economists, this is as obvious as stating that a linear foot is the sum of 12 sequential inches. It simply recognizes that the total amount of money spent buying newly produced goods and services will yield an equivalent income to the sellers of these products. Thus, it demonstrates that expenditures are a source of income.

Once earned, income can be allocated in one of three ways. At the end of the day, all income (Y) will be spent (C), saved (S) or used in payment of taxes (T):

[2] Y = C + S + T

Since they are equivalent expressions for Y, we can set equation [1] equal to equation [2], giving us:

C + I + G = C + S + T

Or, after canceling (C) from both sides and moving terms around:

[3] (S – I) = (G – T)

Equation [3] shows that there is a direct relationship between what’s happening in the private sector (S – I) and what’s happening in the public sector (G – T). But it is not the one that Pete Peterson, Erskin Bowles, or President Obama would have you believe. And I want you to understand why they are wrong.

To understand the argument, imagine that you and Uncle Sam are sitting on opposite ends of a teeter-totter. You represent the private sector, and your financial status is given by (S – I). Your budget can be in balance (S = I), in deficit (S < I) or in surplus (S > I). When your financial status is positive (S > I), you are net saving. When your financial status is negative (S < I), you are net borrowing. Uncle Sam’s financial status is equal to (G – T), and, like yours, his budget may be balanced (G = T), in deficit (G > T) or in surplus (G < T). When you interact, only three outcomes are possible.

First, it is conceivable that (S = I) and (G = T) so that (S – I) = 0 and (G – T) = 0. When this condition holds, the teeter-totter will level off with each of you experiencing a balanced budget.

In the above scenario, the government is balancing its receipts (T) and expenditures (G), and you are balancing your savings and investment spending. There is no net gain/loss.

But suppose the government begins to spend more than it collects in taxes (i.e. G > T). How will Uncle Sam’s deficit affect your position on the teeter-totter? The answer is as straightforward as increasing the mass of the person on the right-hand side of the seesaw. As Uncle Sam’s financial position turns negative, your financial position turns positive.
This should make intuitive as well as mathematical sense, because when Uncle Sam runs a deficit, you receive more financial assets than you lose through taxation. Put simply, Uncle Sam’s deficit lifts you into a surplus position. Moreover, bigger deficits mean bigger surpluses for you.

Finally, let’s see what happens when Uncle Sam tightens his belt. Suppose, for example, that we were able to duplicate the much-coveted surpluses of 1999-2001. What would (and did!) happen to the private sector’s financial position?

Because the economy’s financial flows are a closed system – every payment must come from somewhere and end up somewhere – one sector’s surplus is always the other sector’s deficit. As the government “tightens” its belt, it “lightens” its load on the teeter-totter, shifting the relative burden onto you.

This is not rocket science, but it appears to befuddle scores of educated people, including President Obama, who said, “small businesses and families are tightening their belts. Their government should, too.” This kind of rhetoric may temporarily boost his approval ratings, but the policy itself will undermine the efforts of the very families and small businesses that are trying to improve their financial positions.

* I’ll be back with a second installment that shows what happens when we ‘open’ the economy to take into account the foreign sector (and the relevant financial flows). Many of us have been working with financial balance equations for years (see here for references), so the current effort is nothing new. I am merely trying to make the arguments more accessible by changing the way they are presented.

THE DOLLAR REMAINS IN A BEAR MARKET

By Carl Swenlin

As of 1/20/2011 the US Dollar Index is on a Trend Model SELL signal; however, it began to rally at the beginning of this month. After the initial rally launch, there was a period of consolidation. Then on Monday there was a clean break above the congestion area, and it seemed clear that the Index was headed for a challenge of the declining tops line drawn from the June 2010 top. That line was the top of a large falling wedge pattern that we normally expect to resolve upward.
Since the top earlier this week, the Index has shifted into a mini-collapse that quickly violated the short-term rising trend line, and changed the outlook from moderately positive to negative. Note that the 20-EMA was very close to crossing up through the 50-EMA, which would gave generated a Trend Model buy signal. Now the Index is below both EMAs, meaning that they are now declining and diverging. The PMO has topped.
Chart
The weekly chart shows that long-term overhead resistance is still an issue, and we can see that the Index turned down prior to reaching either of those lines of resistance.
Chart
Bottom Line: Several weeks ago it appeared that the Dollar Index was on the verge of a total collapse, and immediately after I said that, the rally began. At that point I said that a possible outcome would be that the bear market rally in the dollar would fail before it was able to cause a new buy signal to be generated. That is what appears to be happening now. The next thing we should expect is a retest of the May lows.

While we attempt to interpret the day-to-day squiggles and to anticipate what is going to happen next, let’s keep in mind that the Dollar Index is in a long-term bear market. Our expectations should be

THE RISK OF POLITICAL UNREST INCREASES IN EUROPE

by Cullen Roche

European leaders are quickly falling behind the curve as European citizens increasingly recognize that austerity is not solving their problems. The single currency system remains deeply flawed and all attempts to stabilize it thus far have been nothing more than swift kicks of the can. I’ve maintained that that can kicking can only last as long as the citizens of these nations remain ignorant of their reality – that they are suffering at the hands of austerity in order to ensure that bankers do not suffer.

In a worrisome turn of events over the weekend the Washington Post is reporting a return of the mass protests in Europe:
“ATHENS, Greece — About 30,000 people protested in Athens’ central Syntagma square on Sunday evening against the government’s tough economic austerity policies.
The demonstration, larger than many others that have taken place during Greece’s economic crisis, appeared to be the first that resulted from spontaneous calls over social media sites such as Facebook. Many others have been organized by unions or political factions.”
The biggest risk in Europe is not that Greece or any other nation will default. It is that the citizens will wake up to flaws of the single currency system and demand a complete reversal of the current course. That could result in defection from the Euro and a complete unraveling of the periphery nations. European leaders must stop focusing on ways to restructure debt and kick the can. Make no mistake – restructuring Greek debt, though necessary, will not fix the Greek economy and it will not stop the austerity that is causing this unrest. More importantly, none of the solutions that have been conceived thus far come close to fixing the inherent flaws in this single currency system.

Interestingly, there is a great lesson from the credit crisis that all leaders should heed. In America, we have a structural problem. We are a nation that has become dominated by financial interests and the result is a deeply indebted private sector that now relies on the aid of its government or its local banker to achieve growth. The American financial crisis was the markets way of telling the country to fix this structural flaw in the system. When we bailed out our banks we were openly saying that the markets were wrong. The response to the crisis has not been one of admittal. Instead, it has been one of denial.

We made a distastrous tactical error when we decided to choose the interests of the bankers over the people. Europe does not have to take that same route. We have not admitted that the system is flawed and in dire need of restructuring. And the result is that the world’s largest economy has an economic “recovery” with a laughable 9% unemployment rate and an economic strategy that is based on the same gimmicks that helped cause the crisis. Europe needs to recognize what the markets are telling these leaders that there is a structural flaw at work here. And it needs to be fixed. They cannot circumvent it with bank bailouts and can kicking strategies as the American policymakers attempted to achieve. If they do, these problems will merely present themselves at some later course in the same disastrous form.

They must find ways to make this single currency system sustainable for the long-run. And that might even involve (gasp!) haircuts for banks. Ultimately, there is only one true way to make this currency system viable and that involves the creation of a central treasury and greater political unity. We’re reaching a point where Europeans need to decide that they are either in this together or not. And the citizens are growing increasingly impatient watching their leaders try to patch together a system that clearly has inherent flaws as is currently constructed.

Macro Week in Review/Preview 5/28/2011


Last week’s review of the macro market indicators looked like a move higher for Gold but more downside for Crude Oil. The upside path looked to continue for US Treasuries but with a chance of a pullback for the US Dollar Index. The Shanghai Composite looks to reverse higher but not drastically with the Emerging Markets continuing lower or consolidating. Volatility looks to remain in check. The Equity Index ETF’s all look lower but like last week they will look to the QQQ for leadership to try to pull them higher, with the SPY and IWM looking weakest without any help. 

The week began with Gold higher and Crude Oil lower, but Crude quickly reversed by Tuesday. US Treasuries did continue higher and the US Dollar stalled before pulling back Friday. Policy change proved a catalyst for the Shanghai Composite to head lower and Emerging Markets did head lower but like Crude Oil reversed early in the week. The Equity Index ETF’s all gapped lower on Monday but had improved by week’s end. What does this mean for the coming week? Let’s look at some charts.

As always you can see details of individual charts and more on my StockTwits feed and on chartly.)

Gold Daily,$GC_F
gold d2 stocks
Gold Weekly,$GC_F
gold w3 stocks
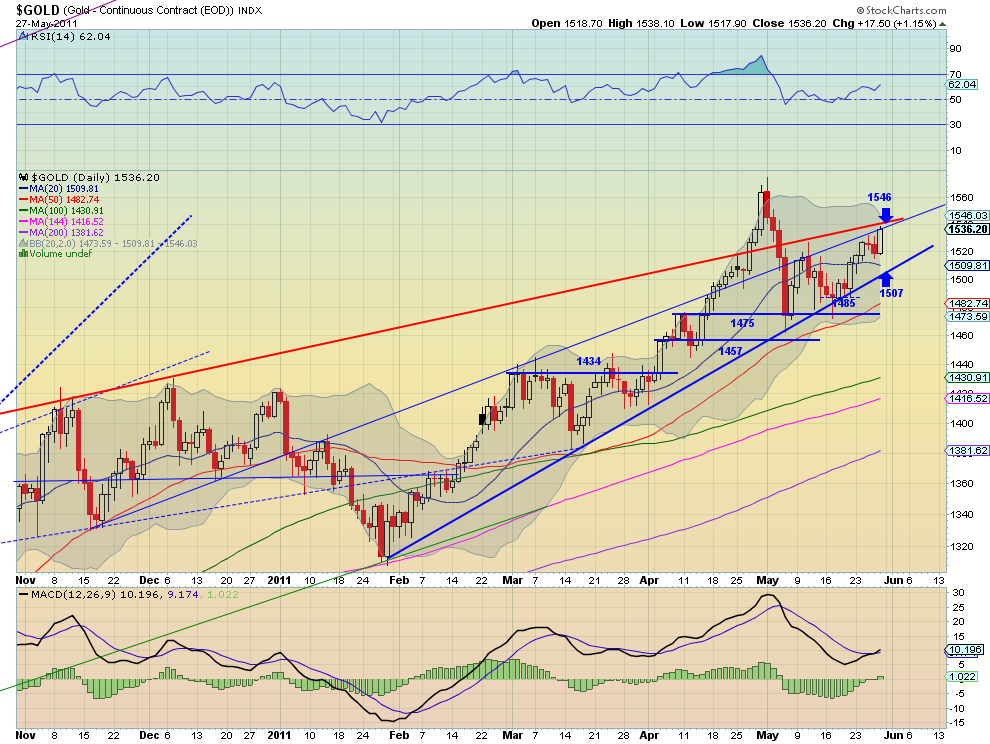
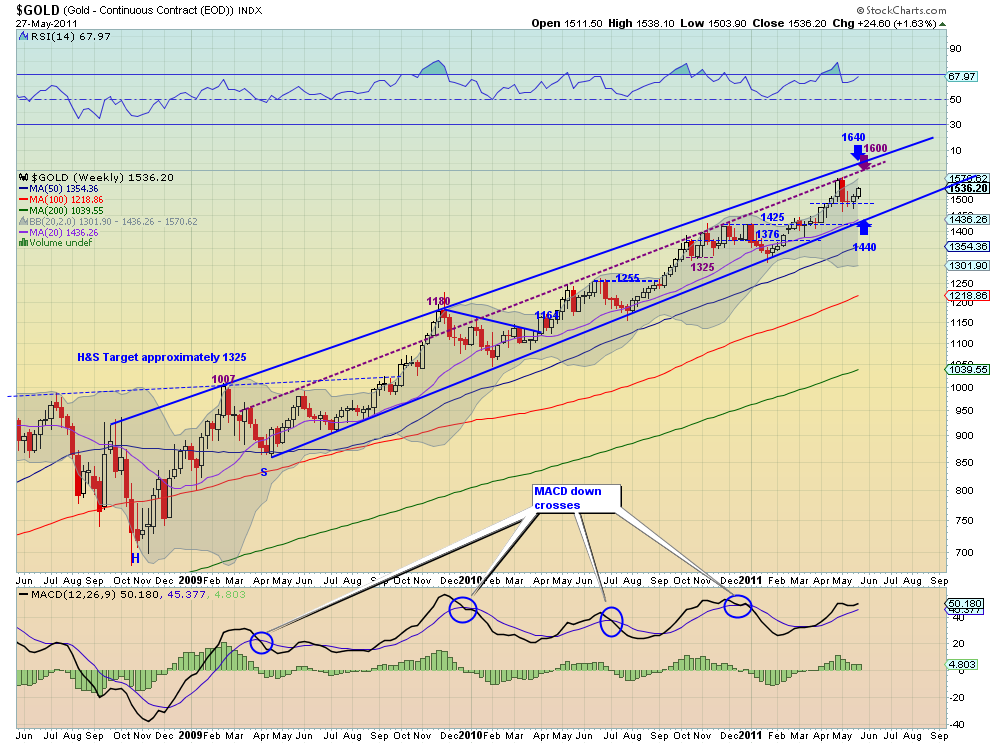
Gold had a good week continuing higher from last week. It ended the week at a short term resistance area as shown on the daily chart but with good support for more upside from a rising Relative Strength Index (RSI) and a Moving Average Convergence Divergence (MACD) indicator that has crossed higher. Above that resistance the previous is the last hurdle. The weekly chart shows that there is resistance of the rising trend lines of the channel much higher at 1600 and 1640. The weekly RSI has just turned back higher and the MACD has stopped declining. Look for more upside to Gold next week with any pullback limited to support at 1500 and 1485.

West Texas Intermediate Crude Daily,$CL_F
oil d2 stocks
West Texas Intermediate Crude Weekly,$CL_F
oil w3 stocks
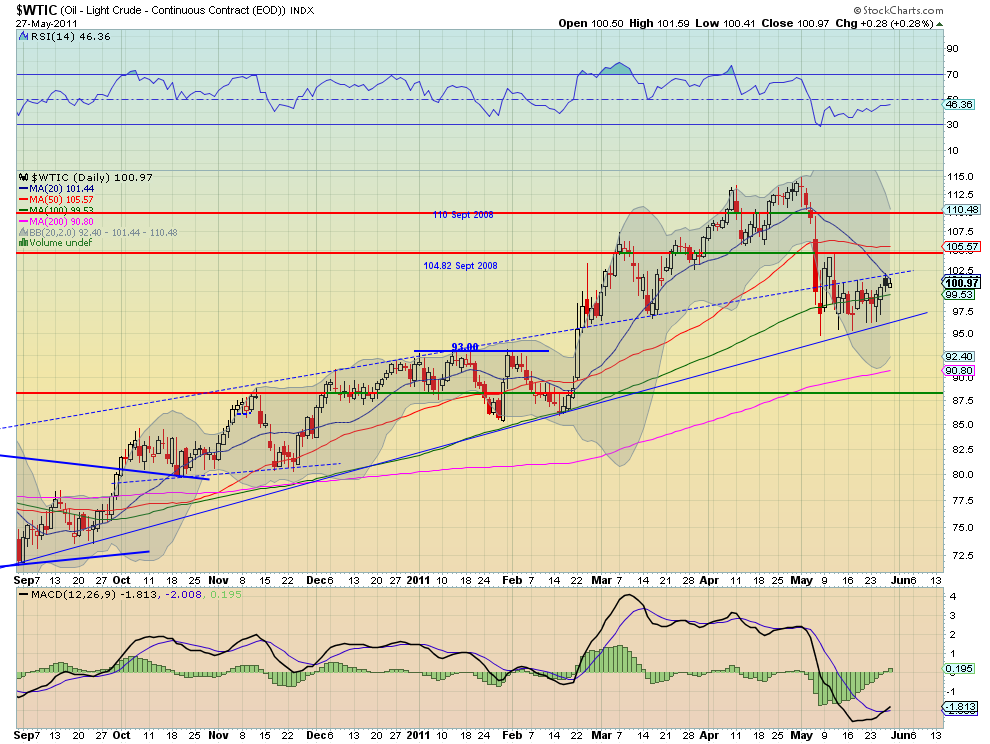
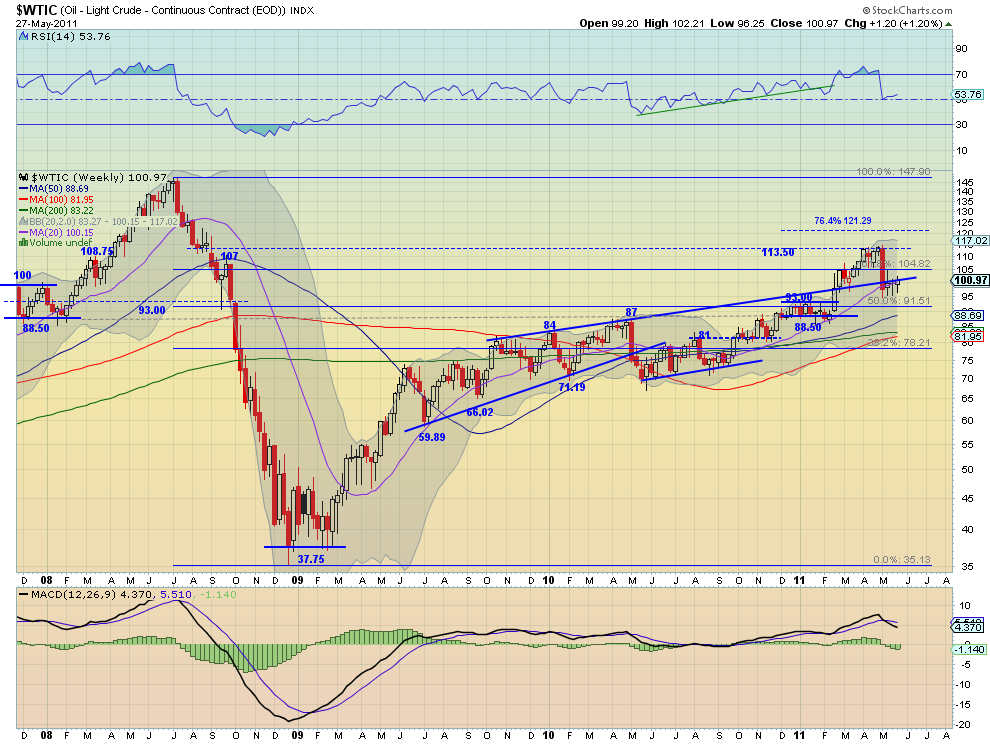
Crude Oil is attempting to break out of the bear flag on the daily chart higher but meeting resistance of the 20 day Simple Moving Average (SMA) and the rising resistance line. Above that trendline the long term support/resistance lines will play a role of resistance. The RSI on the daily chart is now trending higher and the MACD has just crossed up, both positive in the near term. The weekly chart has a RSI that has just bounced off of the mid line and is heading back higher. The MACD still looks lower though. Look for Crude Oil to continue to drift higher next week within a channel loosely bound by the rising trendline and the 104.82 Fibonacci level to the upside and the rising support lie and the 100 day/20 week SMA below.

US Dollar Index Daily,$DX_F
usd d2 stocks
US Dollar Index Weekly,$DX_F
usd w3 stocks
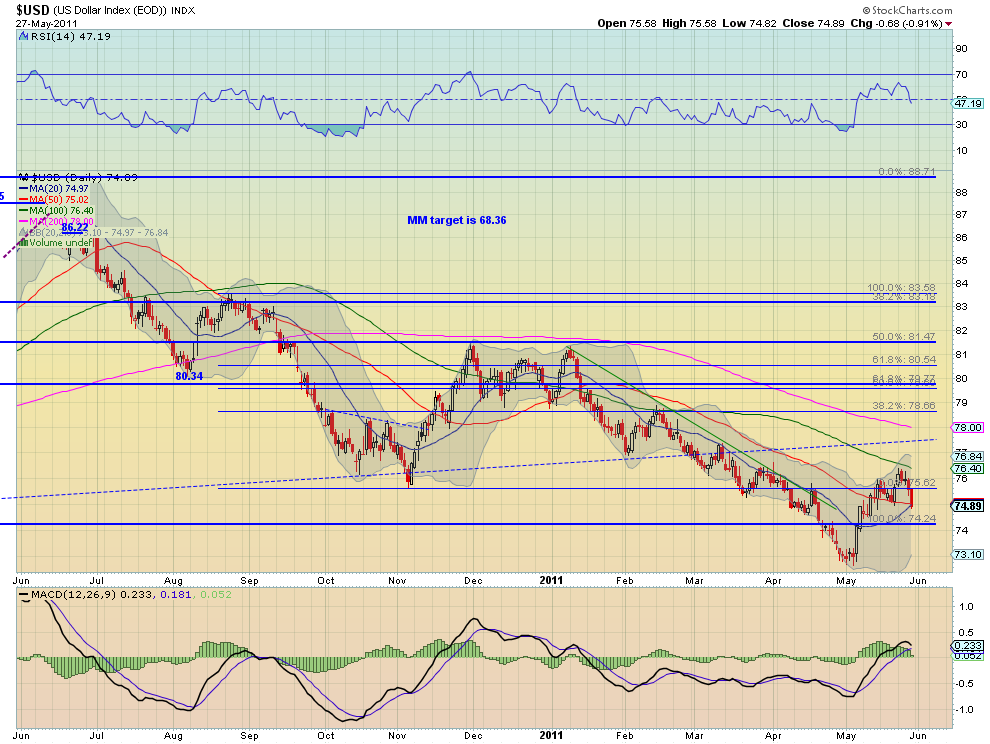
The US Dollar Index fell for the week and looks to be headed lower. The daily chart has a RSI that is steeply sloping lower and a MACD that is about to cross negative. The price has fallen through 20 and 50 day SMA and made a lower low. The weekly chart also has a falling RSI but with a MACD that is flat. Finally with 7 of the eight SMA between the two charts sloping lower the downside is favored again. There are only 5 support levels all from the weekly chart between the Index and new all time lows (74.80, 74.10, 73,72, and 71.50) and a Measured Move (MM) would put a first target at 68.

iShares Barclays 20+ Yr Treasury Bond Fund Daily,$TLT
tlt d3 e1306534924934 stocks
iShares Barclays 20+ Yr Treasury Bond Fund Weekly,$TLT
tlt w4 e1306534947937 stocks
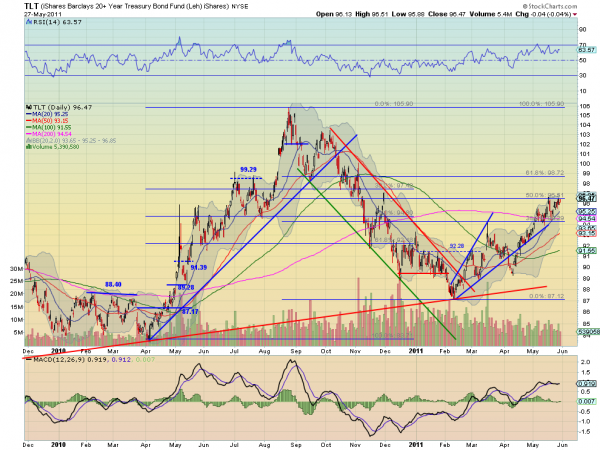
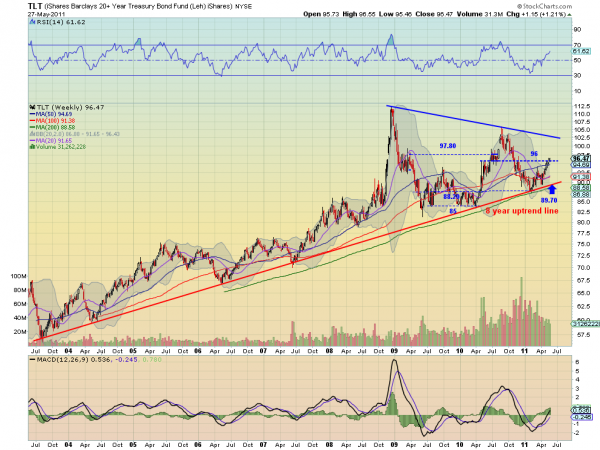
US Treasuries, measured by the TLT ETF, moved higher for the week and are testing the high from earlier in the month near a 50% retracement of the 2010 down move. The RSI on the daily chart is holding in bullish territory and the MACD is flat. On the weekly chart you can see that it is in a symmetrical triangle with the center line near that 96.51 50% retracement level. Both the RSI and MACD are supporting a bullish move higher. Look for TLT to continue higher next week with several minor resistance levels from the over lapping Fibonacci’s slowing it as it works toward the top of the triangle near 102.50.

Shanghai Stock Exchange Composite Daily,$SSEC
ssec d2 stocks
Shanghai Stock Exchange Composite Weekly,$SSEC
ssec w3 stocks
The Shanghai Composite continued lower with a MM on the daily chart of 2630 now within its sites. The RSI and MACD on the daily chart suggest more downside, and those indicators on the weekly chart concur. Stepping back to the weekly chart shows a fall out of the long symmetrical triangle with a long bearish Marubozu candle. Look for more downside next week with the previous channel between 2590 and 2695 giving support and then 2357 below that. The target for the pattern break would roughly be the previous low around 1700.

iShares MSCI Emerging Markets Index Daily,$EEM
eem d1 stocks
iShares MSCI Emerging Markets Index Weekly,$EEM
eem w3 stocks
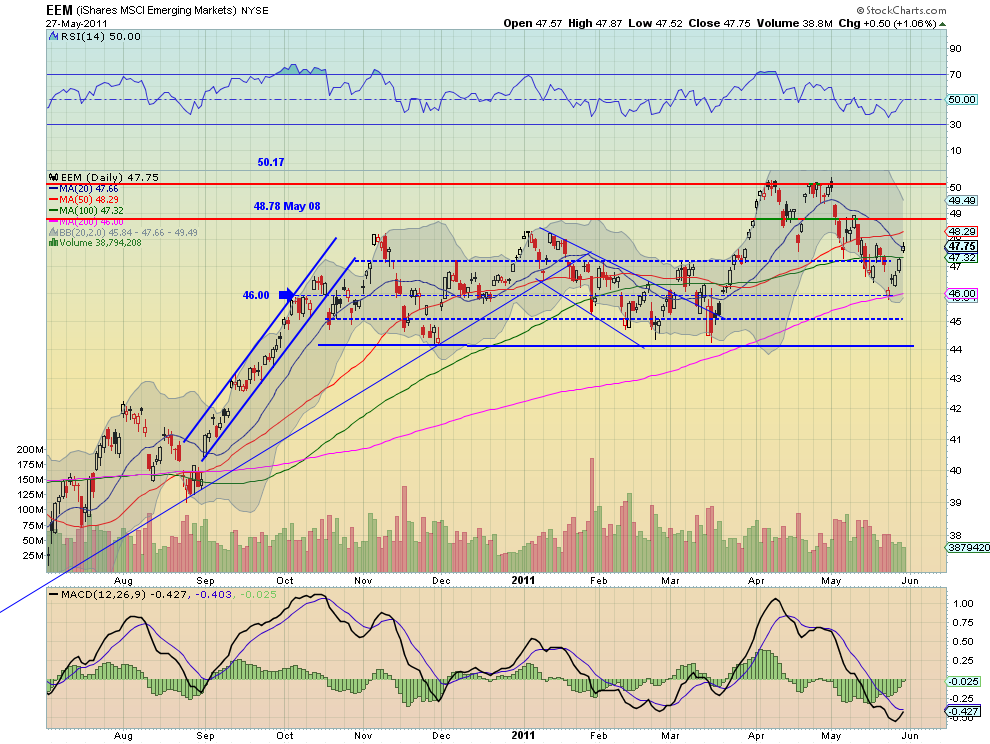
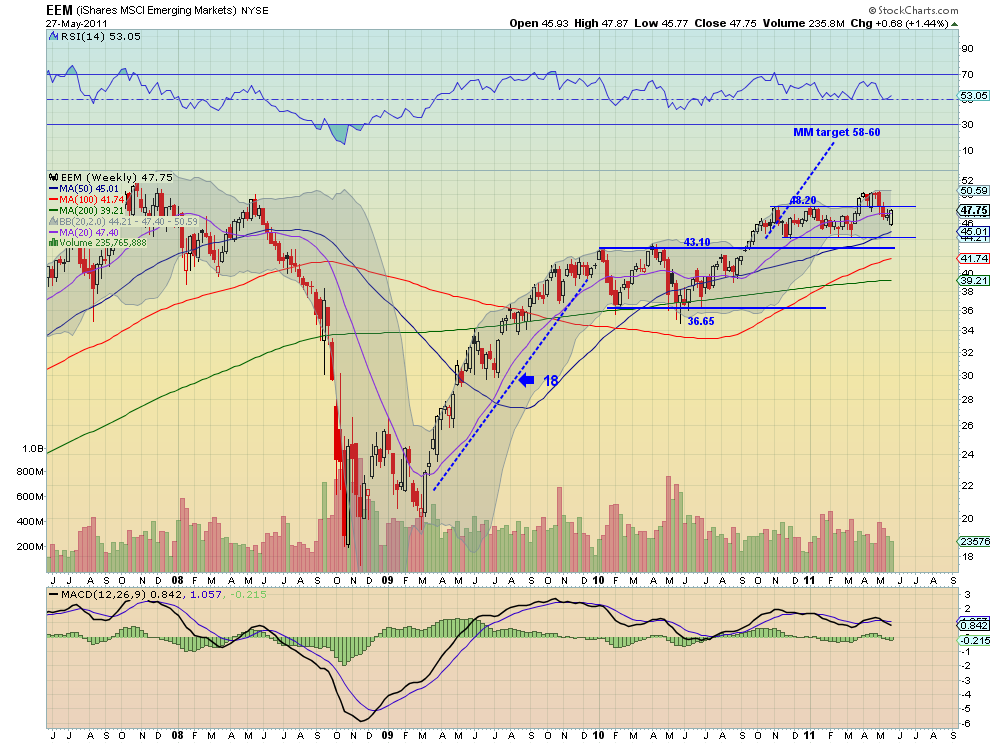
Emerging Markets, as measured by the EEM ETF, had a series of gap up days for the week leading to a bullish engulfing candle on the weekly chart. The RSI on both charts points higher and the MACD on the daily chart is making a bullish cross up. Look for more upside for the EEM next week with resistance nearby at 48.20 then 48.78 and then the previous highs just over 50. 

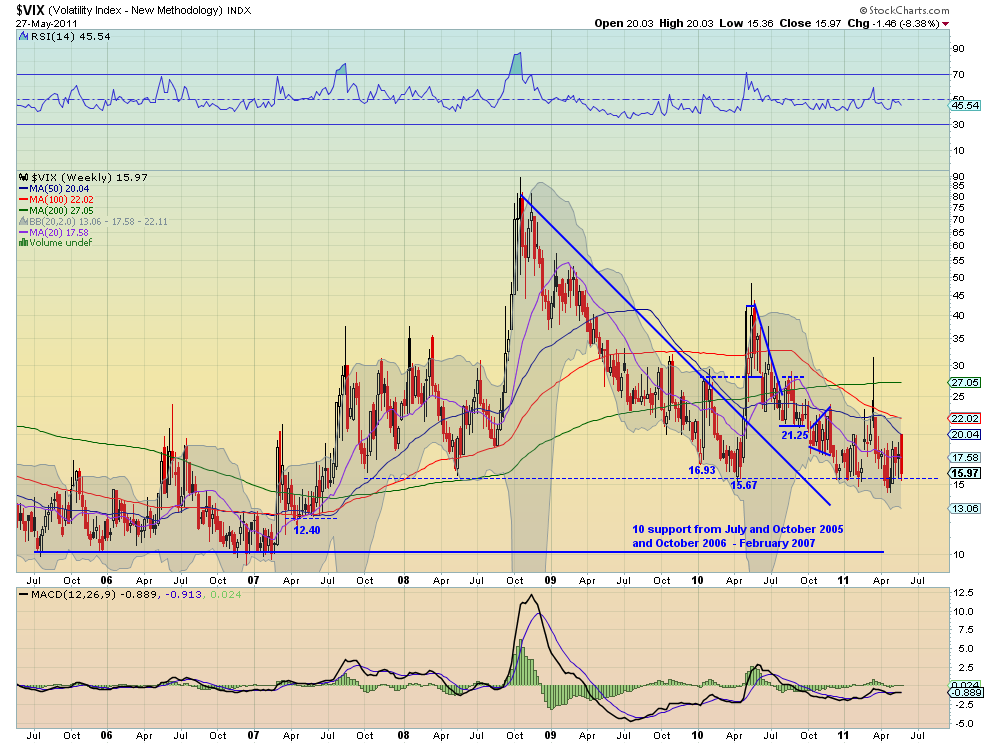
VIX Daily,$VIX
vix d2 stocks
VIX Weekly,$VIX
vix w3 stocks
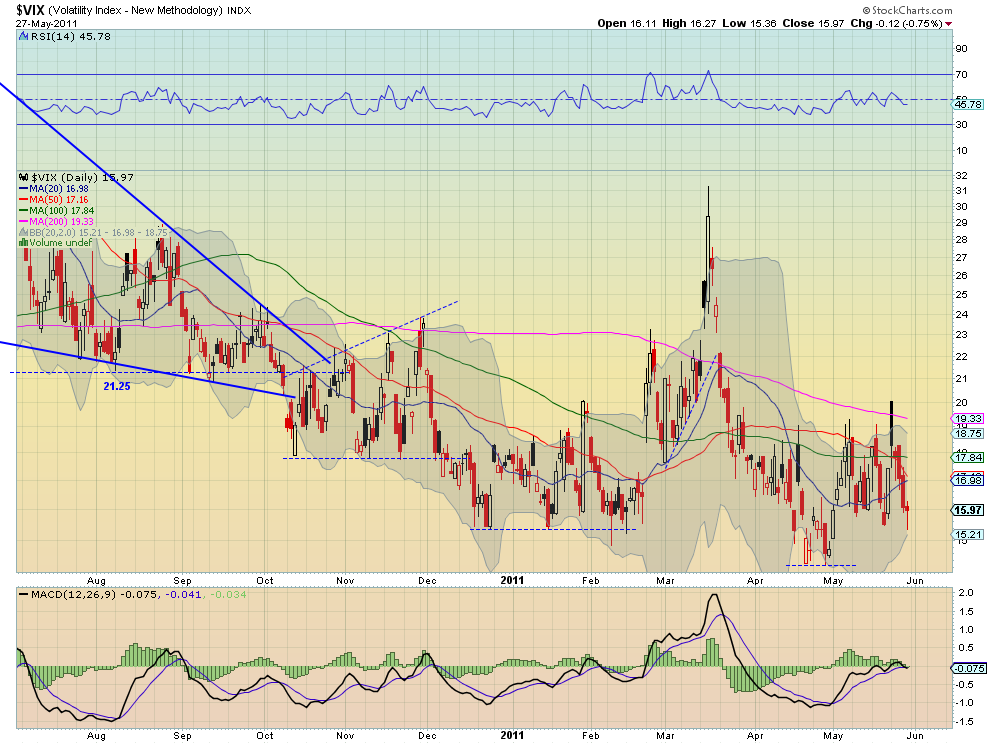
The Volatility Index expanded its range again slightly this week but remained low. Both the daily and weekly charts show that the RSI and MACD are giving no clues about the future direction. But the SMA’s continue to meander sideways to slightly down suggesting more of the same to come. Look for the upside to be limited by the 21.25 area and the downside by 15.50 in the coming week. 

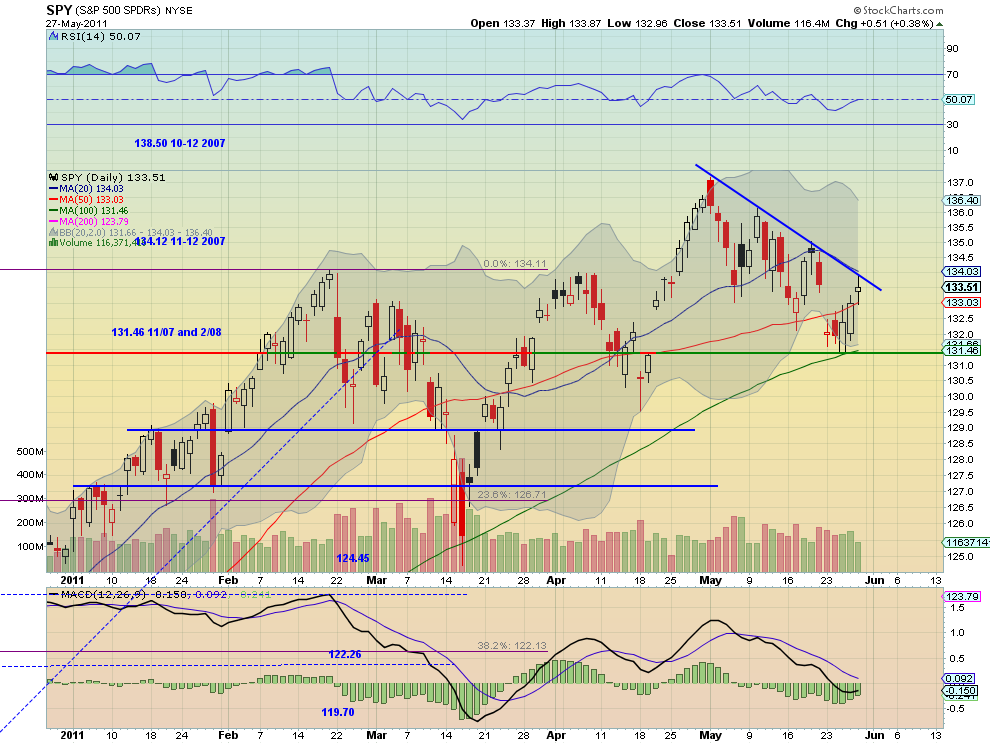
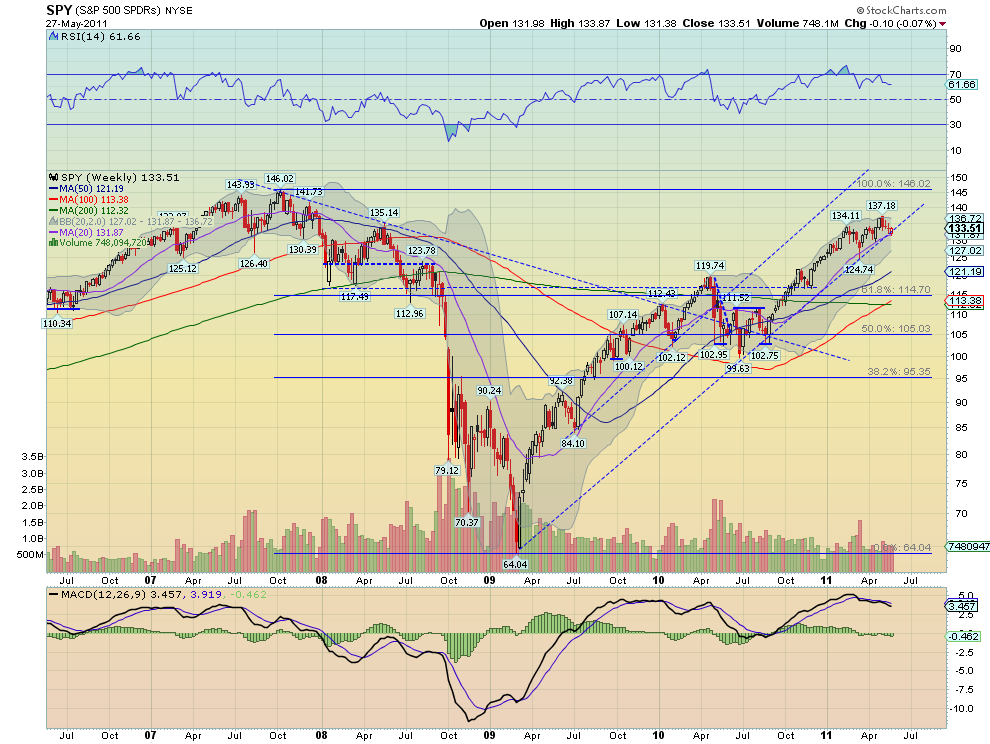
SPY Daily,$SPY
spy d2 stocks
SPY Weekly,$SPY
spy w4 stocks
The SPY gapped down on Monday finding support at the intersection of the 100 day SMA and the long term support/resistance level at 131.46 before rising to close the gap Friday, ending almost unchanged for the week. The daily charts shows that the downtrend line still holds, but the MACD is improving as the RSI flattens at the mid line. The weekly chart shows the bounce off of the rising trend line from the March 2009 lows. The Bollinger bands are getting tight on the weekly chart. SPY need to break the downtrend and put in a higher high above 135.11 to break the short term downtrend. The indicators on the weekly chart (RSI and MACD) both suggest that this may be tough to do. If it rejects below the trendline on the daily chart and the rising trend line on the weekly chart look for a fresh wave of selling and a continued push lower with support first at 131.46 and then 130. My bias for next week remains to the downside until 135.11 is broken.

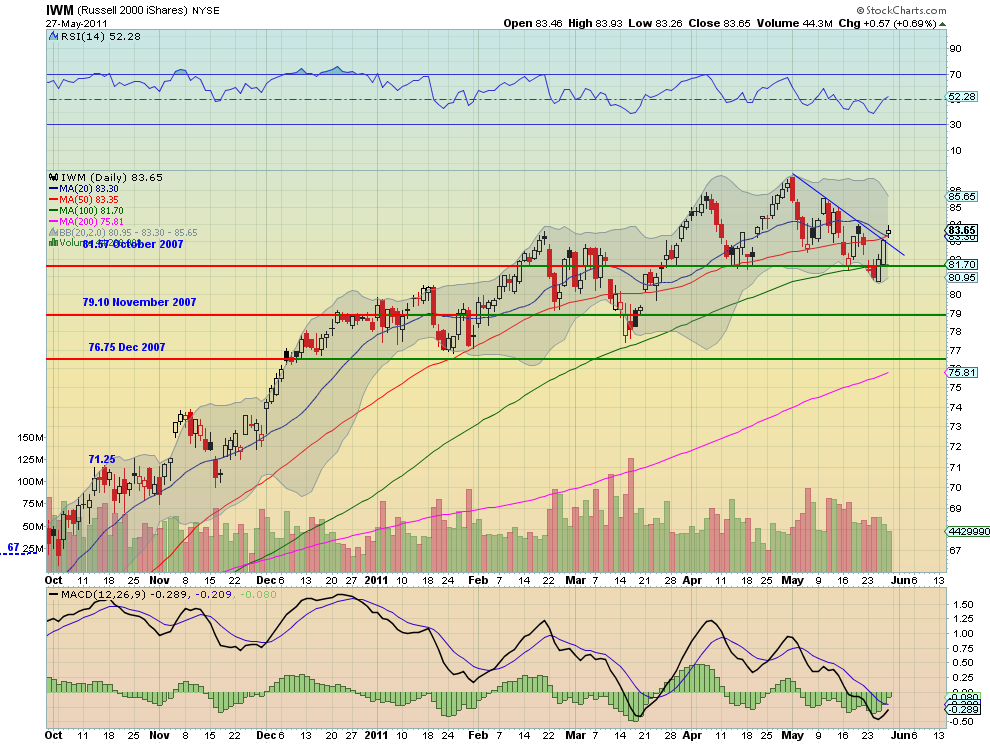
IWM Daily,$IWM
iwm d2 stocks
IWM Weekly,$IWM
iwm w3 stocks
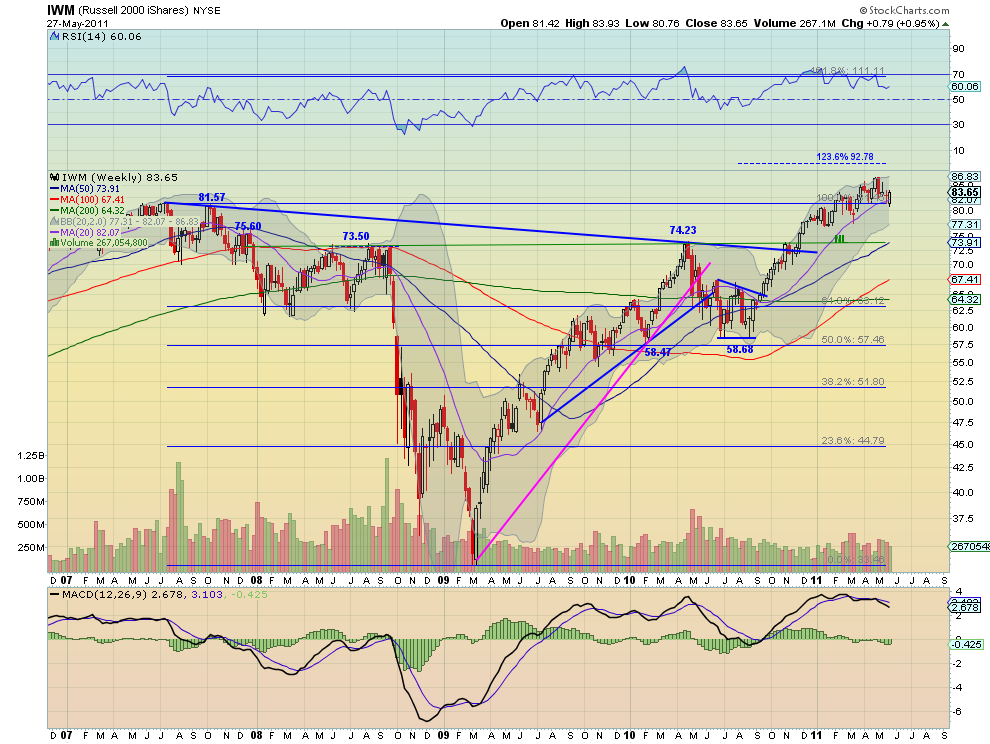
The IWM broke above the falling trend line and both the 20 and 50 day SMA on the daily chart after starting the week with a gap down. It finished the week nearly making a higher high, but not quite. The RSI and the MACD on the daily chart suggest that there is more upside to come. The weekly chart is not so conclusive. It printed a bullish engulfing candle that rose off of the long term support/resistance level at 81.57. The RSI on the weekly chart is meandering, but at bullish levels, band the MACD is improving. My bias is to the upside for next week for IWM but I will feel more comfortable with it going further if it gets above 85. A fall below 80.75 will change my view to bearish with support at 79.10 first.

QQQ Daily,$QQQ
q d3 e1306537460220 stocks
QQQ Weekly,$QQQ
q w3 stocks
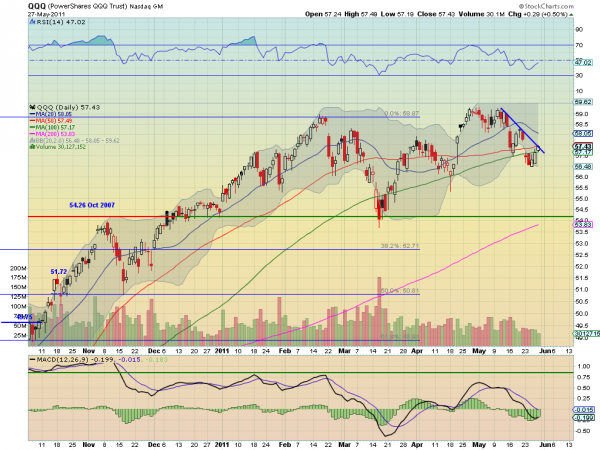
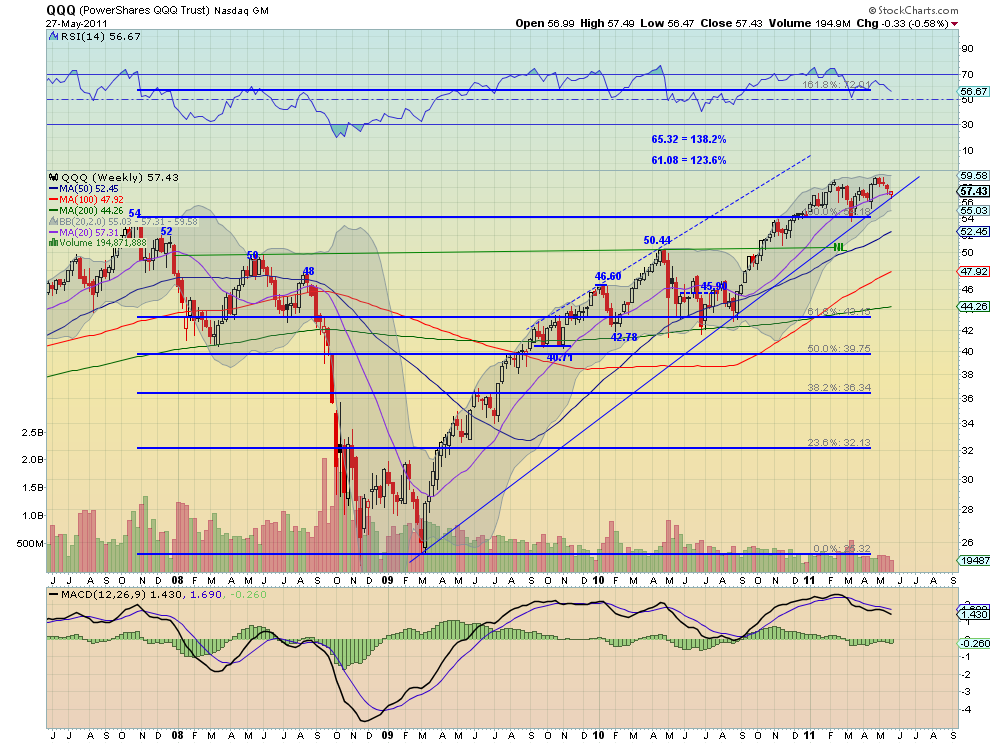
The QQQ also gapped down on Monday finding support near 56.50, just under the 100 day SMA, before rising Friday to the 50 day SMA, but leaving the gap open. The daily charts shows that the downtrend line still holds, but the MACD is improving as the RSI rises to the mid line. The weekly chart shows the bounce off of the rising trend line from the March 2009 lows. The Bollinger bands are getting tight on the weekly chart. QQQ needs to break the downtrend and put in a higher high above 58.34 to break the short term downtrend. The indicators on the weekly chart (RSI and MACD) both suggest that this may be tough to do. If it rejects below the trendline on the daily chart and the rising trend line on the weekly chart look for a fresh wave of selling and a continued push lower with support first at 56 and then 54.26. My bias for next week remains to the downside until 58.34 is broken. 

So next week looks for more upside for Gold and a drift higher for Crude Oil. The US Dollar Index looks headed to test the recent lows while US Treasuries continue higher. The Shanghai Composite looks to continue lower after falling out of the symmetrical triangle while Emerging Markets head higher toward resistance. With continued stable and low Volatility the Equity Index ETF’s are diverging, with the IWM looking better to the upside while the SPY and QQQ need to break resistance to join it and so are looking better to the downside. This divergence should resolve soon but could also lead to more sideways action. Use this information to understand the major trend and how it may be influenced as you prepare for the coming week ahead. Trade’m well.

When Faith In U.S. Dollars And U.S. Debt Is Dead The Game Is Over – And That Day Is Closer Than You May Think

by The Economic Collapse

A day is coming when the rest of the world will decide that it no longer has faith in U.S. dollars or in U.S. debt. When that day arrives, the game will be over. Traditionally, two of the biggest things that the U.S. economy has had going for it were the U.S. dollar and U.S. Treasuries. The U.S. dollar has been the default reserve currency of the world for decades. All over the globe it was seen as a strong, stable currency that was desirable for international trade. U.S. government debt has long been considered the "safest debt" in the entire world. Whenever there was a major crisis, investors would flock to U.S. Treasuries because they were considered a rock. Sadly, all of this is now changing. Today the rest of the world is losing faith in the U.S. financial system. In fact, even the United Nations is now warning of the collapse of the dollar. But if the U.S. dollar and U.S. Treasuries collapse, that will be an absolute nightmare for the U.S. economy. If the rest of the world does not want our dollars someday, then what are we going to give them in exchange for all of the oil and all of the cheap imported goods they send us? If the rest of the world does not want our debt someday, then how in the world are we going to be able to continue to consume far, far more wealth than we produce?

The rest of the world is watching the U.S. government run up record-setting budget deficits and they are watching the Federal Reserve print money like there is no tomorrow and they realize that the U.S. financial system is slowly imploding.

As mentioned above, now even the United Nations is warning that the U.S. dollar could collapse. The following is a brief excerpt from a recent news report put out by Reuters....
The United Nations warned on Wednesday of a possible crisis of confidence in, and even a “collapse” of, the U.S. dollar if its value against other currencies continued to decline.
In a mid-year review of the world economy, the UN economic division said such a development, stemming from the falling value of foreign dollar holdings, would imperil the global financial system.
But it is not just the United Nations that is concerned about the U.S. dollar.

On April 18th, Standard & Poor’s altered its outlook on U.S. government debt from "stable" to "negative" and warned that the U.S. could soon lose its prized AAA rating.

At one time, it would have been unthinkable for Standard & Poor's to do such a thing.
But today it is amazing that it has taken them so long to make such a move. U.S. government finances are falling apart.

When the credit rating of U.S. government debt starts declining, interest rates will go up. Just ask the government of Greece how painful that can be. Today, Greece is paying over 16 percent on 10 year bonds.

The following is what John Williams of Shadow Government Statistics recently had to say about why Standard & Poor's issued such a warning about U.S. government debt....
S&P is noting the U.S. government's long-range fiscal problems. Generally, you'll find that the accounting for unfunded liabilities for Social Security, Medicare and other programs on a net-present-value (NPV) basis indicates total federal debt and obligations of about $75 trillion. That's 15 times the gross domestic product (GDP). The debt and obligations are increasing at a pace of about $5 trillion a year, which is neither sustainable nor containable. If the U.S. was a corporation on a parallel basis, it would be headed into bankruptcy rather quickly.
Look, the rest of the world is not stupid. They know that the U.S. government is hurtling towards financial disaster. The appetite among foreigners for U.S. government debt is decreasing rapidly.

In fact, according to Zero Hedge, foreigners are dumping U.S. debt at a very rapid pace right now.
In addition, the cost to insure U.S. debt has risen sharply in recent days.

Right now, the Federal Reserve has been buying up most new U.S. government debt with dollars that it has created out of thin air. This is a giant Ponzi scheme, and it is a major contributing factor to the decline of faith in the U.S. dollar.

The dollar has fallen by 17 percent compared to other major national currencies since 2009. What makes that fact even sadder is that all major currencies have been rapidly losing value compared to hard assets over that time period. The dollar is just sliding faster than almost all of the other global currencies that are constantly losing value as well.

Anyone with half a brain could have seen that this would be the end result of reckless government borrowing, but unfortunately our politicians have been ignoring this problem for decades.

Now a day or reckoning is fast approaching and it is going to be very painful.

The U.S. government has piled up the biggest mountain of debt in the history of the world. Just consider a few shocking facts about this unprecedented debt....

*If the U.S. national debt (more than 14 trillion dollars) was reduced to a stack of 5 dollar bills, it would reach three quarters of the way to the moon.

*The U.S. government borrows about 168 million dollars every single hour.

*If Bill Gates gave every penny of his fortune to the U.S. government, it would only cover the U.S. budget deficit for 15 days.

*It is now being projected that by the year 2021, interest payments on the national debt will amount to $1.1 trillion dollars a year.

In a previous article on The American Dream, I detailed some more absolutely horrifying statistics about U.S. government debt....

#1 If you divide the national debt up equally among all U.S. households, each one owes a staggering $125,475.18.

#2 The federal government has borrowed 29,660 more dollars per household since Barack Obama signed the economic stimulus law two years ago.

#3 During Barack Obama's first two years in office, the U.S. government added more to the U.S. national debt than the first 100 U.S. Congresses combined.

#4 In the new budget that the Obama administration has proposed, the U.S. government would spend 3.7 trillion dollars in 2012 and by 2021 the U.S. government would be spending a whopping 5.6 trillion dollars per year.

#5 The U.S. government currently has to borrow approximately 41 cents of every single dollar that it spends.

#6 The total compensation that the federal government workforce earned last year came to a grand total of approximately 447 billion dollars.

#7 The U.S. national debt is currently rising by well over 4 billion dollars every single day.

#8 The U.S. government is borrowing over 2 million more dollars every single minute.

#9 The U.S. national debt is over 14 times larger than it was just 30 years ago.

#10 Unfunded liabilities for entitlement programs such as Social Security and Medicare are estimated to be well over $100 trillion, and nobody in the U.S. government seems to have any idea how we are actually even going to come close to meeting all of those obligations.
#11 If you were alive when Christ was born and you spent one million dollars every single day since that point, you still would not have spent one trillion dollars by now. But this year alone the U.S. government is going to go about 1.6 trillion dollars more into debt.

#12 If the federal government began right at this moment to repay the U.S. national debt at a rate of one dollar per second, it would take over 440,000 years to pay off the national debt.

So have our politicians learned anything from the mistakes of the past?
No.

The U.S. government continues to spend money on some of the most ridiculous things imaginable. For example, the Department of Health and Human Services has just announced a brand new $500 million program that will, among other things, seek to solve the problem of 5-year-old children that "can't sit still" in a kindergarten classroom.

Isn't it good to see the government investing our hard-earned tax dollars so wisely?

Of course if our kids weren't being constantly fed foods packed with sugar, high fructose corn syrup and aspartame we wouldn't have to spend 500 million dollars to deal with this problem.

When it comes to government waste, nobody seems to do it any better than the U.S. government.

Our politicians continue to assume that the rest of the world will always want our dollars and our debt, but that is simply not the case.

Over the past couple of years, global leader after global leader has publicly talked about the need for a new world reserve currency.

In fact, globalist institutions such as the IMF and the World Bank have been very busy discussing what the world is going to use as a global reserve currency after the death of the dollar.

The rest of the world is not sitting around waiting to see if the U.S. financial system is going to recover. They are already making plans for the demise of the dollar. They are increasingly using other currencies to trade with. They are becoming more hesitant to buy more of our debt. They are realizing that the days of U.S. dominance are coming to an end.

So what is that going to mean for us?

It is going to be a complete and total disaster.

Right now, we live far, far beyond our means. We borrow gigantic piles of money to make up the difference between what we produce and what we consume. We are absolutely dependent on the fact that the rest of the world will take our dollars in exchange for the things that we need.

The current situation is not sustainable.

It will come to an end.

When it does, our standard of living is going to feel like it has changed overnight.

Greek, Irish Risks Transferred to ECB

By Barry Ritholtz

Speigel has an interesting discussion on the Euro:
Since the beginning of the financial crisis, banks in countries like Ireland, Portugal, Spain and Greece have unloaded risks amounting to several hundred billion euros with central banks. The central banks have distributed large sums to their countries’ financial institutions to prevent them from collapsing. They have accepted securities as collateral, many of which are — to put it mildly — not particularly valuable.
Risks Transferred to ECB: These risks are now on the ECB’s books because the central banks of the euro countries are not autonomous but, rather, part of the ECB system. When banks in Ireland go bankrupt and their securities aren’t worth enough, the euro countries must collectively account for the loss. Germany’s central bank, the Bundesbank, provides 27 percent of the ECB’s capital, which means that it would have to pay for more than a quarter of all losses.
The full piece is worth a read . . .
>
click for larger graphic


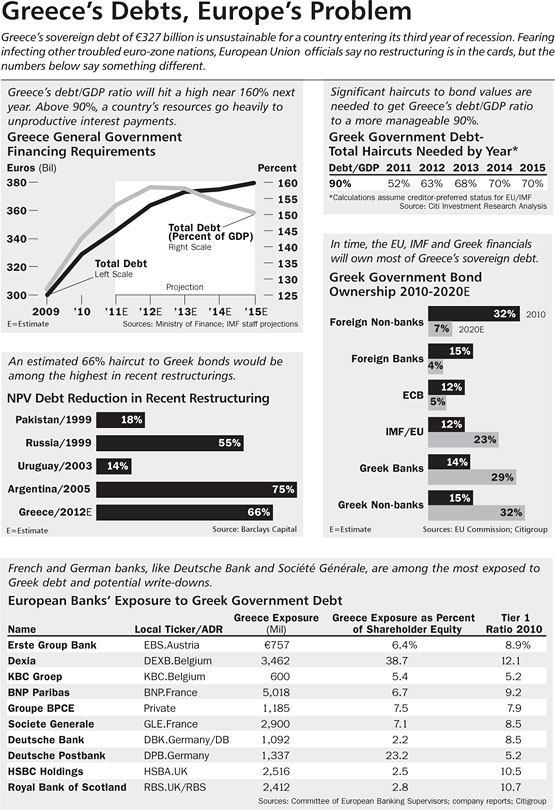
Greece’s Debts Europe’s Problem

what the hell, click on the graphic

Ireland may need more EU/IMF cash: minister

By Carmel Crimmins and Angeliki Koutantou

Ireland may have to ask for another loan from the European Union and International Monetary Fund because it will struggle to return to debt markets to raise funds next year, a government minister said on Sunday.
In comments to The Sunday Times newspaper, Transport Minister Leo Varadkar became the first cabinet member to cast doubt in public on Ireland's ability to raise cash on the bond market because of punishing yields demanded by investors.

"I think it's very unlikely we'll be able to go back next year. I think it might take a bit longer ... 2013 might be possible but who knows?" Varadkar was quoted as saying.

"It would mean a second program (of loans from the EU/IMF)," he said. "Either an extension of the existing program or a second program. I think that would generally be most people's view."

Deputy Prime Minister Eamon Gilmore told broadcaster RTE that fears of a domino effect from Greece's problems were overblown. The possibility of a Greek default has sent bond yields rocketing for indebted Ireland, Portugal and Spain.

"It's not a situation that if Greece defaults then there are immediately implications for Ireland," Gilmore said.

"If Greece defaults there are implications for the wider euro zone and obviously we are part of that."
"It is wrong to put Ireland in the same basket as Greece."

PRIVATISATION AMBITIONS

Greece's hopes of averting default dimmed over the weekend amid fears the country, whose debt burden stands at around 330 billion euros, may have missed fiscal targets set by its creditors.

The IMF has dismissed reports that an international inspection team had found that Greece had missed all its fiscal targets. But the current mission to Athens has stayed far longer than on previous occasions and is locked in talks with the government to get economic reforms on track.

Athens' creditors are increasingly focused on the possibility of raising more funds from privatizations and a poll on Sunday showed that an overwhelming majority of Greeks are in favor of selling and developing state assets to raise 50 billion euros.

The European Central Bank and the IMF, however, don't believe the privatization program is ambitious enough. ECB board member Juergen Stark said Greece could raise six times more than the 50 billion euros planned from asset sales, echoing earlier views from the IMF.

A Greek paper reported on Sunday that the government was considering setting up a Spanish-style "bad bank" to clean up its lenders' accounts from "toxic" Greek bonds and make them more attractive to potential buyers.

Athens is in a race against time to secure political consensus on fiscal reforms before the EU and the IMF will free up more cash to plug funding gaps in the next two years.

Ireland, meanwhile, wants to tap investors for funding in 2012 before its 85 billion euros EU-IMF bailout runs out the following year.

But investors believe Ireland will be unable to return to the market and instead will have to tap the European Union's permanent rescue fund in 2013, which might require some restructuring of privately held sovereign debt.

Reflecting this medium-term risk, Ireland's two-year and five-year paper are yielding close to 12 percent, more than its 10-year bonds on the secondary market.

Some 50 billion euros of the existing EU-IMF bailout has been earmarked for sovereign funding requirements with the remainder set aside to prop up the country's ailing banks.

Earlier this month, the IMF said whatever was left over after recapitalizing the banks could be channeled to the sovereign if there was a delay in returning to markets.

At the end of March, the Irish government said the banks needed 24 billion euros to bulletproof their balance sheets but Dublin hopes some five billion euros can be raised from imposing losses on junior bondholders and asset sales, meaning that 19 billion euros of the 35 billion would be tapped.

Follow Us