by
Last week’s review of the macro market indicators looked like a move higher for Gold but more downside for Crude Oil. The upside path looked to continue for US Treasuries but with a chance of a pullback for the US Dollar Index. The Shanghai Composite looks to reverse higher but not drastically with the Emerging Markets continuing lower or consolidating. Volatility looks to remain in check. The Equity Index ETF’s all look lower but like last week they will look to the QQQ for leadership to try to pull them higher, with the SPY and IWM looking weakest without any help.
The week began with Gold higher and Crude Oil lower, but Crude quickly reversed by Tuesday. US Treasuries did continue higher and the US Dollar stalled before pulling back Friday. Policy change proved a catalyst for the Shanghai Composite to head lower and Emerging Markets did head lower but like Crude Oil reversed early in the week. The Equity Index ETF’s all gapped lower on Monday but had improved by week’s end. What does this mean for the coming week? Let’s look at some charts.
As always you can see details of individual charts and more on my StockTwits feed and on chartly.)
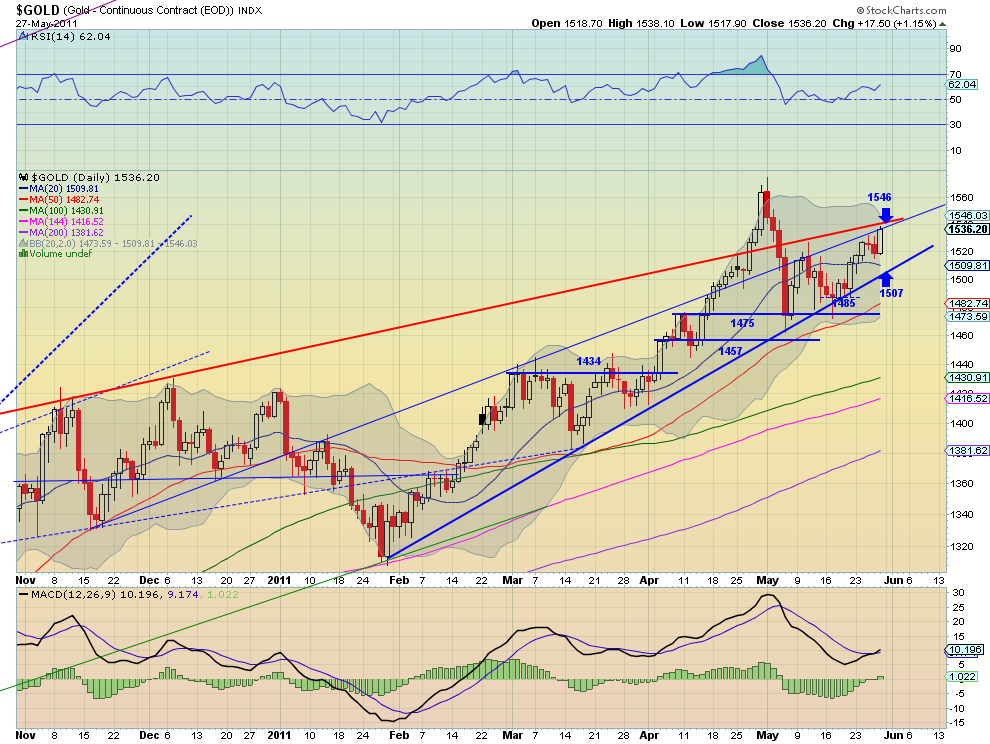
Gold Weekly,$GC_F
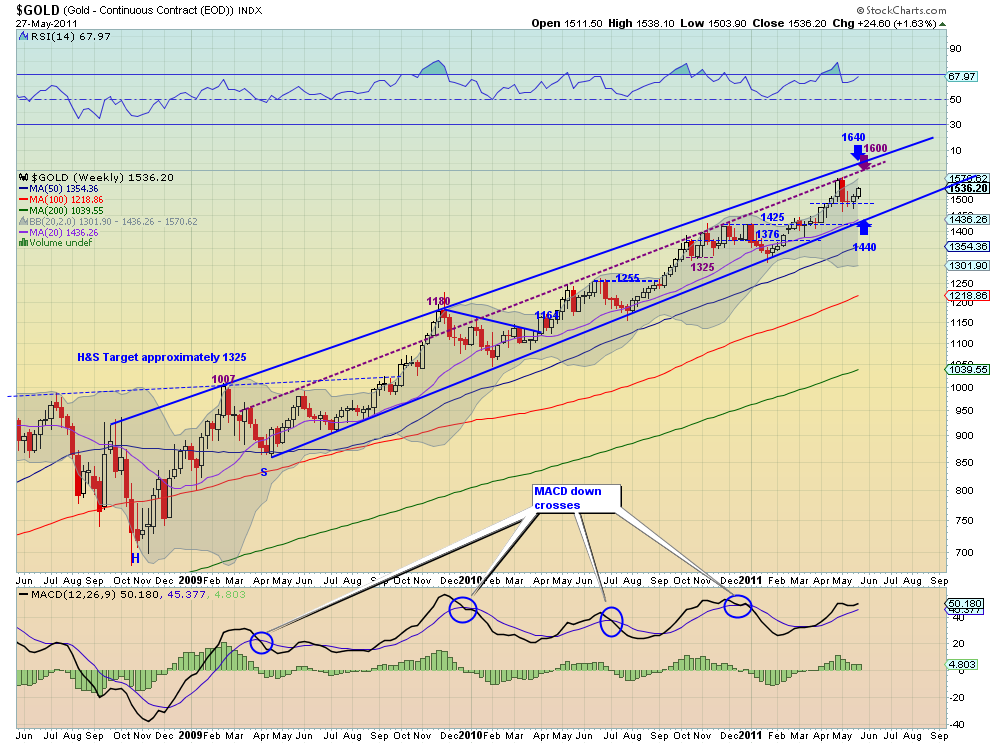
Gold had a good week continuing higher from last week. It ended the week at a short term resistance area as shown on the daily chart but with good support for more upside from a rising Relative Strength Index (RSI) and a Moving Average Convergence Divergence (MACD) indicator that has crossed higher. Above that resistance the previous is the last hurdle. The weekly chart shows that there is resistance of the rising trend lines of the channel much higher at 1600 and 1640. The weekly RSI has just turned back higher and the MACD has stopped declining. Look for more upside to Gold next week with any pullback limited to support at 1500 and 1485.
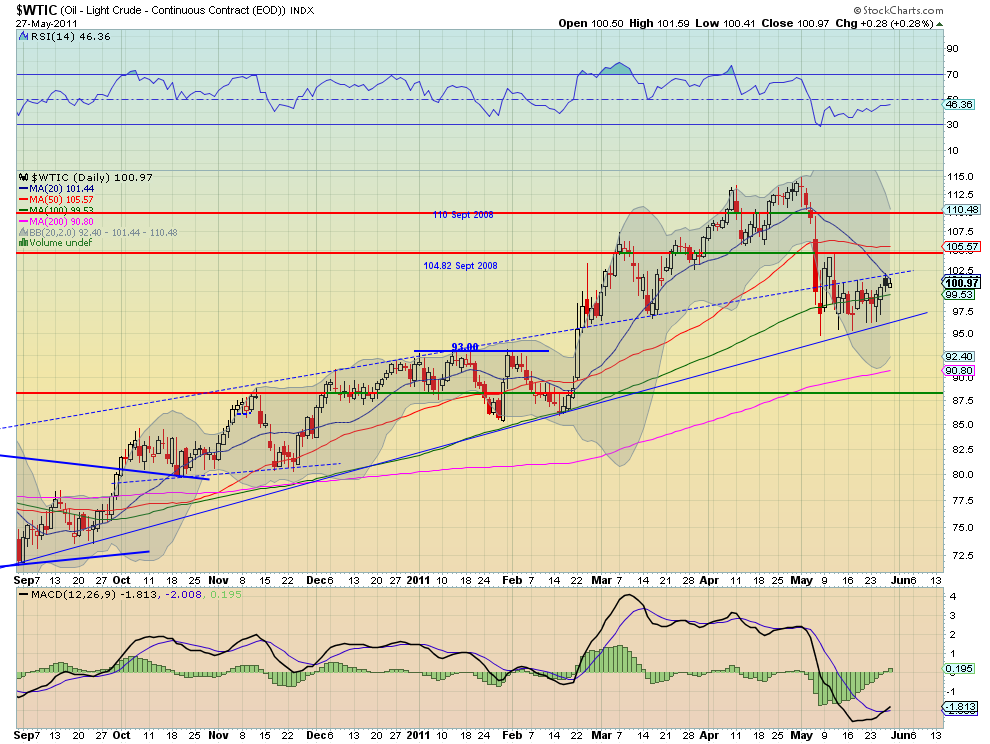
West Texas Intermediate Crude Weekly,$CL_F
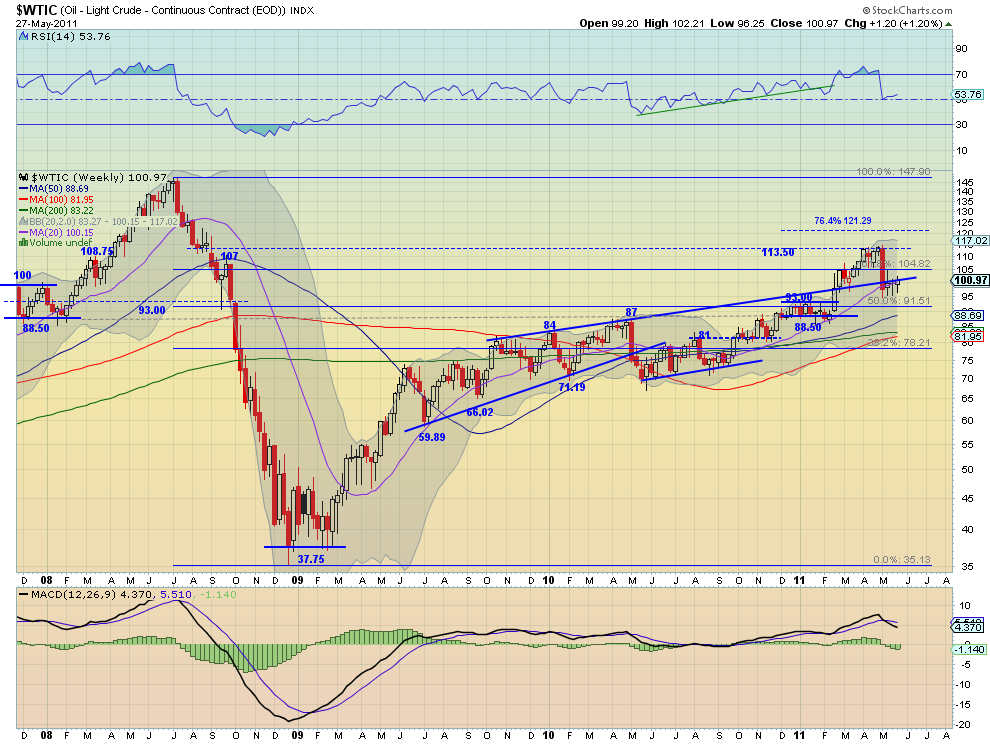
Crude Oil is attempting to break out of the bear flag on the daily chart higher but meeting resistance of the 20 day Simple Moving Average (SMA) and the rising resistance line. Above that trendline the long term support/resistance lines will play a role of resistance. The RSI on the daily chart is now trending higher and the MACD has just crossed up, both positive in the near term. The weekly chart has a RSI that has just bounced off of the mid line and is heading back higher. The MACD still looks lower though. Look for Crude Oil to continue to drift higher next week within a channel loosely bound by the rising trendline and the 104.82 Fibonacci level to the upside and the rising support lie and the 100 day/20 week SMA below.
US Dollar Index Weekly,$DX_F

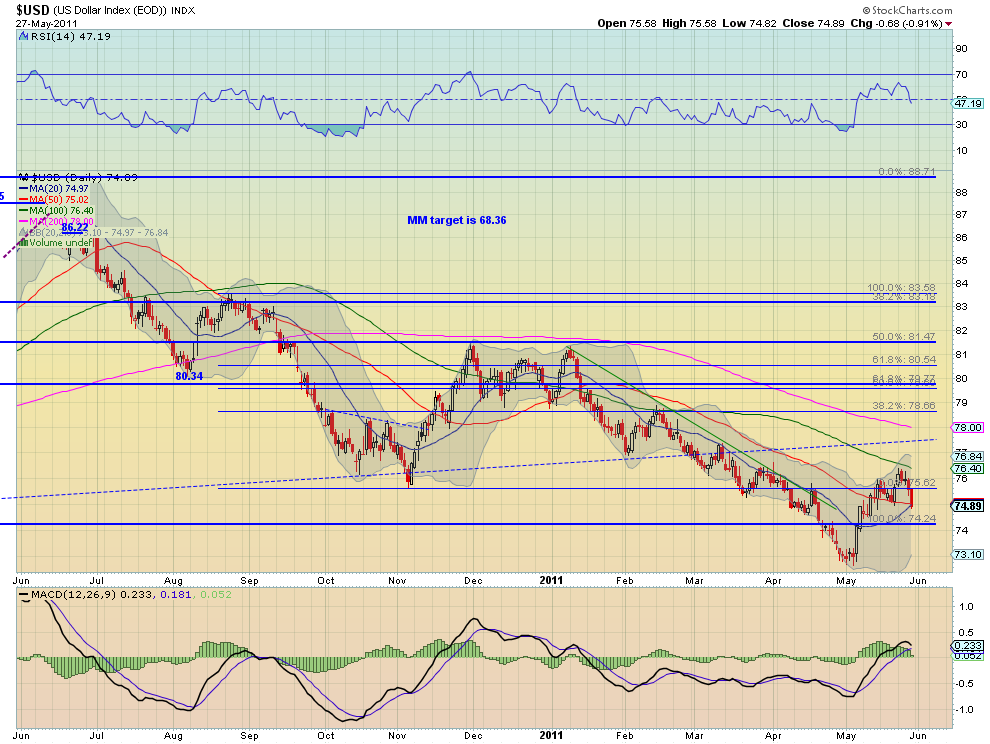
The US Dollar Index fell for the week and looks to be headed lower. The daily chart has a RSI that is steeply sloping lower and a MACD that is about to cross negative. The price has fallen through 20 and 50 day SMA and made a lower low. The weekly chart also has a falling RSI but with a MACD that is flat. Finally with 7 of the eight SMA between the two charts sloping lower the downside is favored again. There are only 5 support levels all from the weekly chart between the Index and new all time lows (74.80, 74.10, 73,72, and 71.50) and a Measured Move (MM) would put a first target at 68.
iShares Barclays 20+ Yr Treasury Bond Fund Weekly,$TLT
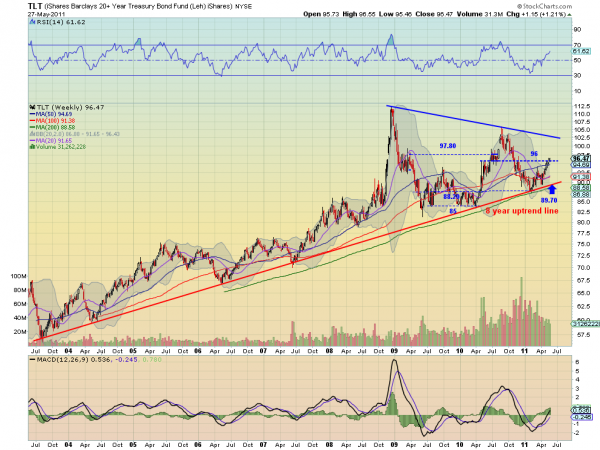
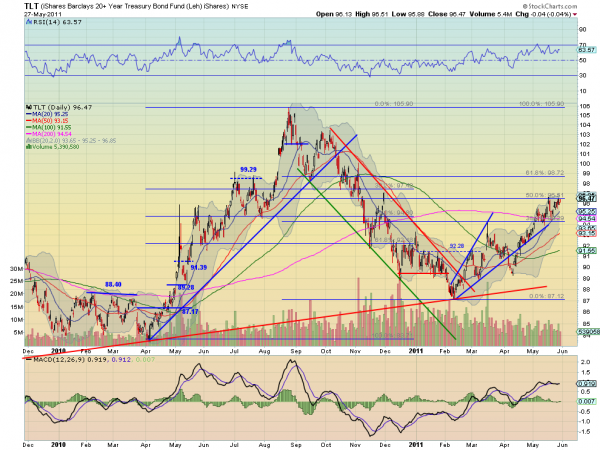
US Treasuries, measured by the TLT ETF, moved higher for the week and are testing the high from earlier in the month near a 50% retracement of the 2010 down move. The RSI on the daily chart is holding in bullish territory and the MACD is flat. On the weekly chart you can see that it is in a symmetrical triangle with the center line near that 96.51 50% retracement level. Both the RSI and MACD are supporting a bullish move higher. Look for TLT to continue higher next week with several minor resistance levels from the over lapping Fibonacci’s slowing it as it works toward the top of the triangle near 102.50.

Shanghai Stock Exchange Composite Weekly,$SSEC

The Shanghai Composite continued lower with a MM on the daily chart of 2630 now within its sites. The RSI and MACD on the daily chart suggest more downside, and those indicators on the weekly chart concur. Stepping back to the weekly chart shows a fall out of the long symmetrical triangle with a long bearish Marubozu candle. Look for more downside next week with the previous channel between 2590 and 2695 giving support and then 2357 below that. The target for the pattern break would roughly be the previous low around 1700.
iShares MSCI Emerging Markets Index Weekly,$EEM
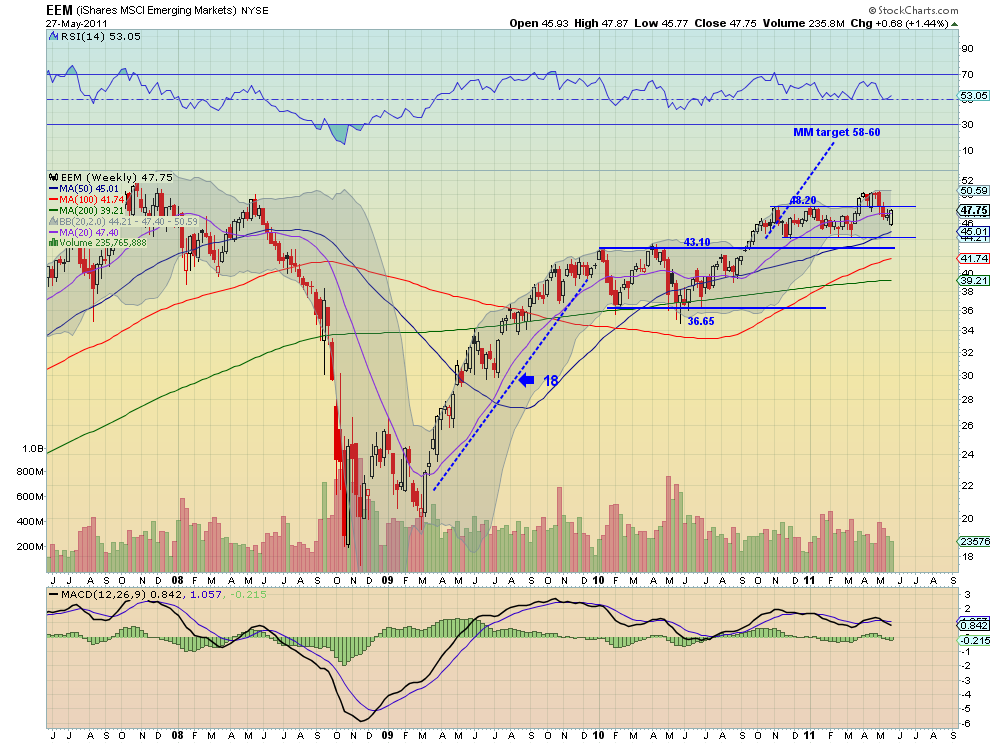
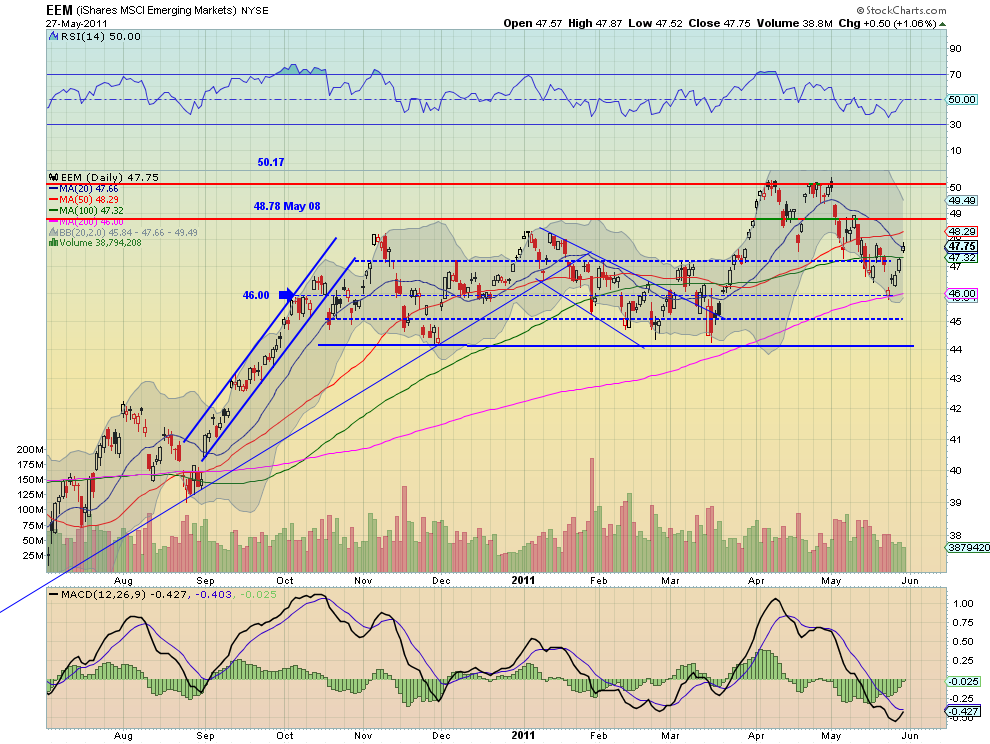
Emerging Markets, as measured by the EEM ETF, had a series of gap up days for the week leading to a bullish engulfing candle on the weekly chart. The RSI on both charts points higher and the MACD on the daily chart is making a bullish cross up. Look for more upside for the EEM next week with resistance nearby at 48.20 then 48.78 and then the previous highs just over 50.
VIX Weekly,$VIX
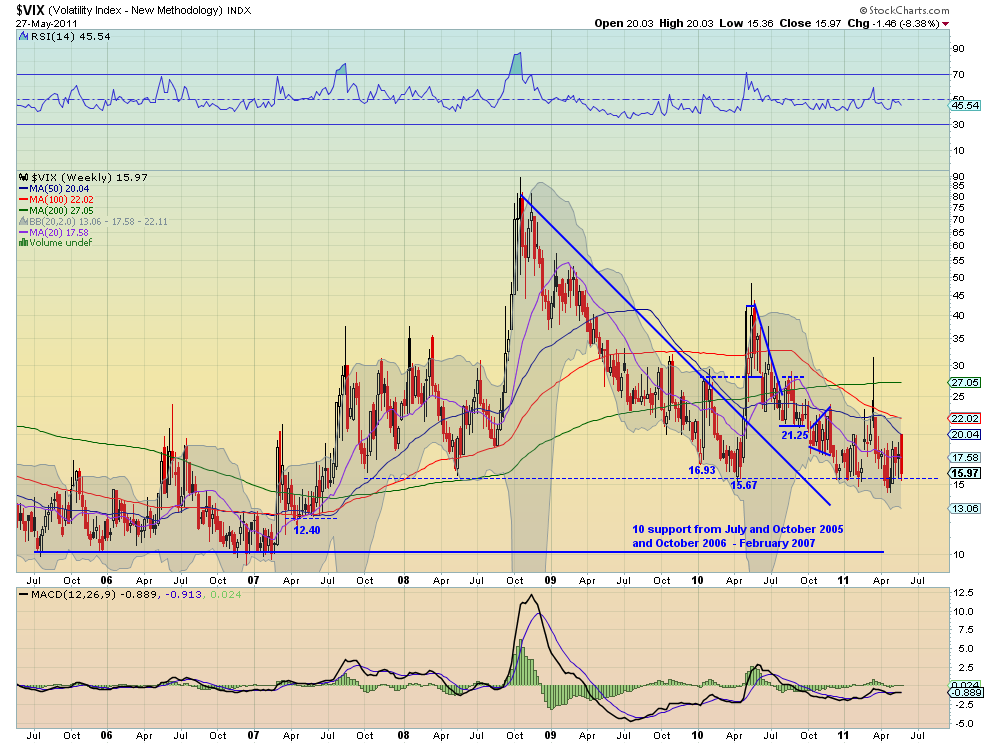
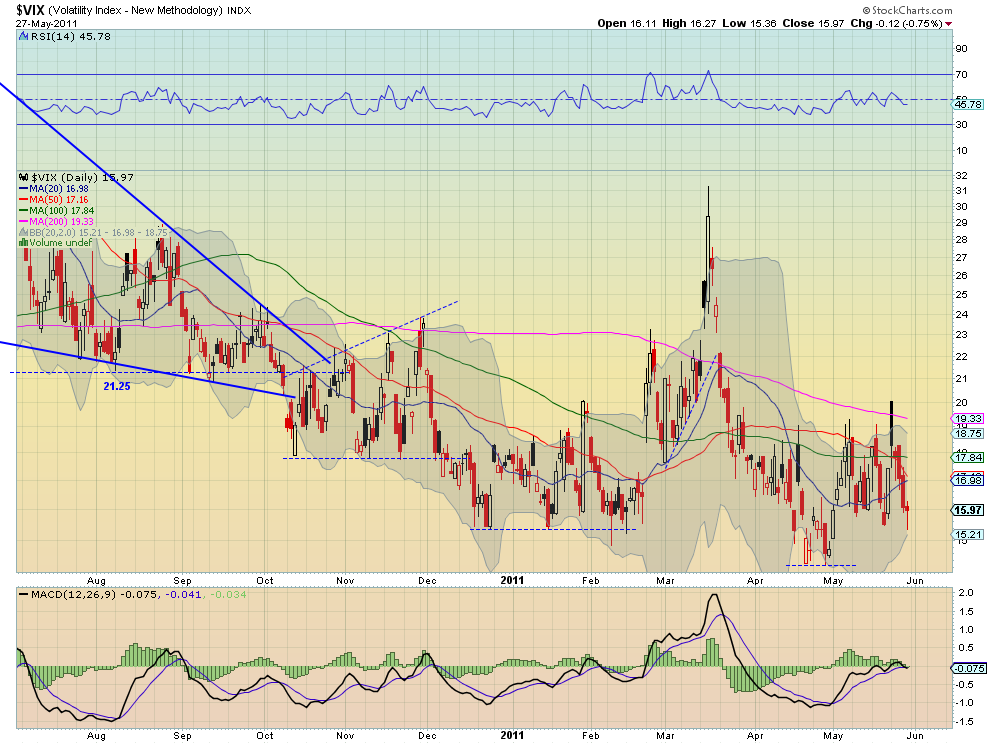
The Volatility Index expanded its range again slightly this week but remained low. Both the daily and weekly charts show that the RSI and MACD are giving no clues about the future direction. But the SMA’s continue to meander sideways to slightly down suggesting more of the same to come. Look for the upside to be limited by the 21.25 area and the downside by 15.50 in the coming week.
SPY Weekly,$SPY
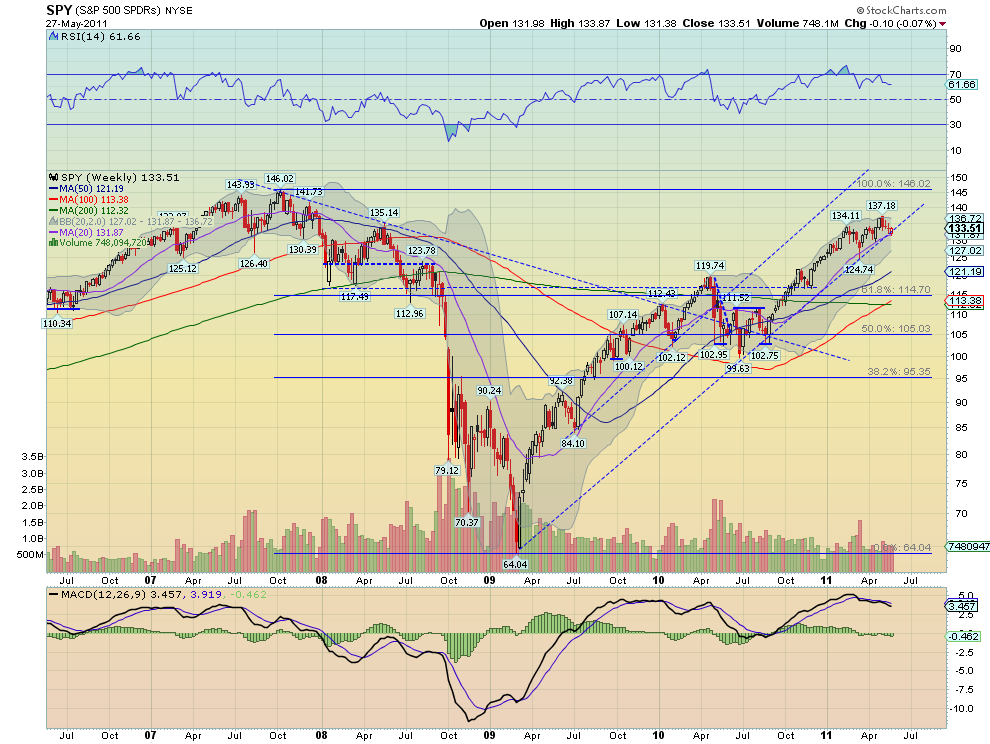
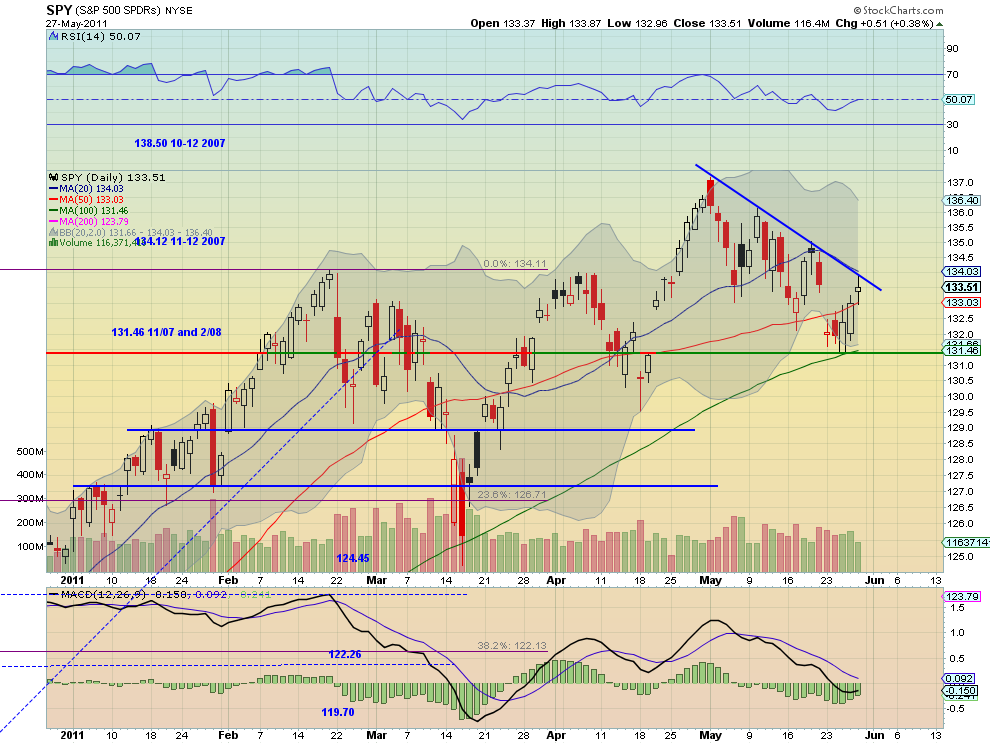
The SPY gapped down on Monday finding support at the intersection of the 100 day SMA and the long term support/resistance level at 131.46 before rising to close the gap Friday, ending almost unchanged for the week. The daily charts shows that the downtrend line still holds, but the MACD is improving as the RSI flattens at the mid line. The weekly chart shows the bounce off of the rising trend line from the March 2009 lows. The Bollinger bands are getting tight on the weekly chart. SPY need to break the downtrend and put in a higher high above 135.11 to break the short term downtrend. The indicators on the weekly chart (RSI and MACD) both suggest that this may be tough to do. If it rejects below the trendline on the daily chart and the rising trend line on the weekly chart look for a fresh wave of selling and a continued push lower with support first at 131.46 and then 130. My bias for next week remains to the downside until 135.11 is broken.
IWM Weekly,$IWM
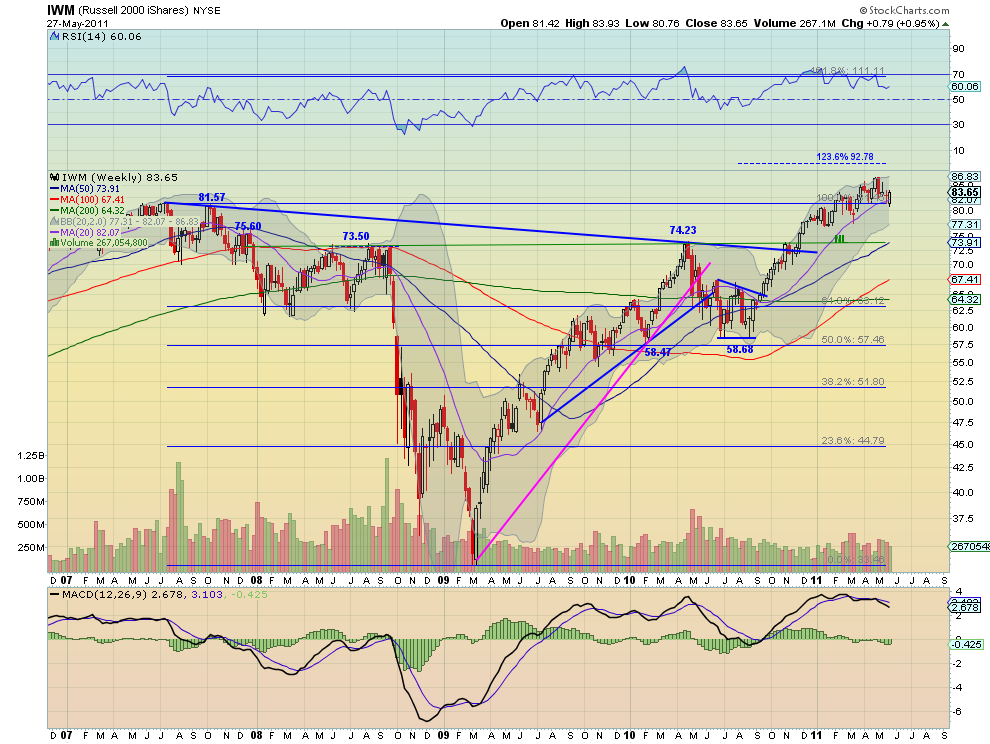
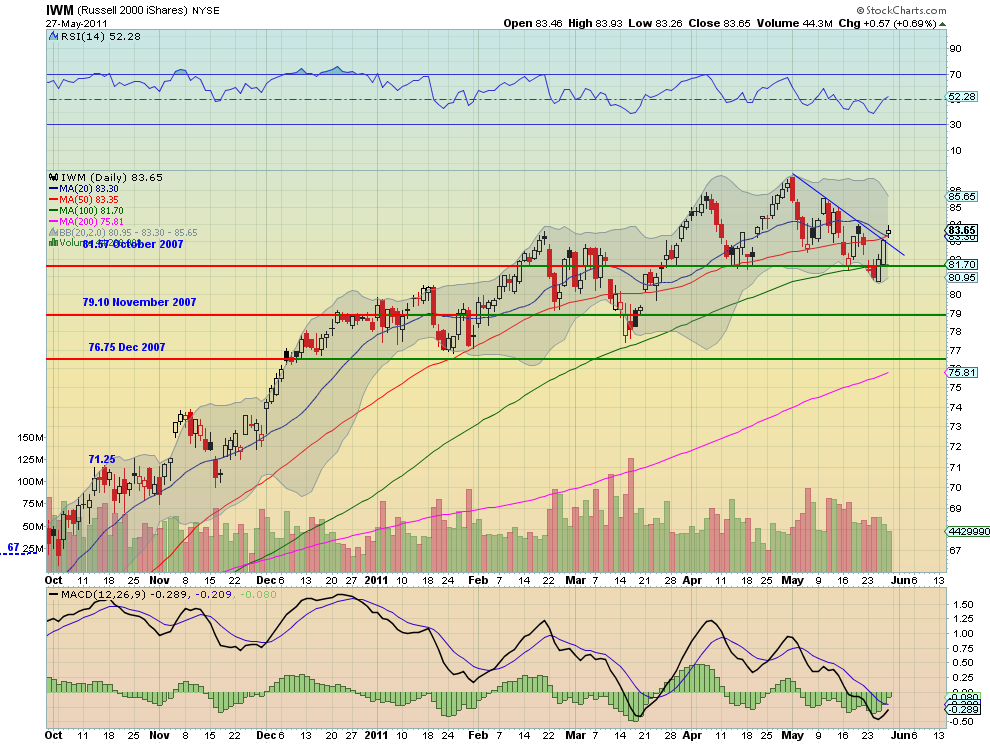
The IWM broke above the falling trend line and both the 20 and 50 day SMA on the daily chart after starting the week with a gap down. It finished the week nearly making a higher high, but not quite. The RSI and the MACD on the daily chart suggest that there is more upside to come. The weekly chart is not so conclusive. It printed a bullish engulfing candle that rose off of the long term support/resistance level at 81.57. The RSI on the weekly chart is meandering, but at bullish levels, band the MACD is improving. My bias is to the upside for next week for IWM but I will feel more comfortable with it going further if it gets above 85. A fall below 80.75 will change my view to bearish with support at 79.10 first.
QQQ Weekly,$QQQ
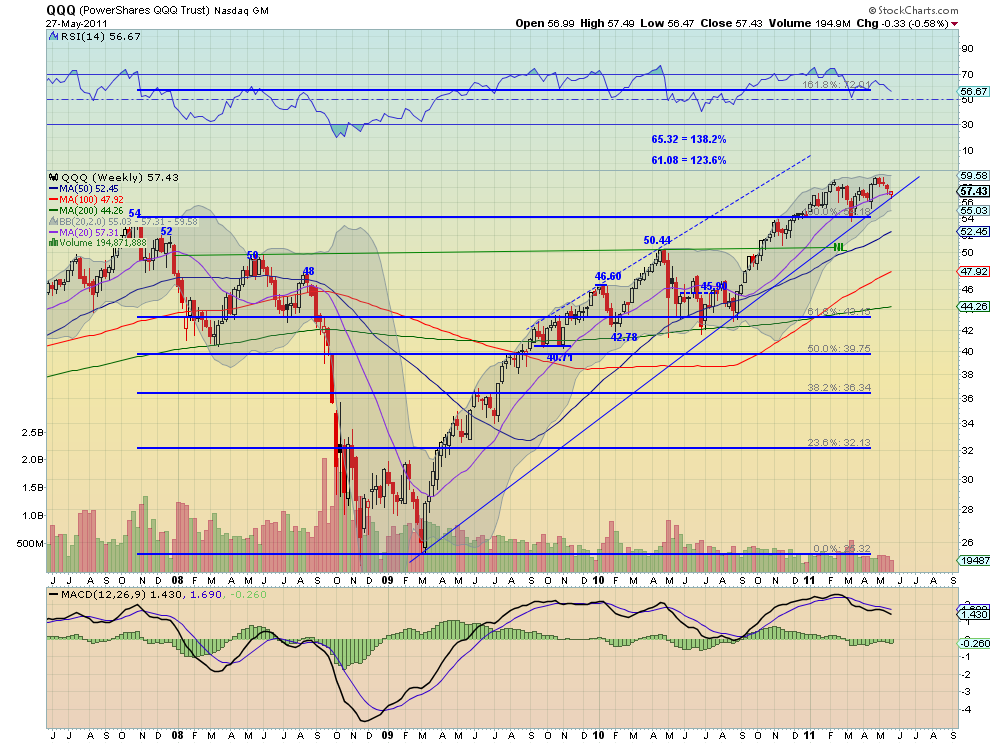
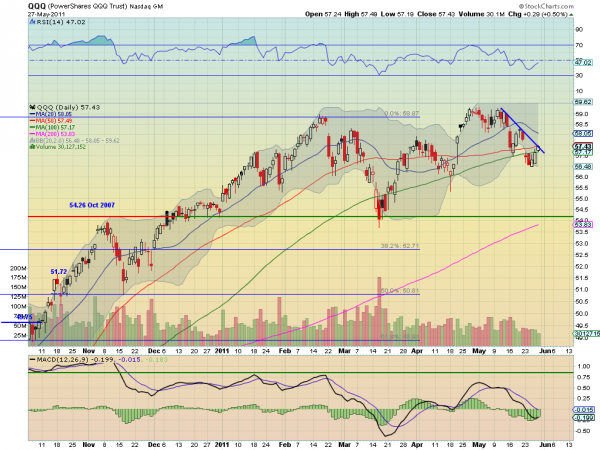
The QQQ also gapped down on Monday finding support near 56.50, just under the 100 day SMA, before rising Friday to the 50 day SMA, but leaving the gap open. The daily charts shows that the downtrend line still holds, but the MACD is improving as the RSI rises to the mid line. The weekly chart shows the bounce off of the rising trend line from the March 2009 lows. The Bollinger bands are getting tight on the weekly chart. QQQ needs to break the downtrend and put in a higher high above 58.34 to break the short term downtrend. The indicators on the weekly chart (RSI and MACD) both suggest that this may be tough to do. If it rejects below the trendline on the daily chart and the rising trend line on the weekly chart look for a fresh wave of selling and a continued push lower with support first at 56 and then 54.26. My bias for next week remains to the downside until 58.34 is broken.
So next week looks for more upside for Gold and a drift higher for Crude Oil. The US Dollar Index looks headed to test the recent lows while US Treasuries continue higher. The Shanghai Composite looks to continue lower after falling out of the symmetrical triangle while Emerging Markets head higher toward resistance. With continued stable and low Volatility the Equity Index ETF’s are diverging, with the IWM looking better to the upside while the SPY and QQQ need to break resistance to join it and so are looking better to the downside. This divergence should resolve soon but could also lead to more sideways action. Use this information to understand the major trend and how it may be influenced as you prepare for the coming week ahead. Trade’m well.
No comments:
Post a Comment