Saturday, June 15, 2013

For Stocks, "Headwinds Are Clear And Seem To Be Strengthening"

by Tyler Durden

If stock markets really do their best to discount earnings six months ahead of time, then it’s beginning to look a lot like Christmas. ConvergEx's Nick Colas' monthly review of analysts’ revenue expectation for the Dow 30 companies finds that hopes for growth in the second half of 2013 continues to diminish. The upcoming Q2 2013 results won’t be much to write home about either, with average top line growth versus last year of just 1.1% and (0.7% ex-financials), the lowest comps analysts have put in their models since they started posting expectations last year.

Back half expected sales growth is down to an average of 3.0 – 3.2%, where these estimates were over 5% just three months ago. If you are hoping for 3-4% revenue growth – the kind that allows profit margins to expand – you’ll have to wait until 2014, at least according to Wall Street analysts.

Via ConvergEx's Nick Colas,

Stock market wisdom says that equity prices discount the economic conditions and profit outlook for public companies 6 months in the future. If investors think corporate profits will peak in two quarters, for example, stocks should decline today. And if the Street’s outlook for earnings in the two-quarter near future become more optimistic, then they should rally. As with any investment guideline – whether it rhymes or not – its actual track record is spotty. Consider the last few major turns in U.S. stocks:

  • The now-famous March 2009 intraday low of 666 occurred well after corporate earnings had turned higher. Quarterly earnings for the S&P 500 actually bottomed in Q4 2008 at essentially zero and were already on their way to $10/share for Q1 2009.
  • Less tumultuous periods in market history follow the 6-month rule more closely. The March 2000 highs for stocks did a good job of forecasting the fact that Q2 2000 was the peak for quarterly S&P 500 earnings at $14.88. Two quarters later and earnings were running $13, and then $10.73/quarter for Q1 2001. Going back to the turn higher in the early 1990s, market lows around the August 1990 Iraqi invasion of Kuwait accurately reflected that earnings would trough early 1991 (at an average of $4.78/quarter) and head higher after that.
  • As of today, S&P is printing expectations for uninterrupted earnings growth over the balance of 2013 and into 2014. The numbers are pretty impressive - $110 for S&P earnings this year, and $123/share for next year. That put stocks at 14.8x earnings for this year, and 13.2x for next year. If you want to jam the bull case for stocks into the smallest possible container, this is it. Stocks valuations are reasonable – if not cheap – by historical standards.

So then what’s up with all the market volatility of late? I lost my “VIX below 18.5” bet with our option desk yesterday, but I don’t really know who to blame (aside from the guy in the mirror). Should I send Ben Bernanke a “WTF?” tweet over the market chatter about the Fed ‘Tapering’ the QE bond buying program? I heard that the Bank of Japan was running out of arrows to fight 20 years of deflation economic stagnation, but Amazon has them listed at 3/$11, shipping included if you are a Prime customer. So that can’t be it… And I have no idea who to blame in Europe. Maybe everybody.

No – if we follow the logic about “Six months ahead” then the market is clearly wondering about how the world will look on December 13. Hanukkah comes early this year – November 27 kicks off the Festival of Lights – so that can’t be it. Allowing for a 2 week fudge factor, you get Christmas. Well, technically you’d be in the heart of Kwanzaa – which goes from December 26 to January 1st - or Boxing Day in the UK. But we’ll go with Christmas out of expediency.

One of the best ways to get a read on Wall Street earnings expectations is to start at the top of the income statement, with trends in revenue forecasts. We do this every month for the 30 companies of the Dow Jones Industrial Average, and the results of that analysis in several tables and charts immediately following this note. The data comes directly from the consensus expectations for quarterly and annual revenue growth between the upcoming Q2 2013 and the end of 2014.

The upshot of the analysis is that analysts are growing more concerned about revenue growth for the remainder of 2013. A few points here:

  • Just two months ago, back in April, analysts were forecasting 3.5% sales growth for the Dow companies. Now that number is down to 1.1% year on year growth. Exclude the financials, and the expected Q2 revenue growth rate drops to 0.7%. Now, keep in mind that revenue growth was essentially unchanged in Q1 2013. It looks very much like Q2 hasn’t accelerated from that pace.
  • Analysts are clearly also concerned about the pace of revenue growth for the back half of 2013. Back in April they were showing clients financial models which anticipated 5% sales growth for Q3, and 4.5% for Q4. Those numbers are now 3.2% and 3.0%, respectively. Excluding the financial companies of the Dow, revenue growth is now expected to be 3.3% in Q3 2013 and 2.8% in Q4 2013.
  • If you want to see the type of revenue growth that more typically generates earnings growth, you’ll have to wait until 2014, at least according to the Wall Street analysts who cover the Dow companies we’re talking about here. Only then will you see the average 4% type of revenue expansion which drives meaningful upside earnings surprises.

Analysts are clearly worried about the trends for revenues and – eventually – profits as we move through the year. Yes, corporations have does great work at generating record profits on the back of far-less-than record economic data. But for all the chatter about a second half expansion of economic activity, analysts clearly are not hearing that kind of macro optimism from either their companies or their own field checks and due diligence. Next year still looks good, but that is a long way off.

The bottom line is that this data provides a less-discussed reason for all the recent stock market volatility. It is actually a pretty straightforward story – as expectations catch up with a still-soft economic reality, are all those lofty earnings expectations really defensible. We’ll have to wait and hear what companies have to say in a few weeks, of course. But the headwinds are clear, and they seem to be strengthening.

See the original article >>

The Plight Of Europe's Banking Sector, Its €650 Billion State Guarantee, And The "Urgent Need" To Recapitalize

by Tyler Durden

A month ago we quantified that just the overt European bank undercapitalization (excluding spillover effects from counterparty liability and derivative exposure) resulting from non-performing loans, is a staggering €500 billion. These NPLs "reduce the capacity of banks to lend, hindering the monetary policy transmission mechanism. Bad debts consume capital and make banks more risk averse, especially with respect to lending to higher risk borrowers such as SMEs. With Italy (NPLs 13.4%) now following the same dismal trajectory of Spain's bad debts, the situation is rapidly escalating (at an average of around 2.5% increase per year)." The implied conclusion is that Europe has kicked the can far longer than it should, and as a result its banks have become zombie shell with unprecedented accrued losses, supported explicitly by their various governments, and thus, by the ECB, which is now in the business of preventing sovereign failure (despite its repeated promises otherwise).

And since the topic of quantifying how big the sovereign assistance to assorted banks - both in Europe and the US (which Bloomberg calculated at $83 billion per year) - has become a daily talking point, we are happy to read that Harald Benink and Harry Huizinga have reached the same conclusion as us in their VOX analysis, and further have shown that in Europe the implicit banking sector guarantee by the state is a whopping €650 billion.

Until now, Europe’s banking sector has been kept afloat by implicit state guarantees of virtually all liabilities. Michiel Bijlsma and Remco Mocking (2013) of the CPB Netherlands Bureau for Economic Policy Analysis find that in 2012 these guarantees provided banks in Europe with an annual average funding advantage amounting to 0.3% of total assets. They base this estimate on a comparison of banks’ diverging credit ratings in scenarios with and without government bailout support. An annual funding advantage of 0.3% of assets can be capitalised to be equivalent to 2% of total assets, on the assumption of a discount rate of 15% commensurate with banks’ uncertain earnings prospects. Given total banking assets of €33 trillion in the Eurozone, we are talking about an implicit guarantee of about €650 billion.

Benink and Huizinga go so far as making the call for an urgent recapitalization of Europe's ban:

Europe has postponed the recapitalisation of its banking sector for far too long. And, without such a recapitalisation, the danger is that economic stagnation will continue for a long period, thereby putting Europe on a course towards Japanese-style inertia and the proliferation of zombie banks.

So while the recent advent of the Japanese Carry Trade has been a useful distraction to the insolvency of Europe's banking sector, the underlying reality, as confirmed by the build up of massive unrecognized losses, is only getting worse, and the market is well aware of this:

Banks are already saddled with ample unrecognised losses on their assets, estimated by many observers to be at least several hundreds of billions of euros and mirrored by low share price valuations, and an additional loss of their present funding advantage will be crippling.

...

On average, the market-to-book value of European banks now is about 0.50 (see Figure 1). This indicates that accountants’ estimates of bank capital are far too rosy, and that banks have substantial hidden losses on their books. In a recent speech Klaas Knot (2013), Dutch central bank president and European Central Bank governing council member, noted that restoration of banks’ balance sheets is a crucial requirement for economic recovery. To facilitate this process, Mr Knot states, it is essential to create transparency about losses in the banking sector and to have an orderly resolution of lossmaking assets. Without this, banks will remain restrictive in making new loans. Mr Knot adds that the planned European banking union offers an appropriate opportunity for speeding up the resolution process.


Furthermore, since European banks are unable to grow into their balance sheets using profits (for the simple reason that stripping away accounting gimmicks the vast majority of European banks are hardly profitable, if outright unprofitable), it will mean that the Cyprus bank resolution scheme will soon be coming to a seemingly healthy European bank near you.

The plight of Europe’s banks worsened considerably when Jeroen Dijsselbloem (2013), Dutch finance minister and Eurogroup president, stated that the approach taken in Cyprus of resolving failed institutions without using taxpayer money would in future preferably apply throughout the Eurozone. Consistent with this, Wolfgang Schäuble (2013), German finance minister, recently stated his desire ‘to ensure that enrolling taxpayers to rescue banks becomes the exception rather than the rule’, and that to achieve this ‘we need credible EU bail-in rules as soon as possible’.

Financial markets understood Mr Dijsselbloem’s message, as shown by a subsequent decline in the share prices of many institutions. Very low bank valuations imply that they will find it very difficult to recapitalise themselves by issuing equity or debt that is convertible into shares – in part because share issuance would further dilute the value of implicit state guarantees. Low share prices, in effect, imply that banks can raise only limited capital by issuing new shares, and that they may need to accept reduced issuance prices. Very few large European banks are raising capital by issuing new shares, no doubt as they realise that this is not in the interest of current shareholders. As exceptions, Deutsche Bank raised almost €3bn in April, while Commerzbank announced plans to raise €2.5bn through a heavily discounted rights issue in May.

The VOX authors' conclusion - the time to stop kicking the can has arrived:

Time to recognise losses

It is now urgent to start recognising losses on balance sheets to avoid a proliferation of Japanese-style zombie banks in Europe. To facilitate this, we advocate conducting a new and thorough stress test soon, similar to the one administered by US supervisory authorities in 2009. Of course, the financial position of most governments in Europe is much worse than that of the US in 2009. So Europe needs to take a path towards recapitalisation that in some respects differs from the earlier US approach.

  • First, a credible stress test should assess the losses hidden on the balance sheet for each bank, as well as the likely cost of the removal of implicit guarantees of all liabilities.

This will result in an estimated capital shortage, taking into account capital levels as required by international bank supervisors. Recently, the Financial Services Authority (2013) conducted a stress test of UK banks, resulting in a necessary downward adjustment of reported regulatory capital of about £50 billion, and a resulting regulatory capital shortfall of £25 billion. The estimated capital shortfall of £25 billion is likely to be a low estimate, as it is by and large predicated on the continuation of implicit state guarantees in the UK. At any rate, thorough stress tests in other European countries are likely to reveal sizeable capital shortfalls as well.

  • Second, supervisors need to assess whether the capital shortfall can be financed by international capital markets and/or national governments.

In case the required amounts are too high, the bank immediately must be entered into a resolution and restructuring process imposing some losses on unsecured creditors (the Cyprus model).

The legal basis for this resolution and restructuring would be an intervention law, which some European countries may need to enact through emergency legislation. Most banks in Europe, in contrast with their Cyprus counterparts, have significant financing by bond holders and can be recapitalised by imposing losses on holders of subordinated and common debt without infringing on savings deposits.

  • Third, in the event that capital shortfalls are relatively small, supervisors could instead implement the US model.

This would mean that banks are given a limited period of time to issue equity on international capital markets, after which national governments step in to provide the remainder of the equity shortfall.

What is coming next is the New Normal's new favorite phrase: share sacrifice. Supposedly by unsecured creditors at first:

The way in which Europe recapitalises its problem banks now has a direct impact on the design of the future European banking union. If many banks are recapitalised by imposing losses on unsecured creditors, such as holders of subordinated and common debt, this is likely to be reflected in the design of the single resolution mechanism that will determine the extent to which bail-ins are mainstreamed in future bank resolutions in the EU.

Although coupled with the recent push to sequester large bank deposits, in part or in whole, and amounting to as much as $32 trillion globally under the guise of punishing tax evasion, one can be certain that secured debt holders, not to mention bank deposits, will also be impaired. It also means that when the most recent coming of the Japanese carry trade finally unwinds, and judging by the recent plunge in the Nikkei and surge in the JPY, its days may be numbered, look for the knock off effects in the European financial and sovereign bond market to usher in what may be the perfect storm of both Japan and Europe suddenly going from stable to highly combustible at the same time. Which will once again leave Ben Bernanke as the only central bank with any gunpowder left to preserve and restore stability in the "developed" world.

See the original article >>

Importance of Exports to China

by Marc to Market

China is the world's largest exporter. It is also among the largest importers. This Great Graphic was posted on Business Insider, who took it from Societe Generale's new quarterly economic outlook.

Exports to China account for more than 1/5 of Taiwan's exports and about 1/8 of South Korea and Malaysia's exports. They seem to be exporting mostly semi-finished goods and parts for Chinese workers to assemble. This how China has injected itself into the global supply chains.

Australia is next. China accounts for a little more than 5% of Australia's exports. This is primarily raw materials, especially iron ore, from which China will produce steel. Further to the left on the chart is Russia and Brazil. They are also raw material producers. Russia with energy and Brazil, with soy and iron ore.

Japan's exports to China appear to fall into two main categories: semi-finished goods that are to be assembled, but also finished producer and consumer goods for sale. Germany, which is the world's second largest exporter and Europe's largest exporter to China, is shipping capital goods.

China's exports are still very import-intensive. The key to China's imports then is not just its own growth, which the current five-year plan anticipates and desires slower growth, but also world growth. Growth in the US is projected to be slower than 2012 and Europe is still contracting. Japan's growth the fastest in the G7, is fragile. China's "peaceful rise" was predicated on strong world growth and expanding world trade.

The yuan has been the strongest of the emerging market currencies this year, gaining about 1.5% against the US dollar. Officials have begun cracking down on capital flows disguised as trade flows. Continued appreciation of the yuan seems questionable. In a recent post, The Economist argues that the yuan is over-valued and suggests that perhaps, this over-valuation is a pre-condition to China opening up its capital account, which Prime Minister Li Keqiang, promised before the end of the year.

See the original article >>

A Long-Term Look at the Nikkei

By Carl Swenlin

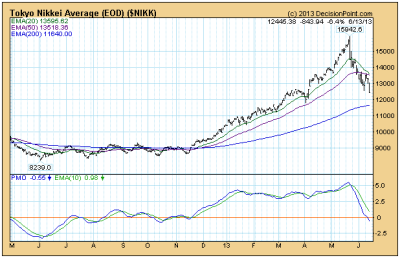
The Tokyo Nikkei Average has been in another free-fall since the top in May, falling -22%. Before we get to the long-term chart, let’s look at the one-year daily bar chart.

The average rose +82% in just six months in a parabolic move that was doomed from the start. They almost always are. When a parabolic move breaks, as it did in May, the speed of the decline can be catastrophic. The downside expectation is for prices to return to the level of the basing pattern that preceded it. In this case between 8300 to 9100. That is not a prediction, just the level we at which we might expect to start looking for a tradable bottom.

dp1

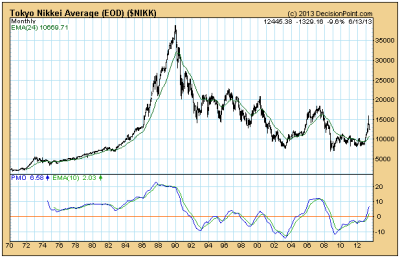
As dramatic as the the above chart is, it is hard to beat the long-term chart below for drama, when we look at the parabolic rise from 1970 to the all-time high in 1989. Over the last decade prices seem to have found a base at around 7000, instead of 5000, where the pre-parabolic base was. For this we can thank the super-human efforts of the government to avoid the inevitable by printing money. After over 20 years of avoidance, their economy has still not recovered, and recovery is nowhere in sight.

dp2

Conclusion: Long-term charts put things into perspective, and the recent, exciting six-month rally is shown to be a mere blip in a long, grinding trading range. Also, the possible downside is at least 7000, or maybe 5000.

See the original article >>

Currency Positioning and Technical Outlook: Downside Risk for the Dollar?

by Marc To Market

The US dollar lost ground against all the major currencies over the past week. The yen (3.5%) and New Zealand dollar (2.0%) led the pack against the greenback. Canada, Australia and Norway were the laggards, the worst was flat and the best--up almost a percent.

We had anticipated a better showing for the US dollar. Yet, indicators suggest we were early and that the near-term risk is still to the dollar's downside.

Of course, the key is how the market responds to the FOMC statement. We have consistently argued that the Fed is unlikely to taper as early many participants and observers have suggested: Not in June, the summer or September. Our base line view was for a tapering late this year, but see a strong case to be made for allowing the next Federal Reserve chairperson have the distinction; partly on economic grounds, and partly drawing insight from game theory. We recognize the desire to enhance the Fed's anti-inflation credentials after a prolonged period of unorthodox and extensive easing of policy.

Both the Fed's "tapering" and ECB's "open mindedness" regarding a negative deposit rate were types of forward guidance, but now the rubber must meet the road, so to speak. Neither is inclined to follow through with what we have argued was a successful feint. In any event, we expect that the Fed's $85 bln a month in long-term asset purchases will continue unabated. And the ECB is likely to find in the flash PMIs more reason not to give up on their expectations for a gradual recovery going forward.

As the euro rose against dollar over the last few weeks, the premium the US offers on 2-year money has been more than halved. In recent days this has begun recovering and is consistent with a softer euro. However, the price action itself remains constructive and the euro finished the week just above the retracement objective near $1.3340. The RSI and MACDs are getting stretched, but have yet to turn.

In addition, the lows from March and May in the $1.2750-$1.2800 area may be a double bottom. The neckline is near $1.3200. The minimum objective of the patter is $1.3650-$1.3700, which is near the year's highs. A move back below the $1.3200 area would negate the double bottom. Initial support is pegged in the $1.3260-80 band.

Arguably, the most striking thing about the yen's 8.1% rise against the dollar over the past month has been the incredible volatility. One-week implied vol reached 25% last week and the 3-month poked through 16% briefly. Both are two-year highs.

As with the euro, so too with the yen--we are seeing greater dollar weakness than we had anticipated. The charts do not suggest a turn is necessarily imminent, but rather that we are in the latter stages of the move. We had thought the JPY95 area, which has been our quarter-end forecast, would offer better support. The week's lows near JPY93.80 are set to be challenged at the start of the new week. Some some optionality and stops are thought to be near JPY93.50. A break could spur a move toward JPY91.50.

A move now back above the JPY96.20 would suggest a low is in place. Perhaps, the performance of the Nikkei can be instructive. We might feel more comfortable with picking a bottom to the dollar against the yen if the Nikkei were to trade higher after giving up nearly 50% of the gains seen since mid-Nov 2012.

The broader dollar setback and favorable economic news from the UK has lifted sterling to 4-month highs. As with the euro, sterling's technical studies are getting stretched, but no sign of an imminent top. Provided the $1.56 area holds, sterling can move test the $1.5800 area.

The dollar has a much deeper retracement of its gains against the Swiss franc in recent weeks. While the euro recovered a little more than 60% and sterling a bit more than 50%, the dollar has shed 80% of this year's gains against the Swiss franc. Given the current dynamics, it seems risk to pick a dollar bottom against the Swiss franc until one thinks the dollar is about to recover against the Japanese yen. A move above CHF0.9300-30 would be technically constructive.

While the dollar does not look to have quite bottomed yet against the majors, it can probably be better bid against the dollar-bloc. Near the pre-weekend low, the US dollar has returned nearly 50% of this year's gains against the Canadian dollar. The disappointing merchandise sales figures saw the US dollar recover. The data offers important insight into the Canadian economy and that insight is not particularly encouraging: New orders fell by nearly 1% and inventories rose. The report points to a cooling of the industrial sector. Technically and on a risk-reward basis, the Canadian dollar looks interesting as a short leg of crosses or against the US dollar outright. The CAD1.0200-40 offers the first band of resistance.

in the second half of last week, the Australian and New Zealand dollars turned in better performances. This seemed to be more a question of short squeeze that has only marginally something to do with those countries per se and more to do with market positioning. That said, it is true that expectations for a July RBA rate cut have been scaled back.

There are a certain number of generally agreed upon facts. First, the short-term speculative community has established a large short Australian dollar position. Second, the Aussie has fallen a long way in a relatively short period of time. Third, sentiment remains bearish. Fourth, despite the depreciation, the central bank and private sector models still show the Aussie to be significantly over-valued.

Taken together, these mean that while the Australian dollar is susceptible to a short-squeeze, it probably is not carving out a significant low. It put in a 3 cent bounce from lows early last week to Friday's high. The pre-weekend price action warns that that might be it. A break of $0.9500-20 area could signal the resumption of the downtrend.

The dollar also looks constructive against the Mexican peso, even though it made fresh two-week lows before the weekend. It did recover and technical support just below MXN12.60 held. We expect range players to look a return toward MXN12.85-90.

Observations on the speculative positioning in the CME currency futures:

1. In the CFTC's reporting week, the gross short currency futures positions were cut across the board. Gross long position adjustment were more mixed; the euro, yen, sterling and Swiss franc longs expanded, while the Canadian and Australian dollars and Mexican peso were reduced.

2. There were four significant gross position adjustments (more than 10k contracts): Both the gross euro longs were added to (25.2k contracts) and shorts were covered (18.9k contracts); gross sterling shorts were cut (18k contracts) and long Mexican peso positions were liquidated (-22.8k contracts).

3. The net currency futures positions were reduced (by a large 44k contracts in the euro and 24k contracts in sterling) across the board. The Australian dollar was the lone exception. The net short position grew as gross longs were cut more than gross shorts.

4. The net short euro position is the smallest since late February when it switched from net long. The next short yen position is the smallest since early May. The net short sterling position is the smallest since March. The net Australian dollar position, which is now short 63.3k contracts, was long 85.5k contracts at the end of Q1. The net long peso position has been more than halved since early May.

See the original article >>

The Week Ahead: More Pain or More Gain?

by Tom Aspray

Stocks had another choppy week, as stocks tried to continue higher early on, but then turned lower Tuesday afternoon.

After Wednesday’s dismal performance, Thursday’s strong close stabilized the market, even despite Friday’s lower close. I was expecting the prior week’s lows to be broken, but they were not.

The yields on both short- and longer-term bonds declined a bit, which gave bondholders a bit of relief after what has been a tough six weeks.

chart
Click to Enlarge

Many bondholders are in shock, especially those in the high-yield or junk market. The chart of the SPDR Barclays Capital High Yield (JNK) shows that it hit a high of $41.95 on May 8, followed by a low on June 6 of $39.84. This was a drop of just over 7%, making its yield of 6.64% look much less attractive.

This is worse than the decline in the S&P 500 from the recent high at 1,687 to the intraday low of 1,598, which was just over a 5% decline. Many stock investors were apparently buying on the last decline, but are still wondering whether they should have waited to buy lower.

So what will the rest of the year bring for bond- and stockholders? More pain or more gain?

The completion of the weekly reverse H&S bottom formation for 30-year T-Bond yields, as discussed in my Eyes on Income column, does favor higher yields as the year progresses. Many investors are also hoping to get some clarification of Fed policy this week after the FOMC meeting, but I think the Fed will want to keep the market guessing.

chart
Click to Enlarge

Even TIPS (Treasury Inflation-Protected Securities) have been hit hard. Lower inflation numbers and fears that the Fed would stop their bond buying has caused significant outflows, as the chart indicates. The returns have also dropped into negative territory after giving double-digit returns in 2011.

The bond market is oversold, so a rebound is likely over the next few weeks. As I mentioned a couple of weeks ago in 4 Ways to Summer-Proof Your Portfolio, I would use any rebound to lighten up on the bond portion of your portfolio, and also shorten the maturity of your holdings. I think there will be more pain for bondholders later in the year.

So what about the stock market? The sharp drop in the Japanese market has gotten most of the attention from global equity investors, but as I noted last week, some of the key Japan ETFs have reached or are very close to good buying levels.

The rest of the global markets simply appear to be going through normal corrections. The German Dax did briefly break more important support in April before again making new highs. It has continued to lead the S&P 500 since the June 2012 lows, up 36% versus a 26% gain in the S&P.

chart
Click to Enlarge

There are no clear signs yet that the stock market correction is over. Therefore, further weakness is still likely. However, fact that the weekly NYSE Advance/Decline line did confirm the recent highs keeps the major trend positive, and further new highs in the major averages should be expected later this year.

The economic calendar was light last week, but retail sales were quite strong, while industrial production and the mid-month reading from the University of Michigan on consumer sentiment were a bit lower. All are still in positive trends, and as I discussed in A Technical Look at Fundamentals, I find it quite informative to look at fundamental data using technical analysis.

On the other hand, get ready for a full slate of economic data this week, starting Monday with the Empire State Manufacturing Survey and Housing Market Index. The latter helped confirm the bottom in the housing market a year ago, when many were still skeptical.

Then, on Tuesday the FOMC begins their meeting, and we also get the Consumer Price Index and housing starts. On Wednesday afternoon, the conclusion of the FOMC meeting comes out, as well as the press conference with Ben Bernanke, which does occasionally increase market volatility.

Of course, jobless claims are out Thursday, along with the PMI Flash Manufacturing Index, existing home sales, and the Philadelphia Fed Survey.

What to Watch
During last week, the stock market was able to please both the bulls and the bears. However, neither were all that happy by the week’s close.

Last week, I was expecting the rebound in the S&P 500 to “fail in the 1,650 to 1,660 area.” The S&P 500 peaked at 1648.62 on Monday, and then by mid-day Tuesday it was clear that the rally had failed.

For those who follow me on Twitter, long positions in the ProShares Ultrashort S&P 500 ETF (SDS) were established at $39.55. The first target is now in the $42.50 area, followed by $45.

With the rebound from Thursday’s lows, one has to consider that the correction may be near its end, though it is not currently indicated by the technical studies. If we see two consecutive days of solid price gains along with strong A/D numbers, it could shift the outlook.

Sentiment did not change much last week, and I still think we need to see a break of the 1,585 support on the S&P 500 to create enough negative sentiment for the market to bottom out. Individual investors became a bit more bullish last week, up to 33% from 29.5% the prior week. However, financial newsletter writers fell to 43.8% bullish, down from 45.8%, and the bears picked up a few percentage points.

The number of NYSE stocks above their 50-day MAs, which I explained in a recent Trading Lesson, rose to 54 last week after hitting a low of 45. This was not as oversold as the readings at the April lows.

chart
Click to Enlarge

The weekly chart of the NYSE Composite shows that it held above the 20-week EMA at 9,124, as well as the prior week’s low. The correction has taken prices below the April high, and the weekly Starc- band now sits at 8,960.

The minor 38.2% Fibonacci retracement support from the June 2012 lows is at 8,757, and the major 38.2% support waits at 8,441.60. This is calculated from the October 2011 low.

The weekly NYSE Advance/Decline line did confirm the highs four weeks ago. It is still slightly above its WMA, and also well above long-term support (line c). If the weekly A/D line starts a new downtrend, it will signal a deeper correction.

As I reviewed last week, the daily uptrend was broken last week, and its WMA is still clearly declining. This is also consistent with a further correction.

S&P 500
The daily chart of the Spyder Trust (SPY) shows slightly higher lows over the past two weeks. The next widely watched level of support is at $159.71 and the April highs. The daily uptrend and the Starc- band are now in the $159 to $159.27 area.

The minor 38.2% Fibonacci retracement support sits at $155.94, with the 50% support at $151.89. The daily on-balance volume (OBV) is holding its uptrend (line b), but is now below its WMA. The weekly OBV (not shown) is still above its WMA, however.

The daily S&P 500 A/D line violated its uptrend (line c) on June 5, and just rebounded back to it and the declining WMA last week. A day of very negative A/D numbers early in the week will turn it more negative.

First resistance waits in the $164.50 to $165.40 area. A convincing close above $165.40 would be the first sign that the correction is over.

chart
Click to Enlarge

Dow Industrials
The SPDR Diamond Trust (DIA) closed the week lower, but above $148.31, which was the prior week’s low. It is now the support level to watch. The April highs of $148.66 were violated earlier in the month.

The daily Starc- band is at $147.51, and monthly pivot support can be found at $146.74. The uptrend (line e) at $144.50 should provide more important support.

The daily Dow Industrials A/D line closed the week just above its uptrend (line f). The A/D line does show a pattern of lower highs and lower lows, which is a sign of weakness. Resistance for DIA currently stands at $152.35 to $153.

chart
Click to Enlarge

Nasdaq-100
The PowerShares QQQ Trust (QQQ) held just above the prior week’s low at $71.47, with the September high (line a) at $70.58. The 38.2% support level at $69.72 should hold on a further correction.

The Nasdaq-100 A/D line tested its declining WMA last week, and shows a slight pattern of lower highs and lower lows. The A/D line has next support at line c. There is next resistance at $73.76, with further levels at $74.21.

Russell 2000
The iShares Russell 2000 Index (IWM) stayed in a pretty tight range last week, with a high of $98.80 and a low of $96.37. The March high of $95.10 (line e) represents more important support. The 38.2% Fibonacci retracement support sits at $91.21.

The daily OBV is slightly below its WMA, but well above its strong support at the uptrend (line f). The daily A/D line has stayed in a narrow range recently, and closed the week below its WMA but well above support (line g).

Current resistance is around $99.20 to $100.38

Sector Focus
The iShares Dow Jones Transportation (IYT) traded in a fairly tight range last week, and closed a bit lower. Volume was lighter last week than it was on the prior week's positive close. There is converging support now in the $107.50 area.

The weekly performance table below shows mostly minus signs, with the Select Sector SPDR Financial (XLF) the weakest at 2% lower, followed by the 1.7% drop in the Select Sector SPDR Energy (XLE).

chart
Click to Enlarge

The best performer was the Select Sector SPDR Consumer Staples (XLP),which was up 1%. The Select Sector SPDR Utilities (XLU) and Select Sector SPDR Health Care (XLV) were flat for the week.

The weekly chart of the Select Sector SPDR Consumer Staples (XLP) shows the higher close, as it held well above the prior week's lows. The recent high is at $42.20, and the weekly Starc+ band is now at $42.93.

chart
Click to Enlarge

XLP's relative performance has turned up, but is still below its flat WMA. The OBV has risen sharply over the past two weeks, and has moved well above its WMA.

In terms of the four index tracking ETFs, the iShares Russell 2000 Index (IWM) was down the least, losing just 0.5%.

The Select Sector SPDR Technology (XLK) was down just about 1%. One of its largest components is Apple (AAPL), which fell more than $11 for the week. Clearly, the World Wide Developers Conference did not give the stock much of a boost.

The daily chart of AAPL shows a potential reverse H&S bottom formation. A strong close above the $466 level would complete the formation. A drop below the potential RS at $418.90 would invalidate the formation.

Crude Oil
Crude oil closed the week strong again last week, above the highs of the past five weeks. The OBV has moved back above its WMA, which is a positive sign. This could be a positive indicator for the economy, and eventually support the overall market.

Precious Metals
The gold futures traded in a tighter range last week, but did close the week higher. The Spyder Gold Trust (GLD) was up only a bit, and needs a strong close back above the four-week highs at $137.62 to improve the momentum outlook.

The Week Ahead
By Tuesday afternoon, the market looked ready for another wave of selling, but it held up pretty well despite Friday's lower close. The technical formations still favor a deeper decline, and it's possible that disappointment over the FOMC meeting will trigger heavier selling.

As I said last week, sentiment still does not seem negative enough to set the stage for another major rally. An influx of new money from bondholders, who are seeing their principal dissipate, could support the stock market.

For the Income Portfolio, a partial position was established in the Select Sector SPDR Utilities (XLU) last week. A partial position was also established in the WisdomTree Japan Total Dividend Index (DXJ) last week.

We are watching a few other high-yield stocks that are getting closer to major support where they will look attractive for new investment. But concentrating on risk and entry for all new positions, as I have stressed from the beginning of the year, is even more important now.

The bottom line is that I expect more pain for bondholders by year-end, and more gains for patient (repeat: patient) stock investors.

See the original article >>

SPY Trends and Influencers June 15, 2013

by Greg Harmon

Last week’s review of the macro market indicators suggested, heading into the next week the markets looked to be in a better mood. We looked for Gold ($GLD) to continue to consolidate or move lower while Crude Oil ($USO) continued to rise. The US Dollar Index ($UUP) and US Treasuries ($TLT) were biased lower and looking ugly. The Shanghai Composite ($SSEC) and Emerging Markets ($EEM) were biased to the downside as well. Volatility ($VIX) looked to remain subdued keeping the bias higher for the equity index ETF’s $SPY, $IWM and $QQQ, and any move lower could trigger a strong equity buy signal. The Equity Index ETF’s themselves were poised to continue their trends higher with the QQQ the strongest followed by the IWM and then the SPY.

The week played out with Gold moving lower and then consolidating while Crude Oil continued higher. The US Dollar did continue lower while Treasuries rebounded slightly on the week. The Shanghai Composite had a short week, gapping lower and setting as Emerging Markets moved lower early in the week then consolidated. Volatility moved back to last weeks highs before pulling in a bit higher but remained subdued. The Equity Index ETF’s SPY, IWM, and QQQ chopped up and down with some big range days. What does this mean for the coming week? Lets look at some charts.

As always you can see details of individual charts and more on my StockTwits feed and on chartly.)

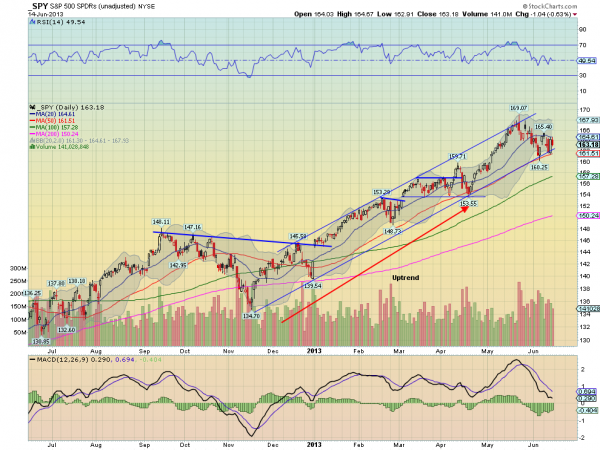
SPY Daily, $SPY
spy d
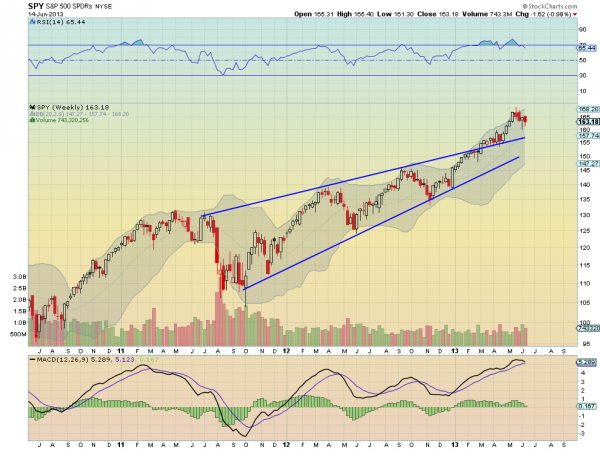
SPY Weekly, $SPY
spy w

The SPY started the week breaking above the 20 day SMA but it did not last. A move back down to the 50 day SMA and it may be range bound for a little bit, between the two SMA. The uptrending support from November continues to hold and the volume is starting to tail off. The RSI on the daily chart is holding at the mid line, in bullish territory with a MACD that is starting to level on the signal line and is improving on the histogram. A mixed picture. Out on the weekly view the pullback continues, resembling a bull flag. A break of that flag higher has a Measured Move to 175. The RSI has worked off a technically overbought condition with a MACD that is rolling over. Some negative signals on this timeframe. There is support lower at 163 and 161.60 followed by 159.70 and 157.10. Resistance higher is found at 166.50 and 167.50 before 169. Consolidation with a Downside Bias in the Uptrend.

Heading into next week look for Gold to consolidate with a downward bias while Crude Oil moves higher. The US Dollar Index and US Treasuries look to continue lower. The Shanghai Composite and Emerging Markets are also biased to the downside. Volatility looks to remain low but slowly trending higher making the bias lower for the equity index ETF’s SPY, IWM and QQQ, in the short run. Their charts also show signs of a pullback with than SPY and QQQ both weaker than the IWM. Use this information as you prepare for the coming week and trad’em well.

See the original article >>

Follow Us