Wednesday, May 18, 2011

Soybeans to gain post-flood acres

by Mary Hightower

Soybeans are expected to gain acres as floodwater recedes in Arkansas, according to Extension agents with the University of Arkansas Division of Agriculture. 

Soybeans have the best odds for success in this disaster-disrupted growing season because of the relatively flexibility of their planting schedule. In March, USDA estimated 3.25 million acres of soybeans were to be planted in Arkansas, 1.04 million acres of rice.

“We’re in the best possible situation – most of our crop is still in the bag,” said Jeremy Ross, Extension soybean agronomist for the University of Arkansas Division of Agriculture.

The standard recommendation for planting soybean varieties in Arkansas is April 15 to June 30. Planting during the conventional time period usually provides for rapid seed germination and emergence.

Hank Chaney, Faulkner County Extension Staff Chair, said it’s likely that many acres intended for corn and rice will be turned over to soybeans. Preliminary estimates had about 80 percent of the county’s 10,000 farmed acres submerged at the peak of the flooding.

Faulkner County is near the center of the state and flooding was largely due to the swollen Arkansas River.

“Water has receded off of some rice fields and it appears they will survive and not have to be replanted,” said Chaney. “Farmers that had planned to plant rice are now switching to soybeans instead. Corn fields that were underwater for more than four days will either be replanted if they can be irrigated or destroyed and seeded with soybeans.”

County agents in Craighead, Jackson and Mississippi counties also said they expected corn, rice, sorghum and cotton acres to go over to soybeans.

According to the National Agricultural Statistics Service, 21 percent of the soybean crop had been planted by May 6.

For more information on crop production contact your county Extension agent, visit www.uaex.edu or visit www.arkansascrops.com.

U.S. Dollar Index Components & Swings

By Barry Ritholtz

We’ve posted a few items about the dollar recently (See this and this). the recent counter-trend strength in the buck is what has roiled commodity markets as well as equities.

Today’s NYT has an article that on a possible greenback rally, Some See Rise Ahead for Dollar:
“Could the long dollar slide be over?
For the better part of the past decade, and particularly in the last few months, the American dollar has been the 98-pound weakling of the foreign exchange world. It has lost value against almost every other global currency — not just the euro, pound and yen but even the Romanian new leu and the Latvian lats.
Driven largely by the Federal Reserve’s policy of printing dollars to help spur a healthy economic recovery that remains stubbornly elusive, the dollar, weighed against a basket of other currencies, hit a 40-year low this month.
But betting against the dollar may no longer be such a safe play — not necessarily because of any sudden macroeconomic shifts but because of a sense that the long dollar sell-off may have finally gone too far. Since May 4, the dollar is up 4 percent against the euro and 2 percent against the pound, while rallying against the Romanian and Latvian currencies as well.
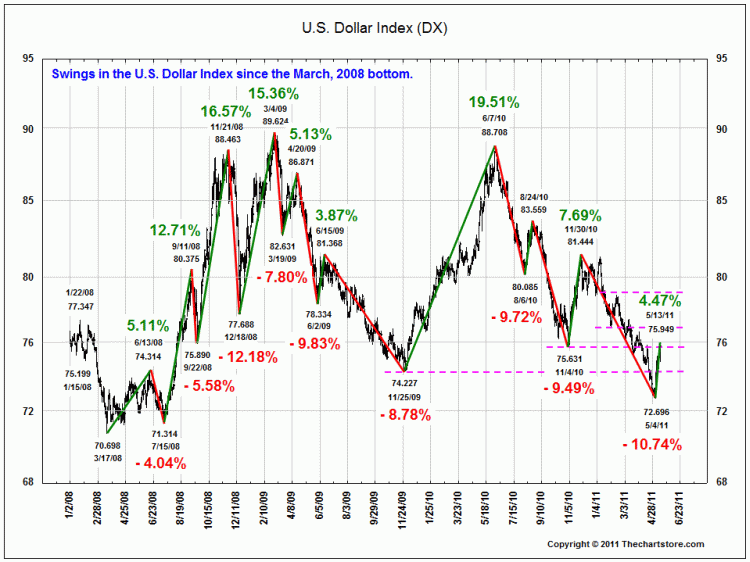
In light of the article, let’s take another look at a few Dollar charts:
>

US Dollar Swings

click for larger charts

>

Dollar vs Major Currencies


Corn's price to lose against soybeans' - SocGen

by Agrimoney.com

Has the march of corn prices, compared with soybeans, reached its end?
The grain's rally - fuelled by a poor US spring sowing season at a time when stocks of the grain are already near historic lows - has already seen it notch up a landmark against wheat, only sharply to surrender it.
Chicago corn last month gained premium to wheat for the first time since 1996 - temporarily. On Wednesday, Chicago wheat had a $0.45-a-bushel advantage.
Societe General believes corn might be on for a reversal in its relationship to soybeans too.
The French bank named a "long soybeans, short corn" trade, on new crop contracts, as one of its top investment bets, among a list of recommendations ranging from selling protection on China Development Bank to a trade of buying the pound and selling the yen.
Key ratio
The idea is based on the idea that corn prices rarely move near half those of corn for too long.
Indeed, as a rule of thumb, a drop in the price of soybeans below 2.0 times that of that grain is viewed as the trigger for farmers to switch sowing area from the oilseed to the grain. (The dynamic is seen working the opposite way at a ratio of about 2.5.)
Yet that is pretty much where futures prices are lodged now, on prices for the forthcoming harvest.
With November soybeans at $13.24 a bushel on Wednesday, and December corn at $6.54 a bushel, the ratio was 2.02.
Surplus vs deficit
"The end-2011 soybean-to-corn price ratio currently stands at a historically very low level which makes it much more profitable for US farmers to plant corn instead of soybeans," SocGen commodity strategist Jesper Dannesboe said.
"This means that new season US corn production is likely to increase by 3-4%, resulting in a global corn surplus while we expect a global deficit for soybean."
"Based on this, we expect the November 2011 soybean over December 2011 corn ratio to increase substantially over coming months."
The ratio should return to 2.3, near where it stood at the start of the year, Mr Dannesboe said.
'Too soon'
If that sounds appealing, remember the one sticking point is whether US farmers, many of which have been dogged by an unusually wet spring, can even get their existing corn planting plans completed, let alone any extra area that the ratio with soybean prices might dictate.
Indeed, talk has been of the loss of at least 1m acres of corn area and potentially a rise in plantings of soybeans, which can be later sown.
Still, "it is too soon to determine what kind of acreage shifts there may be way from corn to soybeans as economic factors and fall fertilizer applications, along with the calendar, will still play a vital role in any acreage shifts," Kim Rugel at Benson Quinn Commodities said.
Farmers who pumped extra fertilizer into soils in the autumn may be reluctant to switch to soybeans, which are less nutrient intensive.
Furthermore, technically, it is unclear whether the market has much appetite for weakening, relative to corn.
Rugel noted that in the last session, soybeans had fallen into negative territory, only to recover after the visit "did not uncover sell stops", automatic sell orders, which would have driven the oilseed lower still.

Merrill Lynch cautions over commodity price fears

by Agrimoney.com

Bank of America Merrill Lynch has cautioned against gloom in risk assets, such as commodities, after fund managers cut their exposure to the sector to the weakest for eight months amid nascent fears of a price collapse.
The proportion of portfolio managers overweight in commodities is only 12% higher than those underweight, as they cut commodity positions "sharply" over the last month, a survey for the bank showed.
The figure compares with 24% more fund managers overweight in raw materials a month ago, and is the weakest reading since September, when revived inflation concerns sparked interest in raw materials which should – in theory – offer a hedge against rising asset prices.
Bonds were the biggest beneficiary of investors liquidating commodity holdings.
List of threats
In fact, the decline in commodity's popularity over the last month, fuelling a drop in oil prices below $100 a barrel and sugar prices to an eight-month low, co-incided with an unwinding of inflation concerns, besides lower expectations for world economic growth.
The proportion of fund managers naming commodity price inflation as the top economic risk more than halved to 16%, overtaken by the 36% which named Europe's sovereign debt crisis as the main danger.
The risk of a "sudden drop in commodity prices" also emerged as a threat.
'Pessimism overdone'
However, fund managers may find they are taking too gloomy a perspective, following bumper economic growth figures from France and Germany, Gary Baker, the bank's head of European equities strategy, said.
"A risk for investors is that pessimism on Europe now looks to be overdone, particularly in the light of strong recent GDP data," he said.
The bank recommended a trade of reversing the flow of cash from commodities to bonds if economic growth indeed proves stronger over the summer than has been expected.
The survey, of 284 fund managers controlling $814bn of assets, showed that 34% more investors rated oil overvalued than undervalued, a figure up three points over the last month despite its price drop during the period.
The proportion seeing the gold rally has having gone too far rose to a net 33%, from 25% in April.
See the original article >>

Grain export ban dents rebound in Russian farmland

by Agrimoney.com

Russia's grain export ban has set back a potential rebound in its agricultural sector from a decline which has seen its farming area shrink by one-third – an area bigger than Germany – since the collapse of the Soviet Union.
Andrey Sizov, the managing director of analysis group SovEcon, said that it was likely that some of the 40m hectares of Russian farmland abandoned over the last 20 years would be brought back into production as the world struggles to feed its growing population.
However, the drive to attract the money pouring into farming funds had been setback by the uncertainties fostered by Russian's export ban, imposed from August as drought ravaged crops in much of the former Soviet Union.
"The ban was viewed as a negative by funds who were considering making investments into Russian agriculture," Mr Sizov told Agrimoney.com.
"That investment did not happen after the ban. To get investors interested we need more predictable state policy, and transport."
Drought likelihood
The comments came as Mr Sizov questioned the likelihood of a further drought in Russia, fears for which have grown on international markets following forecasts of an extended dry period.
Last year's drought was in fact the second in a row for some areas, such as the Volga region, but whose 2009 difficulties had been overshadowed by the scale of last year's devastation.
"I do not think we will see a third drought in a row. The chances are not that high," Mr Sizov said.
SovEcon is forecasting a Russian grains crop of 78m-83m tonnes, sufficient to enable exports of 10m-14m tonnes, which assumes improved weather this year.
Huge farms
In fact, much of Russia's farmland had a predictable and ample water supply. Even last year, many areas, such as European districts, reported good crops.
Investors have also been attracted by the relative price of Russian land which, at about $500 per hectare in the Black Earth regions, is less than one-tenth of the price in South America and the US.
Farms can, unlike in Ukraine, also be bought outright rather than leased, although only through a Russian-based entity.
And large areas, enabling economies of scale, can also be obtained, with at least 12 companies controlling more than 300,000 hectares, and more than 30 controlling more than 100,000 hectares.
"Due to excessive supply, there is no problem with purchasing large agricultural land plots, the size of which may range from 10,000 hectares, which is likely to be a former collective farm, to 50,000-100,000 hectares."
Bread feed
Nonetheless, the collapse of Russia's crop area has been borne in the main on pastureland, for which area has more than halved, reflecting the inefficiency of Soviet livestock farming.
"Farmers used to feed their animals bread," Mr Sizov said, citing conversion ratios for pigs of eight units of grain per unit of live weight, compared with about three at efficient farms today.
The level of grain imports needed to maintain Russia's livestock sector was a major cause of the financial strains which contributed to the Soviet Union's collapse.

See the original article >>

Seems Like Yesterday Everyone Wanted to Short Treasuries

by Gregory W. Harmon

Can you remember the last time that someone was preparing to short Treasuries? It could not be that long ago. Oh, yeah, I remember it was when they bounced off of the 8 year rising trend line in the beginning of February. It seemed so simple then. There were two catalysts. The Government was going to continue to spend more than it took in and therefore need to continue to issue more debt. And with the deflating of the dollar through endless rounds of Quantitative Easing (QE) the resulting inflation would also hurt Treasuries.
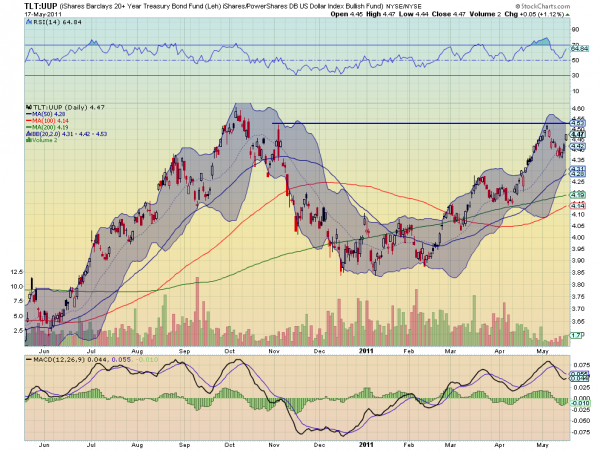
Did all that change in the matter of 3 and a half months? Are we closer to balancing the budget? Has the dollar bottomed? Many would answer these questions in the affirmative or at least say that we are moving in the right direction. Others would say that nothing has changed. But what do the charts say? Using the iShares Barclay’s 20+ Year Treasury Bond Fund (ticker: $TLT) and PowerShares DB US Dollar Index Bullish Fund (ticker: $UUP) as proxies, they tell a story of an impending crossroads.

TLT vs UUP – Daily
tlt uup e1305667268288 stocks
The ratio chart above shows the trend higher from the triple bottom from December to February. It rejected at the high at 4.53 previously reached in November earlier this month but is now re-approaching it from a higher low. The Relative Strength Index (RSI) is pointing higher supporting at least a retest, and the Moving Average Convergence Divergence (MACD) is improving. Even the volume is increasing. If it can get through the resistance then it has its last resistance at 4.60 before it sees clean air and a target of 4.73 on a Measured Move (MM) higher. 

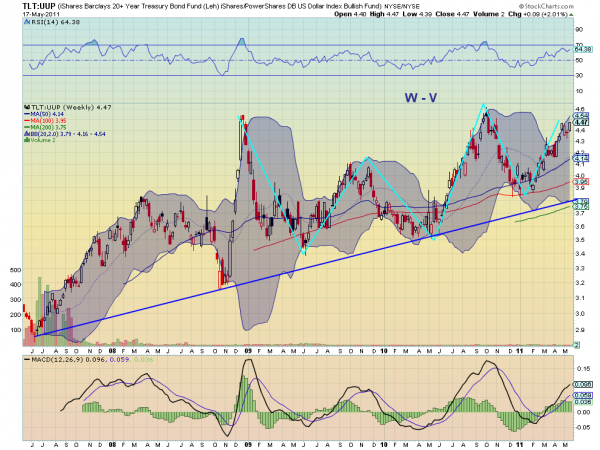
The weekly chart below is even more interesting. It shows that a rise to 4.60 would complete a ‘W’ – ‘V’ pattern. Also note that the over the last 4 years the trend for the ratio has been higher. The RSI is trending higher but the MACD is leveling in positive territory.

TLT vs UUP – Weeky
tlt uup wkly1 e1305668625344 stocks
Both timeframes suggest that the path for the ratio is higher. That fits with the view that QE2 will end without a QE3. And that as the Federal Reserve keeps saying, any bump in inflation will be transitory. And that the budget negotiations driven by the need to compromise on the debt ceiling will result in reducing Treasury issuance. Seems like a tall order for just one of these to come true, but hey this is what the charts say. Or is it? The charts do not guarantee that this will happen. Wait for the break of resistance before you put your money on it. A rejection at 4.53 again and all bets are off.

Final Earnings Season Beat Rate Nothing to Write Home About

by Bespoke Investment Group

Earnings season, which runs from Alcoa's (AA) report date through Wal-Mart's (WMT) report date, came to an end today. Over this time period, the S&P 500 was pretty much flat, gaining 35 basis points. 

Pretty much all of the commentary we've been hearing in regards to the reporting period has suggested that earnings season was very strong. At least based on the percentage of companies that beat earnings estimates, "very strong" couldn't be further from the truth. As shown below, 59.5% of the 2,132 US companies that reported this earnings season beat earnings estimates. This is by far the lowest quarterly "beat rate" reading of the bull market, and it's seven percentage points below the "beat rate" last quarter.


Not Giving Up On Soybeans...Just Taking A Little Break


As most of you have seen, I have been scaling back my soybean ratings for the past several weeks. If you aren't signed up for the report, you can click the link and receive the free trial so you can catch up on where I am at with this. Since mid-February prices have fallen from the $14.74 high back down closer to the $13 dollar level. Am I bearish longer-term? Certainly not, but as my sources had indicated supplies were drastically backing up at the ports and the Chinese government was starting to subsidize the processors with below market price beans, along with selling cooking oil below import values to hold food inflation down. With China being the driving force behind global soybean demand there are really very few bullish cards left in the deck right now. Especially now that the South American crop appears to be safe and larger than originally anticipated. The bad part is this pattern could certainly continue for several more weeks and or even several more months with demand for the South American crop backing up and possibly pressuring US beans well past harvest. Fear in the trade continues to mount regarding Chinese bean cancellations and thoughts that Chinese demand may continue to slow. There are also several analyst now predicting US producers will have no choice but to plant more bean acres than originally anticipated. With bearish news mounting, you have to believe beans may continue to fall under pressure, at least until China starts to replenish their "reserves". When this happens demand will once again escalate and could potentially push exports to new all-time highs. Throw in some type of possible production glitch and you have the recipe for skyrocketing prices. When this will occur seems to be the magic question. You have to believe as prices fall and eventually make it more feasible for them to import, they’ll begin to consider refilling their strategic reserves. Remember, they were able to hold down domestic prices by throwing their state owned soybean reserves on the market at much cheaper prices than anyone could import them for, eventually they have to restock. Knowing this, and understanding how they operate I urge you to be careful getting bearish soybeans longer-term. Look for beans to have some nice potential down the road, just not right now. There are a few "bullish" cards in the deck right now that you should keep your eye on, but not many. One pertains to some recent rumors floating around that "quality" issues in the South American bean crop may force China to cancel more South American bean purchases and look for more high quality US beans. Another thought is that recent forecast are now calling for later than normal dry hot weather which could adversely affect soybean yields. One more is the fact the Chinese government has made a calculated decision to plant fewer soybean acres this year. One has to believe few acres planted by the Chinese farmers means more beans will be needed in order to replenish domestic supplies. I continue to like being aggressive "cash" sellers above the $13.00 level (simply too good of a price to let slip by), choosing rather to re-own on any substantial break of $1 or $2. I just believe China has no choice but to step back in on a break to $11 or $12. Trust me, they understand the need to replenish their reserves in a big bad way if they are to have any hopes of battling the next round of inflationary food prices. I think we are still a ways off, but as bean prices continue to drift lower be on the lookout for China to crank back up the bean buying bonanza. It may not occur for some time, but you have to believe it eventually comes back around.

See the original article >>

Stock Market Defining Lines Are Clear....Bears Making A Move....


It's all about 1315 and 1370. 1370 being the old highs and 1315 being the trend line from the old lows. Anything that takes place in between is simply noise. But my job is to try to figure out which way things will break, which is just not clear right now. The bears are fighting down here. Trying to rid 1335 with force and get through the 50-day exponential moving average at 1327. Because the two levels are so close the bears really need to push this towards 1315 quickly, so the bulls will then struggle with support-turned-resistance at 1327/1335.

Some big time leaders are definitely having a tough time these days that haven't had a tough time in years. Apple Inc. (AAPL), Google Inc. (GOOG), Amazon.com Inc. (AMZN), Molycorp, Inc. (MCP), and many others to name a few. Lots of leaders have lost their 50-day exponential moving averages. A change of character yet the market has not lost key support by any means. Rotation is keeping the market alive. It's also working down the oscillators on the daily charts. We're closer to the bottom of the channel, but nowhere near breaking down as of yet. It seems that would have to happen on some bad news overnight that gaps the market below the 50-day exponential moving average.

The market is trending lower for sure, but the bears need that snap down. If we lose 1315 then the market can really start to let things go to the down side. No real support until 1250. This is why the bulls will fight things so intensely the closer it gets towards 1315. Right now the onus is on the bears to get things done as they haven't been able to do so. But they are getting closer for sure. For the bigger picture market, it would be best if things just fell apart for a while to get pessimism ramping to very high levels. That's where the best bull moves take place.
Watching the commodity stocks today, they get a nice oversold bounce, but many of these stocks are broken short-term and trading well below major support-turned-resistance at their 50-day exponential moving averages. When they lost those key 50 tests, many did so with large gaps making the journey back through very difficult, if not nearly impossible, short-term. This means the market is now dealing with two broken sectors that matter a whole lot in those commodity stocks and the financials, which look totally hopeless for now.

The very worst market performers are those financials, thus, you need to stay away as much as humanly possible. There will come a day when they'll be good, yet again, but that time is not upon us. So look elsewhere if you need to play this game with any aggression. Semis are holding up well for now as the Intel Corporation (INTC) chart remains bullish, as do many of these stocks, but that may not last much longer. So we'll watch closely for that in a big way. If the best area holding up finally gives in, look out below. Froth is simply being taken out, and shot for now, stay away from those high P/E stocks if you must play.

Nothing has changed in terms of the forces guiding this market. Liquidity and the daily charts versus weekly negative divergences and not so good readings on sentiment. You also have to wonder whether the market is getting nervous about the liquidity issue as QE2 is about to end. Just six weeks left for that printing press. You know the fed is going to find other ways to keep liquidity pumping into the system since all he's concerned about is keeping the market afloat to some degree so that Main Street keeps flowing along. The fed is not worried about inflation for some reason at this moment in time, so it's my guess he'll use other tricks to keep the economy flooded in cash.

To do otherwise would lead to the most dreaded word in his language, deflation! Anything but that. I think the market will soon learn that he'll protect it. If that does take place, as I suspect it will, the market will likely struggle along for weeks, maybe months, to allow sentiment to pull back and get more bearish. It'll also allow those weekly charts to unwind some and work off some of that nastiness it holds right now. There are enough forces going on here that tells me the worst of this pullback would be contained by S&P 500 1250, or about 7% from here, if we do, indeed, lose 1315.

When markets are like this it's best to have no more than 15% exposure, if not all cash. If you're long, use 1315 as your line in the sand. You don't want to be in if that level is lost. You don't want to be short if we take out 1370 on the S&P 500. It looks like we're ready to move lower, but you have to see the move in order to play it. Again, I think it'll take a large gap down to get this rocking lower. It's hard to remove critical support intraday, although that's not an impossible task, just a very difficult one, for sure, as the bulls will fight if given a chance, thus, a gap down is better. Keep it light. Again, no more than two plays either way until a clear break is made.

See the original article >>

US Corporate Earnings Peaking - Shift into Defensive Growth Stocks


The recovery in global stock markets, which started in mid March 2009, is just over two years old. Many commentators feel that the recovery is illusory, based on cheap money from central banks and reckless fiscal spending by governments desperate to stave off recession and rising unemployment. Others see an improving global economy with the emerging markets as the new locomotive of world growth underpinned by rising populations, the urbanisation of China and India in particular and the consequent growth in emerging economy middle class incomes, which has brought some two billion consumers into the global economy. 

There is no doubting that the global economy is unbalanced - debt is too high in many developed economies and consistent trade imbalances remain a destabilising force. But that is the macro view and very hard for anyone to draw a conclusion from.

If we focus on the world’s largest and most influential equity market, the US S&P 500, there are only a couple of key variables that determine how cheap or expensive the market is relative to history. Those variables include;
  • The trend of US corporate earnings
  • The levels of corporate earnings versus overall economic output in the US
  • and competition from interest rates (or bond yields) 


US Corporate Earnings

Chart A highlights the long term trend in earnings in the 500 companies making up the S&P 500 Index. This is a diverse index made up of companies across a broad range of sectors aimed at representing the US economy. The chart makes a few key points. The first is that analysts at Standard & Poors expect earnings of $96 for the S&P 500 Index in 2011, a new peak in earnings.
In addition, this has been one of the fastest recoveries in earnings following recession in history.

At the current S&P 500 index level of 1,341 (at the time of writing), the $96 of earnings means that investors are paying 14 times expected 2011 earnings, which is at or around the long term average investors have paid over the long term (see Chart B). No worries so far!


Corporate Earnings versus Economic Output

But we must also remember that the level of corporate earnings is a function of economic output and, over time, there tends to be a fairly stable relationship between the how much of the economic pie goes to companies and how much to other parts of society like labour (or wages).

Chart C shows that US corporate pre tax earnings have averaged circa 10% of GDP through all the business and economic cycles since 1960, some 50 years of data. Currently, US earnings are at 12.2% of GDP which is some 20% ahead of the long term norm. This is reason enough to query whether the market is being overly optimistic in expecting earnings for the S&P 500 companies to rise further this year from $87 to $96. History suggests the opposite if more likely – that US earnings are more likely to revert to the mean and back towards the long term average of 10% of GDP. US corporate profits are a function of economic output and cannot outgrow the economy for long.

Chart C, therefore, paints an altogether more sobering picture - one where current earnings in the US economy are already back to near a peak when compared to economic output. Hence, while investors appear to be paying fair value of 14 times US earnings they are paying that for peak earnings. On that basis, we might conclude that the valuation of the US equity market is some 20% above long term norm and, therefore, overvalued in the short term.


Assets Can’t be Valued in a Vacuum
But the tricky part comes next. The valuation of any asset class has to be judged against the alternatives. Accountants have no problem with numbers so I will use more here. In 1999, the US equity market was trading on circa 25 times prospective earnings. That can be equally expressed as an earnings yield of 4.0% i.e. the S&P 500 earnings, in aggregate, represented 4.0% on the price being paid. The trouble at that time was that the risk-free US government 10-year bond was offering a yield of 6.3%. In other words, the value lay in US bonds. The subsequent ten years have delivered miserable return to investors in the US stock market, not due to bad luck or recessions but due to the simple fact that equities were grossly overvalued relative to history and the simple alternative of bonds at that time.

Roll forward to 2011 and the issue is not anywhere near as clear cut. If we accept that the 500 companies making up the S&P 500 will earn $96 dollars in 2011 and that the market remains at the current level of 1,341, then the US equity market currently offers an earnings yield of 7.2%. In comparison, the US 10-year government bond yields 3.3% (at the time of writing).

In 1999, the value in US bonds over US equities was clear. Today, it appears that US equities offer a higher earnings yield than US bonds. But the certainty one attaches to peak earnings must be low, and a betting man would assume that US earnings cannot hold their current levels.

This probably leaves us in no-man’s land! US government 10-year bonds look unattractive and US equities, while potentially cheap versus bonds, are possibly 20% overvalued when looked at in isolation relative to the long term norm.

But pockets of value exist and value investing is all about understanding that the return you get is heavily linked to the value you buy (or price you pay) at the outset. 


Chart D highlights the radically different earnings profile of the US global consumer franchise stocks. This chart averages the earnings of eight such companies since 1989 – Coca Cola, Kraft, Johnson & Johnson, Kellogg, McDonalds, Wal-Mart, Proctor & Gamble & Colgate – and compares their earnings to the S&P 500. Not only have these great companies grown their earnings at double the pace but they have done so with little or no interruption i.e. they possess the elusive ‘Reliability of Earnings’ factor.

And reliability of earnings combined with an ability to grow should be highly prised by investors. But Chart E highlights that this collection of stocks is available on an average price-to-earnings rating of 15, as low a rating in quite some time. 


And finally, a price-to-earnings ratio of 16.4 equates to an earnings yield of 6.1% which is almost double the current 10-year bond yield of 3.19% (Chart F). And bonds offer no growth. For these reasons, I’d own these stocks before I’d buy the S&P 500 Index or American stocks in general or US government bonds.

THE FED’S BALANCE SHEET AND THE EQUITY MARKETS

by Cullen Roche

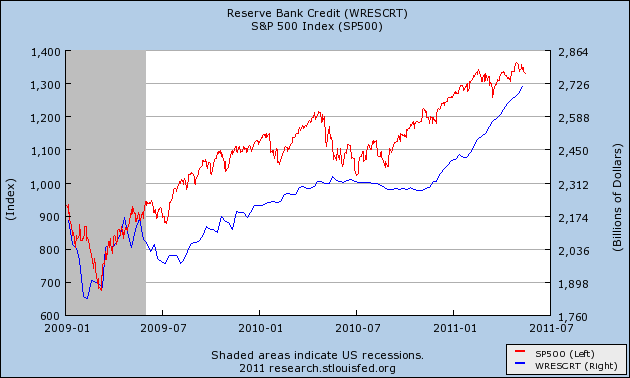
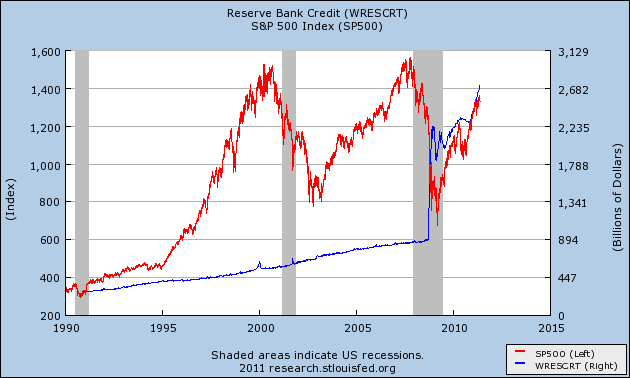
You’ve probably seen this chart going around in recent months. It shows the size of the Fed’s balance sheet and the S&P 500. At first glance, they look perfectly correlated. In fact, the correlation is almost unbelievable:
Of course, there’s more to the story than just that. Since 2009 the economy really has improved. The fiscal stimulus really did work. The calls for doom and gloom in March 2009 were excessive. QE1 really did work to help make a market in illiquid markets. Earnings really have rebounded. That’s not to say that the “recovery” has been strong or even that it’s been organic. No, as is the case in a balance sheet recession, the patient is largely on government life support. After all, it’s the only entity that can provide the support. Had they not stepped in when they did the economy would be far worse and would likely resemble something along the lines of Greece or Ireland where austerity has its death grip on their economies. We can quibble over the various programs and bailouts (many of which I did not support), but that’s for another day….
The correlation between the Fed’s balance sheet and the equity market must be put in perspective. Particularly with regards to QE1. QE1 essentially helped establish a market in illiquid markets. Make no mistake – it was an asset swap just like QE2. I stated this clearly in 2008:
“What Ben Bernanke and Hank Paulson are essentially proposing is an asset swap. The Fed will take on the toxic assets of the banks and they will receive reserves in exchange. This is important because it will alleviate the strains in the credit markets. That’s a good first step, however, it is not a solution to the problem at the household level and THAT is where the real economic weakness is. By introducing this asset swap idea Ben Bernanke is simply altering bank balance sheets. He is not fixing the economy.”
QE1 was effective because it came at a time when markets were highly unstable. And the channel through which it worked was largely psychological. All the Fed did was inject some sanity into a fairly insane market environment. But while there was some fundamental impact I think it’s misleading to draw broad conclusions from these Fed operations with regards to future equity price movements. This is most obvious if we just alter the above chart a little bit and provide some perspective.

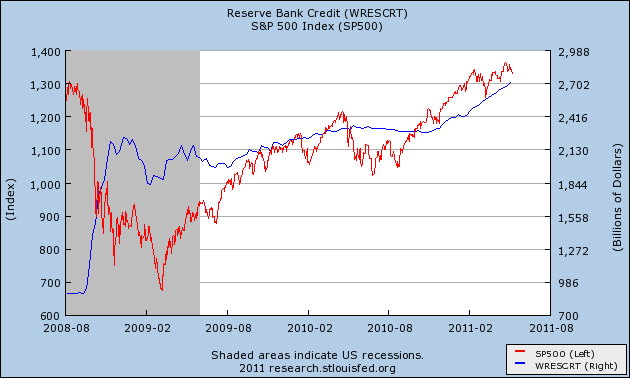
For instance, the chart below was most widely used in 2008 by inflationists. They argued, incorrectly, that that Fed’s injection of reserves would result in inflation and in many cases hyperinflation. Interestingly, however, few of these inflationists were arguing that there would be a correlation between the Fed’s balance sheet and the equity market. As you can see below, the correlation between the Fed’s balance sheet and the equity market becomes dislocated when we back the above chart out to the actual beginning of the Fed’s balance sheet expansion:
For the first 6 months of the Fed’s balance sheet expansion there was actually a negative correlation between stocks and the Fed’s balance sheet. All of the sudden the chart looks like it’s not as useful. Perhaps the correlation between the Fed’s balance sheet and the equity market is not as tight as the first chart above shows. Let’s back the chart out a bit more.
The long-term perspective shows that the correlation totally breaks down. And this is not all that surprising. After all, QE2 isn’t anything unique. It’s just Fed operations at longer duration. In fact, it’s far less impactful on the real economy because of the misguided way in which it’s implemented. Instead of naming a price (as they do at the short end) they are naming a size (see here for more). I think the results of the program pretty much speak for themselves at this point as we now have clear evidence that real GDP topped when QE2 started.

So, is there a correlation between the Fed’s balance sheet and the equity markets? Yes, but it’s difficult to pinpoint. The Bernanke Put and the Greenspan Put have a clear impact on markets, however, it is misleading to manipulate charts to pinpoint this effect. In a normal economic environment (not a balance sheet recession) Fed policy would work by enticing investors to take on more debt. That channel is clearly broken as the private sector continues to de-leverage. So, the only channel through which QE2 can work is through portfolio rebalancing which Ben Bernanke hopes will lead to a wealth effect. Unfortunately, this portfolio rebalancing works almost entirely through psychological channels. Investors don’t have more firepower than they did before QE2. After all, it really is just an asset swap – in this case, 2% paper for 0.25% paper. There isn’t more money sloshing around in the economy and there isn’t more liquidity. There’s just more eager speculators who hope to benefit from the Fed’s form of ponzi finance where they target nominal wealth creation as opposed to real wealth creation.

So yes, the Fed’s implicit backing via the Bernanke Put has had a profound impact on market psychology. It has, in essence, created a backstop for speculators. This has been most obvious in the surge in NYSE margin debt levels. So yes, there is some correlation between QE and the equity markets, however, I think it’s misguided to manipulate dates on a chart just to show that QE will lead to this or that. The fact is, QE2 didn’t do much for the real economy. So, while QE may have had an impact on psychology and a resulting surge in equity markets and margin debt, I don’t think we can say that the Fed’s balance sheet directly correlated to anything. And in fact, if the market loses confidence in the Bernanke Put and realizes that QE2 did nothing of substance, we might actually experience an environment in which the equity market declines and the Fed’s balance sheet remains nice and bloated. But that’s just nominal wealth destruction and has no correlation to the lack of real economic stimulus that QE2 provided. And therein lies the real problem with QE2 – it targets nominal wealth with the hope that nominal wealth will lead to real wealth. Unfortunately, that’s just not how economics works. And as I’ve previously discussed, if this nominal wealth binge leads to market dislocations it can have a highly damaging impact on the real economy and ultimately, real wealth.

See the original article >>

LinkedIn IPO likely a success, but risks real

By Alina Selyukh and Clare Baldwin

(Reuters) - An initial public offering by social networking firm LinkedIn Corp to raise about $341 million seems poised to be a stunning success, but it carries a number of risks that may shake up investors in the future.
The IPO is expected to price after the close of U.S. markets on Wednesday and start trading on Thursday.
In the fervor surrounding the rush to the first major U.S. social networking company to become public, investors may overlook some risks that could sour LinkedIn in the future, analysts say.

One of the biggest risks may be LinkedIn's gutsy bet on its future growth -- combined with an admission that it does not expect to be profitable in 2011 on a U.S. generally accepted accounting principles(GAAP) basis.

"Frankly, they're a little bit arrogant saying, 'We're going to have a great IPO, but we're also going to lose money this year,'" said Francis Gaskins, IPOdesktop.com president.

LinkedIn raised the expected price range of its IPO by 30 percent on Tuesday. At the midpoint of the new range, the IPO would raise $341 million and give LinkedIn a market value of $4.1 billion.

No final decision has been made but the IPO is currently expected to price toward the upper end of the revised range, said a source who spoke on condition of anonymity.

LinkedIn's net revenue grew more than 100 percent from 2009 to 2010, while the company ramped up its sales and marketing spending by 120 percent in the same period, according to a filing with U.S. financial regulators.

After two years of losses, LinkedIn finally made money for its common stockholders in 2010 -- but then it was back to only breaking even in the first quarter of 2011.

In the risk factors section of its prospectus, LinkedIn said the rest of the year could be the same, or worse:
"Our philosophy is to continue to invest for future growth, and as a result we do not expect to be profitable on a GAAP basis in 2011," the company said.

LinkedIn added that it expects its revenue growth rate to decline over time and its costs to increase.

The risk factors section of any prospectus is designed to encapsulate worst-case scenarios. Furthermore, it is not uncommon for an unprofitable company to seek a public listing.

But a profitable company flatlining or swinging to a loss in its first year as a publicly traded stock could prove an unwelcome surprise for investors betting on the booming growth of social media companies.

Earlier this week, the chief executive of LinkedIn's French rival Viadeo told Reuters his venture would delay its IPO, in part because of concerns of having to answer to shareholders about profitability.

Although investments toward future growth would give LinkedIn a springboard with which to compensate investors, the delay -- in a hot sector abuzz with new startups and bursting with copycats -- could prove riskier than it seems on paper.

"There's a risk for people to become complacent about the technology company to own the space forever. There's always somebody new coming up with a better form of something, at a better advantage for the user," said IPOfinancial.com's David Menlow, reflecting on the hype around MySpace, shortly before the emergence of Facebook, which quickly shoved it aside.

Another risk LinkedIn faces is its website being blocked, which would limit its user base and could curtail some of the potential growth so attractive to investors. The risk is especially real in China, where LinkedIn has more than one million users and its website has already faced a temporary disruption.

INTERNET STOCK?

Another peculiar fact about LinkedIn is that on some level it's not quite the Internet company most consider it to be.

The Big Four web companies basking in the glory of skyrocketing valuations and the expectation of blockbuster IPOs -- Facebook, Twitter, Groupon and Zynga -- make most of their money through online advertising or Internet services.

LinkedIn is an online platform but actually makes more money through so-called "field sales," or a salesforce directly soliciting customers, agencies and resellers.

In 2010, 56 percent of LinkedIn's net revenue came from field sales. By way of comparison, only 44 percent of LinkedIn's net revenue came from online sales.

"(Feet on the street) is an expensive sales force," Gaskins said. He added that almost half of LinkedIn's business comes from selling "hiring solutions," which help match companies and job-seekers, a space where LinkedIn could face tough competition from niche job-seeking sites and traditional recruiting firms.

"It's a high wire act," Gaskins said of LinkedIn's longer-term prospects. "They might make it, but it's risky."
Follow Us