Wednesday, August 10, 2011

Hurrah! Bullish Engulfing and Outside Reversal


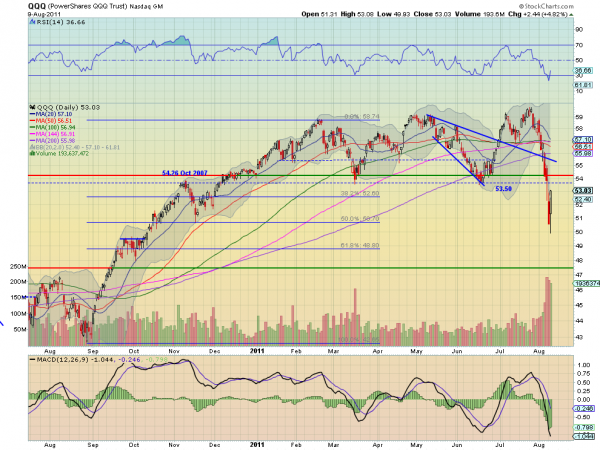
Tuesday was a powerful day in the market, maybe. The ranges for the $SPY, $IWM and $QQQ were all bigger than Monday, and they all finished near their highs. Awesome. These all had outside days in the vernacular of the the bar chart. This could mean a bottom. And from a bastardized Japanese candlestick perspective they can be viewed as Bullish Engulfing candles. The real body of the candles was not officially big enough but the range makes it so. This needs to be confirmed but if it is can signal a powerful move higher, on the daily time-frame. Look at the daily

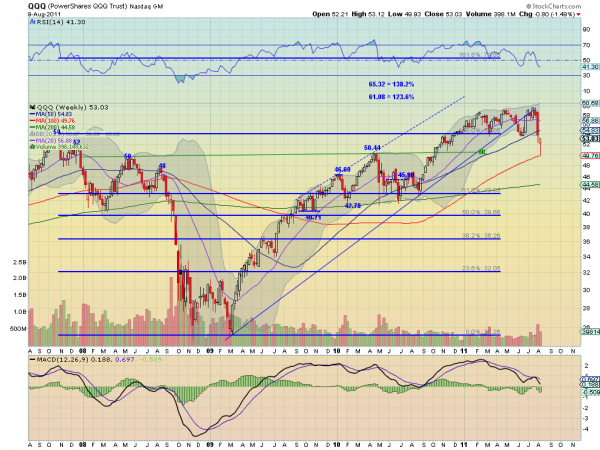
chart for the $QQQ. The move Tuesday was massive, over 15%. And strong but just back into the Bollinger bands. It looks like a strong reversal if it is confirmed Wednesday. But what do longer time frames say? Look at the weekly chart below. The week through two days looks like a throw all your

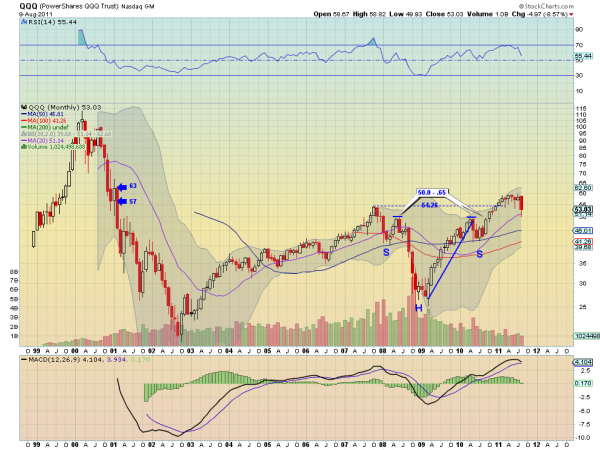
money back in move. A massive Hammer on support of the 100 week Simple Moving Average (SMA), near the neckline of the Inverted Head and Shoulders, and back in the Bollinger bands. But wait, it is only Tuesday, with three days to go in the week. What about the monthly view? From the chart below you can see that it has not moved back into the consolidation channel from the last 6

months yet. Hardly anything to get excited about. Until it can get over at least 53.50 and preferably 54.26 the trend is still down. THE TREND IS STILL DOWN. Don’t let your bias get the best of you. The indexes may move higher but right now they may also be exhibiting the old dead cat bounce. Wait for confirmation.
See the original article >>
Bookmark and Share

Financial Crisis Delivers Indirect Blow to Agriculture

by Purdue University Extension

While the uncertainty on Wall Street directly affects the financial sector, Mike Boehlje, a Purdue Extension agricultural economist, says it's the indirect consequences coupled with weather concerns that has the agriculture industry on edge.

Agriculture, with the exception of livestock, has been more resistant to recession, says Boehlje. Much of the demand for U.S. grain comes from the mandated use of ethanol and in the form of exports, which have recovered more quickly in recent years than has domestic demand.

"The Chinese economy is growing, and that has increased demand for U.S. grains, especially soybeans," he says. "We've also had short supply problems with grains."

High demand means higher grain prices. While that benefits crop farmers, livestock producers tend to suffer. More expensive grain means higher feed costs and tighter profit margins for animal agriculture.

Boehlje also says because now is not the borrowing season for grain farmers, they're unlikely to see much increase in interest rates. But because there is no real "season" when livestock producers borrow money, in the short term they could see increased risk premiums passed on in the form of higher interest rates.

While the capital markets are not to be ignored by farmers, Boehlje says the effects of the current financial turmoil are more indirect and focus mostly on demand adjustments.

"Going forward, the key concerns for agriculture are less in the capital markets and more in what the U.S. debt problems might do to put us in a recession," Boehlje says. "The Chinese economy also is important because should it take a hit, export demand would decrease."

Should the U.S. end up in a "double-dip" recession, Boehlje says there is potential for livestock producers to face higher feed costs, reduced domestic demand and lower export demand.

"A situation like that certainly has the potential to take the profitability out of livestock production," he says.

One bright spot, however, is when the markets become unstable, investors are more likely to put their money into real assets rather than financial assets. Real assets include agricultural commodities, metals and land.

"When there is long-term instability there tends to be a flight to real assets," Boehlje says. "People move away from financial assets. Agriculture is a real asset industry, so that does offer some protection."

What agriculture isn't protected from is the weather, which Boehlje says could do more harm than the financial crisis. Yield losses from this year's extreme weather could be where grain farmers take the hardest hit. While weather and yield loss have little to do with the overall financial crisis, it could play into the scenario if it results in grain shortages.

It also could cause financial problems for famers who forward-marketed crops that may not end up being produced.

From the consumer's perspective, Boehlje says oil prices have come down in the last few days, and food price increases may slow down some. Although that may seem like positive news, it might not be.

"An early response to the economic uncertainty has been a decrease in energy prices," he says. "If we go into a double-dip recession, it could take some pressure off of retail food prices, as well. But we certainly don't want that to be the reason for a reduction in price pressures."

Despite all of the seemingly bad news, Boehlje says agriculture is still a strong industry – especially relative to other industries.

"Other industries are downsizing, some even permanently," he says. "Relatively speaking, agriculture is a good place to be."

Bookmark and Share

Wheat, rice lead rebound in farm commodity futures

by Agrimoney.com

Wheat and rice led a revival in agricultural commodities as buyers stepped back into risk markets, taking advantage of the post-liquidation sale in assets such as shares and raw materials.
The revival highlighted by a rebound in the FTSE 100 index of leading London shares, which recovered from intraday losses of 4.5% to close up 1.9%, was mirrored in crop markets, where all but a handful of contracts stood in positive territory in late deals.
"Overall traders are still directly dependent on outside markets for momentum," Matthew Pierce at PitGuru said.
At Chicago-based grains broker North America Risk Management Services, Jerry Gidel said: "
"All we are is a whipping boy for the stock market. Our fundamentals are secondary to whatever is going on outside."
'Some pullback justified'
Mr Gidel added that "the better weather we have had probably justified some pullback".
Crop prices as of 18:00 GMT
Chicago wheat (September): $6.71 ¾ a bushel, +2.3%
Chicago corn (December): $6.87 ½ a bushel, +0.3%
Chicago soy: $13.02 a bushel, -0.7%
New York sugar (October): 27.49 cents a pound, +1.4% (closed)
London wheat: £160.70 a tonne, +2.2% (closed)
Paris wheat: E193.50 a tonne, +1.7% (closed)
Contracts for November delivery, unless otherwise stated
Soybeans, which face better weather for the important August pod-filling period - and for which official data overnight showed the condition of the US crop improving - remained among Chicago's losers.
The benchmark November contract stood 0.7% lower at $13.03 a bushel with half an hour's trading to go.
Corn, which also stands to benefit from better weather, nonetheless received support from its crop condition shown to be continuing to deteriorate, downgraded by two points week-on-week to 60% in the "good" or "excellent" categories. A year ago, the figure was 71%.
Chicago's December contract stood 1.7% higher at one point.
US vs Russian
But that was overshadowed by gains in wheat which, at its high, was nearly 5% higher in Chicago for September delivery.
The grain was helped by continued concerns over prospects for the quality of spring wheat in the US, and of a German crop threatened by rain.
Meanwhile, an Egyptian tender showed US wheat was nearing parity on export markets with Russian supplies renowned for their price competitiveness.
Rice gained the exchange maximum of $0.50, or 2.6%, to 17.085 cents a hundredweight for the best-traded November lot, boosted by growing concerns for the impact of heat on the US crop, and of radiation damage forcing Japan to hike imports of the grain.

Bookmark and Share

Evening markets: shares lead crop futures to gains - for now

by Agrimoney.com

Where shares led crops, broadly, followed.
(So for bulls, it was just as well agricultural commodity markets closed when they did, before the Federal Reserve's latest monthly statement, which were taken as highlighting the US central bank's limited powers to halt the shakedown.
The Dow Jones Industrial Average fell 0.3% into negative territory in late deals, although the S&P500 index remained 0.6% ahead. US crude dipped back below $80 a barrel.) See update below.
But that's getting ahead of ourselves. When Chicago and New York, let alone London and Paris, futures markets closed, the Dow was ahead.
And that was enough to let the lid off selling pressure in farm commodities too.
"The rally occurred because equity and energy bottomed temporarily after the liquidation caused by margin calls finally waned," Darrell Holaday at Country Futures said.
'The weak link'
Not that this meant that grains were shared equally. Or even that all contracts rose.
Soybeans, for instance, closed down 0.9% at $12.99 ¾ a bushel for November, the lot's lowest close, bar one, since March.
"Soybeans have been the weak link throughout the session because the weather is seen as bearish with rains moving through critical areas by the weekend and the temperatures are expected to be very mild," Mr Holaday said.
The oilseed is, in the US, in the key month for pod-setting.
"The start of August has not been as nasty as July was. And soybeans anyway have an ability to hunker down and wait for a better time," Jerry Gidel, at North America Risk Management Services, said.
Besides, the condition of the US crop actually improved, by one point to 61% in the "good" or "excellent" categories, weekly data from US Department of Agriculture showed overnight.
'Lot of anxious feelings'
That meant it was in better health than US corn, of which 60% was rated in the top two grades, down two points on the week.
That offered some support to the grain, as did the prospect of Thursday's USDA Wasde report, the latest in the influential monthly series, in which data on US yield and acreage estimates are being eagerly anticipated.
Mr Holaday said: "There are a lot of anxious feelings ahead of USDA numbers on Thursday.
"A bearish corn yield number will be quickly dismissed by the trade, but if they don't lower harvested acreage significantly then that will be seen as bearish."
Corn for December, the best-traded lot, ended up 0.4% at $6.88 ½ a bushel.
No rain on the Plains
That was way behind wheat, which added 2.3% to $6.71 ¾ a bushel for September delivery in Chicago, as speculators rushed to cover short positions.
Indeed, in Kansas, a less frequent destination for fast money, the September lot added a modest 0.9% to $7.62 a bushel.
Not that investors didn't have fundamental reason to be relatively upbeat on wheat, with the condition of the US spring crop faltering – down four points to 66% in the good and excellent categories – and continued dry weather posing questions over the autumn sowings season in the US southern Plains.
As US Commodities noted, "the weather remains non-threatening, except for the southern Plains".
'Caught the market off guard'
Furthermore, an Egyptian tender showed US export prices falling in line with ones from Russia, whose fierce competitiveness has won it approaching 1m tonnes of orders from Cairo in the last six weeks, the latest 60,000 tonnes on Tuesday.
The pricing "caught the market a little off guard", Mr Holaday said.
And, with European prices also getting nearer parity with Black Sea ones, Paris wheat was helped to a 1.7% rebound to E193.50 a tonne for November delivery.
London's November lot added 2.2% to £167.50 a tonne.
Another Brazil downgrade
White sugar managed a stonking gain in London too, closing up 3.7% at $736.30 a tonne for October delivery, and wiping out most of its losses of the past week.
The lift was in the main on the back of jumping raw sugar in New York, where the October lot soared 5% at one point after, importantly, failing to trigger 100-day moving average at 26.21 cents a pound.
Furthermore, Datagro chipped in with a downgrade to its estimate for the cane crush in Brazil's important Center South region in 2011-12 to 517.4m tonnes, down from 536m tonnes.
(For comparison, the benchmark estimate from cane industry group Unica last month was for 534m tonnes.)
Datagro forecast the region's sugar output at 31.85m tonnes, down from 33.7m tonnes.
'Every which way but loose'
New York coffee managed small gains too, adding 0.2% to 234.75 cents a pound for September, after earlier threatening to set a fresh six-month low for a spot contract.
But cotton remained out of favour.
"Technically, there are still several major technical patterns simultaneously at odds with each other," Keith Brown at Georgia-based brokerage Keith Brown & Co said, noting indicators such as the 39-month cycle and daily divergence for the December lot.
"All are collectively pushing and pulling the market 'every which way but loose'."
On fundamentals, Sudakshina Unnikrishnan at Barclays Capital noted that while the US crop was poor, "global production estimates ex-the US remain in good shape, on year-on-year gains in output from other key producers like China, India and Pakistan".
Cotton for December closed down 2.0% at 95.80 cents a pound, the contract's lowest finish of 2011.
Bookmark and Share

The Euro’s Crisis of Democracy


In the end, as always, Europe acted. But will it be enough?

Financial markets, no doubt, will be skeptical about the eurozone members’ solemn commitment that the de facto Greek default will remain the exception. Verbal assurances have been the European Union’s preferred currency in tackling the euro crisis, but words now have as little value as Greece’s sovereign debt.

It took more than a year for Europe to do what everyone knew needed to be done to contain the Greek crisis, and it still may not be enough. For the approved measures do not provide the transparent and long-term commitment to restoring Greek finances that markets want to see.

That is the nature of European politics. The EU acts only when it is pressed to the wall. And, when it finally does do the right thing, it pretends not to be doing it. The reason is that European Union politics is mostly national politics, which addresses national issues with a European dimension, but not European issues. The EU’s deep interdependence is lost in national politics, opening a gap between the scope and level of policies and where politics takes place. Europe’s democratic deficit is less a gap between European institutions and European citizens than between national politics and European problems.

Consider the very different narratives that have emerged in Europe and the United States about the financial crisis. Both in the US and the EU, some spent more than they could afford, and others granted credit that they ought not to have granted. But Americans blame irresponsible banks, while Europeans blame irresponsible southern countries like Greece.

The reason for this disparity is the scope and level of the politics under which the narratives are framed. In the US, the problem is seen as a national problem regarding the actions of banks and individuals, while in Europe the problem is seen as one arising within some states and affecting other states.

Quite simply, EU politics has not kept pace with the scope and level of the Union’s problems. This is what those who lament the EU’s democratic deficit mean. No EU member state has yet to fully internalize the consequences for their democracy of the interdependence generated by integration.

A few eurozone members’ financial troubles have become a problem for all. An immigration influx into Italy spills over into other EU countries. A wrong assessment by German authorities of the health risk posed by a particular vegetable leads to massive financial losses for farmers across Europe.

In all of these instances, national policies have had severe repercussions for other EU states. European issues were governed at a national level, and other Europeans paid the price. At the same time, because the EU is both a source of wealth creation, through market integration, and of redistributive effects among states, through competition in that market, its decisions’ increasingly majoritarian character requires some democratic notion of distributive fairness. To the extent that European issues can’t still be fully governed by European politics, national politics need to be made more European.

A credible solution to the eurozone’s current crisis depends on addressing this democratic deficit, but the crisis also provides an opportunity to do so. Reform of the eurozone’s governance must use democratic mechanisms – and the logic of the internal market – to prevent some EU states from imposing externalities on others.

But the democratic argument must also be applied to the other side of the issue: adjustment programs. Once the EU binds its aid to some states to their adoption of certain policies, it should be equally accountable for the outcome of those policies. The EU can simultaneously address the markets’ fears by making clear that it guarantees full implementation of those policies – for example, by making the ability to issue to eurobonds conditional upon it.

The EU must be made accountable not only for what it spends, but also for the wealth that it generates. It must distribute “its” money and not that of its members. The democratic argument requires a clear connection between the Union’s financial resources and the wealth that it generates, or with member states’ economic activities that have important externalities for other members.

The European Commission’s recent proposals for its own revenue sources are a step in the right direction. Any new VAT resource should be linked to cross-border transactions, establishing a clear link with the internal market. Other revenue sources could be linked to national activities with substantial cross-border externalities.

If the way that the EU raises money is made more democratic, deciding how to spend that money would become more democratic, too. This is crucial to ensuring the legitimacy of the eurozone’s economic governance.

Miguel Poiares Maduro is Professor of European Law and Director of the Global Governance Program at the European University Institute.

Bookmark and Share

Eurobonds or Bust


The eurozone’s institutional weaknesses have been laid bare. The attempt to run a common monetary policy without a common treasury has failed. Investors do not know what they are buying when they purchase an Italian bond – is it backstopped by Germany or not?

We now know that the best credit must stand behind the rest, or else bear runs, such as those that have derailed Greece, Ireland, and Portugal – and that now threaten to do the same to Italy and Spain – are inevitable. Debt mutualization alone will not save the euro, but, without it, the eurozone is unlikely to survive intact.

The eurozone’s July 21 summit was a small step forward. Leaders agreed to lower interest rates on loans made by the European Financial Stability Fund (EFSF) and they recognized that Greece’s debt burden is unsustainable. But this falls far short of what is needed to arrest the currency union’s deepening crisis. Borrowing costs remain unsustainably high for many eurozone economies – and not just those in the periphery. The economic growth potential of Spain and Italy, for example, now hovers around 1%, but their borrowing costs exceed 6%. By contrast, German sovereign yields have fallen sharply, lowering public and private-sector borrowing costs.

This is a recipe for further economic divergence and insolvency in the eurozone. To prevent this, the eurozone needs a “risk-free” interest rate. The struggling economies need lower borrowing costs, or they will suffocate economically (and political support for eurozone membership will evaporate).

Only mutualization of debt issuance can generate the low (risk-free) interest rate needed to enable these countries to put their public finances on a sound footing and lay the basis for a return to economic growth. All eurozone countries should, therefore, finance debt by issuing bonds that would be jointly guaranteed by all member states.

The obvious problem with eurobonds is moral hazard: how to prevent fiscally irresponsible countries from free-riding on the credit-worthiness of other member states. This is the understandable fear of countries such as Germany and the Netherlands.

One possible solution would be to permit member states to issue debt as eurobonds up to, say, 60% of GDP, and to require them to be individually responsible for any debt exceeding that level. This would give countries with high levels of public debt an incentive to consolidate their public finances.

Had the eurozone introduced such a system from the outset, it might well have worked. But it is too late for that now. For several eurozone economies, the additional borrowing would simply be too expensive.

A better solution would be to create a new, independent fiscal body to establish borrowing targets for individual member states, together with a European debt agency to issue eurobonds (up to a certain level) on their behalf.

How would the new fiscal rules be designed? A dogmatic target of budgetary balance four years hence, irrespective of a country’s position in the economic cycle, would achieve little: targets are meaningless if they are impossible to implement. So the rules would have to be set with reference to each member state’s cyclically adjusted fiscal position (for which the OECD already produces estimates).

Careful thought would need to be given to the composition of the new fiscal body. A board of 17 people, one from each eurozone economy, would be unwieldy, and unlikely to win the support of the eurozone’s principal creditor countries. At the same time, a board dominated by the creditor economies would be unlikely to win the backing of the debtor countries. A board of nine economists, from the big eurozone members, the European Commission, the European Central Bank, and the OECD might form a good basis.

The eurozone, of course, has a poor record of enforcing fiscal rules, implying the need for strong penalties for non-compliance. If a country deviated from its fiscal targets, it would be barred from borrowing additional funds at the risk-free interest rate. It would have to borrow under its own rating, which would be prohibitively expensive for fiscally weaker countries. To provide additional incentives to abide by the rules, the ECB could refuse to accept debt issued under national ratings as collateral. Alternatively, a new EU financial regulator could handicap own-country bonds by requiring banks holding them to set aside more capital.

Fiscal rules of the type envisaged (and a new body to enforce them) would not necessarily require a treaty change. And, while various creditor countries rightly fear that eurobonds would push up their borrowing costs and constitute a transfer union, opponents might eventually come around to seeing eurobonds as the least bad option. The risk is that, by then, it could be too late to save the euro from a partial break-up: what might work if adopted promptly could be ineffective if adopted in six months.

For core countries, eurobonds would certainly be a cheaper option than underwriting loans to struggling member-states, which essentially means throwing good money after bad. They will book large losses on EFSF loans, and those losses will be even larger if, as seems possible, some of the borrowers end up leaving the eurozone and defaulting on their debt.

Simon Tilford is Chief Economist at the Center for European Reform.

Bookmark and Share

Should We Trade Oil Like It’s 2008 All Over Again?

by Guest Author Andrew Butter

I suspect that even the most sophisticated student of Econ-101 would concede that the trajectory of the price of oil in 2008 was a bubble and that 2009 was a bust.

However, no one has come up with a convincing theory for what it was that pumped up the bubble or what finally popped it, outside of the old favorites such as…the insanity of crowds, terrorist plots, and Goldman Sachs.
Follow up:
 
The dynamics of the price in 2011 are eerily similar to what happened then:
 

I have argued previously (a) the “correct” price for oil at this juncture his about $90; (b) that according to Farrell’s 2nd Law the bust will be a mirror of the over-pricing at the top of the bubble…127/90 = 1.41…so the bottom of the bust will be…90/1.41 = $64; (c) the main cause of blowing the bubble in 2011 was the conflict in Libya (d) the “pop” was going to happen on 30th April 2011.

Let’s see what happens next.

Reflecting on the cause of what appears, at least from the current perspective, to have been a bubble and a nascent bust, was probably a combination of the “normal” trigger of too much easy money floating around, combined with the start of the Libyan crisis, exacerbated by the practice of pricing oil on indexes.

That there was easy money, there is no question, although cause and effect was not established in 2008 and not in 2011 either. My guess for the dynamics of how Libya affected the market is as follows:

The start of the conflict took out a (relatively small) component of supply, but it was a special sort of ultra-light oil used mainly by European refiners.

Refiners can’t easily change the grade of their feedstock, so those who were set up to process Libyan oil were obliged to go to the spot market to buy, and since they were European, and Brent is light oil, that’s where they went.

So, the result of supply and demand was that Brent went up.

What happened next is an example of how indexes can mislead the market. We look at three things:

Brent accounts for less than 1% of all the oil pumped in the world;

Everyone says they follow their own index (WTI, Argus etc), but the reality is that everyone looks over the other guy’s shoulder.

Most oil (and many gas) contracts are linked to an index, so if you buy a couple of super-tankers of oil, the price you pay on delivery is a multiple of an index, with the multiple being determined by the specific quality of the oil.

Thus, if Brent goes up, that can pull up WTI and Argus, and the whole world pays more for oil.

When the Saudi’s correctly noticed that oil was a bubble starting in March 2011 and (they say) they offered up 800,000 barrels of oil a day to replace the lost Libyan oil, they couldn’t find any buyers; that’s because it was the wrong type of oil.

Why Saudi Arabia would want to play “fairy-godmother” is of course another question. A cynic might well say selling more at the top and less at the bottom, is a good strategy (it is). A less cynical view is that wild swings in price around the “correct” price doesn’t do anyone any favours except for the speculators who time the swings correctly. The problem is pointed out in the fundamental Law of Bubbles: Speculations are zero-sum and for every winner there has to be a loser. In sustainable economic structures, in most transactions, both sides are winners.

We are in a period of history where governments appear to the casual observer to be peculiarly preoccupied with petty internal squabbles and lining the pockets of the players, whilst missing the Big Picture. They are preoccupied with borrowing huge sums of money so they can play Rambo. It is curious that the Saudi’s come across as about the only “grown-ups” around.

Perhaps it might be a good idea to give them a seat on the UN Security Council and kick out France and UK, and replace those two mini-Rambo states with a chair for the EU. (Errrr…perhaps not, if the EU was on board nothing would ever get decided.)

Equally important, the oil released from the SPR (Strategic Petroleum Reserve) when had little (or no) effect because it got sold at auction, outside of the indexes. If a much smaller amount of oil had been surreptitiously leaked into the Brent market (what a naughty-naughty idea), that would have made a much bigger difference (for a lot less investment).
So short term, it looks suspiciously like the “market” lost sight of the “fundamental” supply/demand balance again. (It’s not the first time).

But markets will be markets; they oscillate around the equilibrium, which confusingly changes over time. My estimate of $90 Brent as my guess of the equilibrium may be high if (a) economic activity in the world was affected by the price of oil (which translates into food prices, and business margins - case in point airlines), and (b) the extraordinary spectacle of the dysfunctional US Government throwing it’s toys out of the pram (again), translates into a recession.

See the original article >>
Bookmark and Share

Wilshire 500 is down ...

by Kimble Charting Solutions


See the original article >>
Bookmark and Share

Safety Stocks: Three Ways to Profit From Market Mayhem

By Jason Simpkins

There's never been a better time to invest in "safety stocks."

The Dow Jones Industrial Average is down 14% since July 22 and the Standard Poor's 500 Index is down 15% in that time. The U.S. economy is grinding to a halt, and a double-dip recession could be in the offing. Meanwhile, the U.S. Federal Reserve continues to undermine the dollar with expansive monetary policy.

Indeed, with so much bad news and chaos, there's never been a better time to stock up on the essentials - gold, guns, and cheap food. These are the things people turn to when the going gets tough - and the companies that provide these bare necessities shine the brightest when everything else seems to be falling apart.

That said, here are three safety stocks that are worth a look:

  • Newmont Mining Corp. (NYSE: NEM).
  • McDonald's Corp. (NYSE: MCD).
  • And Sturm, Ruger & Co. Inc. (NYSE: RGR).
Let's examine each in a little more detail.

Newmont Mining Corp.

Gold has been the can't-miss profit play of the past three years.

The yellow metal settled at yet another record high yesterday (Tuesday), surging 1.7% to $1,743.00 an ounce on the Comex division of the New York Mercantile Exchange (NYMEX). And Money Morning Contributing Editor and global resources specialist Peter Krauth says it could more than double from there.

"I expect gold to reach $5,000 before this bull market peaks," said Krauth. "I'm very open to the possibility that gold could correct from here, but I'd expect that to be nothing more than a short-term pullback."

Indeed, developed nations' debt problems remain unresolved and the Fed's monetary policy continues to weaken the dollar, making the outlook for gold very bright.

That's good news for Newmont Mining Corp., which has 93.5 million ounces of proven and probable gold reserves. The company generated nearly $10 billion in revenue and gross profit of $6 billion in its trailing 12 months.

Newmont's stock price does not yet reflect its true value, as the company has a Price/Earnings (P/E) ratio of just 11.27. But what's even better is that Newmont is pegging its dividend payout to the price of gold.

For instance, gold settled last Friday at $1,659 an ounce, leaving the dividend at 30 cents a share. But at Monday's record high price of $1,718 an ounce, the dividend jumped to 35 cents a share. The stock currently yields about 2.2%, but you can expect that to rise, and rise quickly, as the price of gold continues to soar.

McDonald's Corp.

McDonald's Corp. is the quintessential "recession-proof" stock. It's a huge company that's very active globally. It's made a big splash in fast-growing emerging markets - particularly in Asia - and hard economic times make its affordable menu even more appealing.

The company's same-store sales increased 5.1% in July. Sales were up 5.3% in Europe, 4% in Asia, and 4.4% in the United States.

McDonald's reported a second-quarter profit of $1.41 billion, or $1.35 a share, up from $1.23 billion, or $1.13 a share, a year earlier. Revenue jumped 16% to $6.91 billion.

A strong global brand, low prices, and growing revenue were enough to land McDonald's on Goldman Sachs Group Inc.'s (NYSE: GS) prestigious "Conviction Buy" list. The firm set a $96 price target on MCD, which suggests an 11% upside to the stock's Monday closing price of $82.11.

Goldman noted it sees a total potential return of 20% for the stock when including its dividend.

McDonald's stock is up 10.5% year-to-date, compared to a nearly 10% decline for the S&P 500.

Sturm, Ruger & Co. Inc.

Finally, there's Sturm, Ruger & Co. - the firearms manufacturer that's blowing away the competition.

Sturm Ruger's net income rose 32% to $10.8 million, or 57 cents per share in the second quarter. The company also is raising its dividend and buying back shares - two hallmarks of a good company.

Ruger has raised its dividend twice lately -- most recently when the company announced earnings on July 27, 2011. The new dividend rate is now 56.8 cents per share on an annualized basis. This brings the current yield to about 2.3%.

Meanwhile, the company bought back 133,400 of its 18.9 million outstanding shares in the first half of 2011. Those purchases absorbed $2 million; another $8 million in authorized purchases remain.

Ruger's large cash stockpile made all of this possible. The company had cash and equivalents and short-term investments of $76.5 million as of July 2.

The stock is up nearly 77% in the past year, compared to the S&P 500, which is flat.

Bookmark and Share

How to Bank Triple-Digit Gains During a Stock-Market Sell-Off

By Kerri Shannon

Monday's stock-market sell-off was a frightening affair that sunk 94% of the stocks listed on the New York Stock Exchange (NYSE). Every single stock in the Standard & Poor's 500 Index fell, and the 635-point freefall experienced by the Dow Jones Industrial Average was its sixth-largest point drop ever.

But in the face of this bloodbath, subscribers to Shah Gilani's Capital Wave Forecast were treated to gains of 456%, 455%, 371%, and 197% on four of their holdings.

Just how did Gilani manage to engineer four triple-digit gains in the face of a near-market meltdown?

He predicted reversals in both the U.S. and Chinese financial markets, employed a "put" option strategy for insurance - and then watched as his predictions came true.

"If I'm going to buy insurance, I want the best insurance at this price," said Gilani, a retired hedge-fund manager who is also a respected expert on the global financial crisis. "Part of a good cost-structure analysis is timing, which is tough. So I polished my crystal ball and said: ‘If something bad were to happen, when would that be?' I decided August, and chose some lesser-expensive puts."

Gilani's plan paid off with these four winners:

  • A 455.56% gain from Goldman Sachs October 2011 $85 Puts (GS111022P00085000), bought June 3 for 45 cents and sold Aug. 9 for $2.50.
  • A 455.24% gain from SPY August 2011 $115 Puts (SPY110820P00115000), bought for $1.05 on June 10 and sold Aug. 8 for $5.83.
  • A 371.26% gain from FXI $40 August 2011 Puts (FXI110820P00040000), bought May 10 for 87 cents and sold Aug. 8 at $4.10.
  • And a 196.72% gain from QQQ August 2011 $50 Puts (QQQ110820P00050000), bought June 10 for 61 cents, and sold Aug. 8 for $1.81.


"The days of putting together a portfolio and sleeping on it are over," said Gilani. "You could wake up to its value cut in half. Vigilance is the order of the day." 

How to Make Money When Markets Crumble

Gilani's biggest gain came from a huge bet against banking powerhouse Goldman Sachs Group Inc. (NYSE: GS).

"It's known as ‘Fortress Goldman' - strong balance sheet and unprecedented earnings - but it's not immune to what's happened to other banks," Gilani said. "Others are just a little more obvious and get a little more press. If you look under the hood, it has problems like everyone else - you just have to dig a little deeper because they hide them better."

Gilani on June 3 advised his readers to buy Goldman Sachs October 2011 $85 Puts (GS111022P00085000) for 45 cents each. At the time, Goldman Sachs shares were trading at about $135 a share. By Monday, the stock had tumbled to $117.66. That gave Capital Wave investors the chance to sell their put options yesterday (Tuesday) Aug. 9, for $2.50 a piece - resulting in a 455.56% gain.

Capital Wave subscribers also reaped a big payday on Gilani's prediction that the U.S. stock market would experience a major reversal. As investors enjoyed the bull-market run this spring, Gilani braced for what he believed was an imminent decline.

"I thought it was too good to be true," Gilani said. "I thought, ‘Something's got to give.' When things look too good, and you're questioning why things look so good - it's time to buy insurance."

Gilani protected his long positions against a market reversal buying puts on the SPDR S&P 500 ETF (NYSE: SPY).

Playing a drop in the S&P went against some of Gilani's long positions, but the increasing odds of increased market volatility meant it was time to play defense.

"We were adding to our long positions, because the markets looked strong, but that's the price you have pay, going against other holdings," said Gilani. "And when they pay off handsomely, you're still in the game."

Gilani's decision to stock up on SPY August 2011 $115 Puts (SPY110820P00115000), which cost $1.05 each on June 10, led to a 455.24% gain when those options were sold Monday, Aug. 8, for $5.83 each.

But that still wasn't enough.

Gilani also bet against the Chinese markets with puts on the iShares FTSE/Xinhua China 25 Index ETF (NYSE: FXI).

"China has been tightening policy as it works to slow down its economy. And the government has had that effect - it has technically cooled," he said.

Gilani had his subscribers acquire FXI $40 August 2011 Puts (FXI110820P00040000), bought May 10 for 87 cents. Those options were sold Monday for $4.10 a share, leaving investors with a 371.26% gain.

Finally, Gilani also correctly forecast a tech-sector cool-down, which is why his fourth pick was a bet on a drop in Nasdaq-100 Index. Here Gilani exploited the PowerShares QQQ Trust (Nasdaq: QQQ), which tracks the Nasdaq 100.

"QQQ was a little overbought, technology started weakening, so I thought the Nasdaq would get hit hard," said Gilani.

Gilani on June 10 told Capital Wave subscribers to buy QQQ August 2011 $50 Puts (QQQ110820P00050000) for 61 cents. Those puts were sold on Monday for $1.81 each - a gain of 196.72%.

Turn Panic Selling Into Profit Making

Gilani has a long record of making bold predictions that come true. In July 2008, for instance, when crude oil was trading at a record high of more than $145 a barrel, he predicted that the "black gold" was destined for a major fall - even though many pundits were calling for prices to spike as high as $200, $250, $300 and even $500 a barrel.

Gilani made the correct call.

Later that same year, in the depths of the global financial crisis, Gilani told Money Morning readers about five looming "aftershocks" that could lead to major profits. Each prediction came true.

Gilani has been able to do this time and again for one simple reason: He understands the power and profit potential of the global financial market's "capital waves."

In fact, that's his secret.

"You have to look at the big picture - which is so large because the world is so interconnected," Gilani said. "To create positive returns with measured risk, you have to focus through the noise. You can't look at the markets just as the markets. Everything isn't always as it appears. You have to look at how everything is connected."

Ignoring the "noise" is a challenge during the best of times. But during a period of great uncertainty - like the one investors face now - the task can seem impossible. That's why so many investors retreat to the sidelines.

But the investors who succumb to such fears are missing out on the biggest opportunities.

That's why, instead of exiting markets totally, Gilani suggests a little more self-education, starting with a look at the global capital waves.

"It gets very muddy when you have a lack of direction and you're trying to see what's coming," Gilani said. "We've had a lot of swirling undercurrents that could pull money in more than one direction. So in the Capital Wave Forecast we have to look at how everything is connected, patterns or structures coming together or coming apart, the differences shaping up between markets, and then try to measure whether capital is moving in or out of sectors, and where it's going."

To learn more about the Capital Wave Forecast - and the next macro-shift Gilani is anticipating - please click here.

Bookmark and Share

Country Stock Market Performance Year to Date

by Bespoke Investment Group

Below we highlight the year-to-date performance of the major equity indices for 78 countries (in local currencies). Just a few weeks ago, the majority of countries were in the black for the year, but as of now, just 10 out of 78 are in positive territory for 2011.

While things have been horrendous here in the US, they have actually been much worse in other parts of the world. In fact, the S&P 500's YTD performance of -6.77% is better than all other G7 and BRIC countries. Canada is the second best performing G7 country year to date with a decline of 9.92%. Italy ranks last with a decline of -22.07%.

Out of all 78 countries, Venezuela ranks first in 2011 with a gain of 42.57%. Finland ranks last with a decline of 31.3%. Of the BRIC countries, Russia ranks first with a decline of 9.31%, while Brazil ranks last with a decline of 26.19%. China, which had been one of the weaker performing countries in 2011 up until just a few weeks ago, is now one of the better performers with a decline of 10.04%. India, the final BRIC, is down 17.8% year to date.


Bookmark and Share

Gold Rally Nearing Exhaustion?


As of this morning, spot gold was trading at $1752.20, down nearly $30 from its new high at 1781.50. This morning marked the second consecutive BIG up-gap (higher) open after the SPDR Gold Shares (GLD) challenged its upper channel resistance line at 162.50 (discussed in last Friday's 8/05, 3 PM chart posting). 

This has the "right look" of a parabolic, blow-off type of price move. Usually the first up-gap represents the breakaway (initiation) portion of the blow-off, while the second up-gap represents the continuation of the center thrust of the blow-off price move. After the extension of the upmove beyond the second up-gap open, things typically can get a bit tricky for the holders of long positions, especially in the absence of additional bullish catalysts to perpertuate the upmove (in corn or soybeans, for instance, new weather reports that project continued hot temps, and draught conditions).

Barring additional bullish perceptions based on headlines, events, etc., the inflated, very crowded long position starts to come in, and if it presses into the second gap area, could trigger long liquidation by the folks who were late to the party.

So far today the SPDR Gold Shares (GLD) has come in a bit further, which has completely closed this morning's up-gap (167.81- 170.15). Now it will be very interesting to see how the GLD behaves heading into the FOMC statement, and then how it closes. If it closes beneath 167.80, then my work will register initial near-term signals that the upmove is exhausted for the time being. 


Bookmark and Share

Social Media Poster


Bookmark and Share

Here Comes Stock Market 2008.2: My 5 Canaries


I’ve been telling friends and family the past couple of months that 2008.2 is coming, and it may have started with the recent sell off in the stock market.
I have 5 things (Canaries) that I’m listening to too, to let me know we are in serious economic trouble, where the economy and stock market could have another period like 2008 or worse.

Collectively, I think my 5 canaries are a simple look at future economic health, major stock market components, and the appetite for risk. What else do you need to know? It's really as simple as that for now, and here are my 5 canaries:

Copper: The first Canary is copper. It’s an economically sensitive metal that usually does well during good times and bad during difficult times. Below is the monthly chart of copper. What you’ll notice is the massive divergences in price compared to the MACD and RSI with price and the MACD about to roll over.

Why is this important? We had the very same divergences on the monthly chart of the stock markets in 2007 before they sold off. And, if copper is going to go through that kind of sell off based on divergences, shouldn’t we expect a horrific economy with it? Yes.


Retail: Too much of the US economy is tied to retail spending and not one thing has really improved on the Main Street economy. In fact: Will This be a Problem? US Is at the Start of 500-Day Retail Recession: Analyst . If that is the case, wouldn’t you expect the retail index to sell off first as a forward looking discounting mechanism? Yes.

Below is the weekly chart of the retail index. It’s tried very hard to make a new high in price over the 2007 highs. But in so doing that it has formed a broadening wedge top pattern. That’s bearish. Price has failed at the 2007 price highs. That’s bearish. Now price has broken below the bottom wedge line. That’s bearish.

The retail index is providing that early warning sign you would expect prior to a 500 day retail spending recession. If retail is going into recession, how do you think the rest of the US economy will do?


IBM: This company is almost 9% of the weighting in the Dow Jones Industrials. It’s the largest component by a mile. If IBM is going to have a large correction, do we not have to assume the rest of the stock market will too? That seems logical.

Below is the monthly chart of IBM and guess what? There are those divergences forming again on the monthly chart much like copper, and the stock markets back in 2007.

If price breaks down and the MACD rolls over, we should be into a correctional phase of size for IBM, which should put pressure on the US economy and the stock market. If all we do is fall to the second uptrend line, that's a very large correction and big pressure on the entire market.


JNK: The junk bond market has correlated well with the stock market from the 2009 stock market bottom. It has served as the risk on or risk off indicator. When it’s rising stocks have done well and indicates an appetite for risk. The complete opposite seems to hold true as well.

Unfortunately, JNK has not been around that long so we have limited charting time frames to work with. However, on the daily chart below we see it is breaking down. A continuation of a price break down in JNK is a continual confirmation of the risk off trade, which indicates stock market weakness, which indicates economic weakness to follow.


AAPL: Apple is to the NASDAQ as IBM is to the Dow Jones Industrials. With a break down in AAPL I would expect a break down in the NASDAQ.

Below is the monthly chart of AAPL. There are no divergences on the MACD, but we have one on the RSI. We have 5 waves up, and if that Elliott Wave count is right, then we should expect a sell off back to the prior 4th wave at $75. A more conservative sell off would be back to cluster support where we have the uptrend line, the 50 month MA and lower BB in a tight zone around $200-250. In either case, a selloff in AAPL of size to those levels should put immense pressure on the market.


The Bull View: To give equal time to the bulls, the $SPX needs to trade above 1,250/60 to regain a bullish technical structure. That’s not my view, but if it happened in the coming months then the bulls could cheer once again.

Otherwise we need to review the bearish indicators above:

The Bearish View:

Copper: on the verge of a major divergence roll over. That would be bearish.

Retail: has already broken down on the weekly chart from a topping pattern. That is bearish

IBM: Following copper with a divergence forming. That would be bearish.

JNK: Continues to break down with the stock market: That is bearish.

AAPL: might be on the verge of a MACD and price roll over and break down: That would be bearish.
Here comes 2008.2

Like canaries in a coal mine, my 5 canaries are starting to go silent. We are at critical junctures for IBM and AAPL. Retail has already broken down. And copper is very close. If the Canaries continue with the bearish theme I expect 2008.2 is just around the corner. It should be and feel every bit as bad as 2008 if not far worse in many cases.

I do expect a bounce in the stock market coming. That bounce might hold the key to the puzzle. If the bounce can regain 1,260 on the $SPX then the bulls have regained the market. I personally don't think that happens though. If that bounce fails and my 5 canaries continue downward, we could be on crash and deflation alert.
Risk/Reward

It's seems like the market went up on the back of big institutional buying and it's going down on big institutional selling. This market has too much risk in it for most individual investors. Individual investors need to revisit their wealth strategy and try to save what they have during the pending 2008.2.

It's not about whether you can make money, but rather not loosing what you have and does the risk of being in this market fit you! We exited our last two longs a day before this selloff because the market didn't look like it could push higher. I wasn't expecting this sharp selloff now, but it is what it is. Investors should become defensive in nature. If we get the bounce I'm looking for, that might serve as the opportunity to exit the market, but you should have some plan in place to protect what you have.

Bookmark and Share

Follow Us