Wednesday, February 23, 2011

Gold $2,300, Silver $150 and Looming Stock Market Crash


Notes from the Cambridge House Silver Summit - Cambridge House puts on some of the best commodity-focused investment conferences in the industry and this year was no different. The February show in Phoenix, Arizona included presentations from industry heavyweights such as Ted Butler, Bill Murphy, Jay Taylor, Mickey Pulp, John Kaiser and others. Over 40 booths were filled with up-and-coming junior resource miners, including one of my favorite silver plays, Aurcana Corporation (CVE: AUN or AUNFF). Aurcana stock advanced as much as 19% today, the first trading session following the conference. Aurcana just began construction on their Shafter mine in Texas, which is estimated to be one of the top ten largest silver mines in the world. In addition the company is already producing one million ounces from its La Negra mine in Mexico and is projecting a jump to 5 million ounces per year once Shafter comes online. 

I gave a 30-minute presentation to a packed room of investors and also sat on a panel with some of the world’s foremost experts on precious metals investing. My presentation focused on why precious metals were nowhere near a top and offered arguments for much higher prices in both gold and silver. 

As a subscriber to this site, you are probably already aware of these key underlying factors that will continue to drive the prices of gold, silver and most commodities much higher. They include the record $1.65 Trillion deficit this year, unsustainable debt levels, central banks becoming net buyers of gold for the first time in over 20 years, Chinese consumer demand, a shift from paper to physical ownership, supply shortages and growing calls around the world for an end to the dollar as world reserve currency. 

I will be speaking again at the Vancouver conference in June, which is much larger than the Phoenix version. In the meantime, here were some of the key takeaways and top stock picks that I gleaned from the conference.

Gold and Silver Nowhere Near a Top

Most speakers agreed on a price target around $1,800 gold and $50 silver by the end of 2011. Furthermore, analysts and newsletter writers were forecasting that gold would eventually reach $3,000 at a minimum, with many discussing the fundamental reasons that gold will reach the $6,000 level. Similarly, experts were predicting silver would easily climb to $150 and could hit as high as $1,000 per ounce before the current bull market is over. Those are lofty numbers, but give you some perspective of just how early in this bull market we might be. The inflation-adjusted highs range dependent on which statistic is used – the official government statistic or the more realistic estimation made by John Williams at Shadow Stats. Here are the inflation adjusted highs: 


If the inflation-adjusted highs don’t drive home the point enough, here is a chart from Casey Research showing the percentage gains in gold and silver now versus the gains during the last bull market. From 1971 to 1980, silver climbed 3,646% versus only 596% during the current bull market. Silver would need to hit $160 in order to have a similar gain to that of the last bull market. Gold climbed 2,333% during the past bull market versus just 430% during the current bull market. Gold would need to reach at least $6,227 to register a similar gain to that of the last bull market.


The key takeaway from this data should be obvious… gold and silver are nowhere near a top in this current bull market. Furthermore, the fundamental conditions that drove the past bull market in precious metals are even more severe today. Gold and silver should not only match the advances of the last bull market, but should surpass them handily. 

For example, let’s take a look at the debt situation now versus the 1970s/80s. Gross debt has gone parabolic since 1980 and we have added more debt in the past few years than in the previous 100 years combined!


Similarly, the debt-to-GDP ratio in the 1970s was around 35 and is now approaching 100. With the record $1.65 Trillion debt projected this year and weak GDP growth, the U.S. debt is projected to reach 100% of GDP in the next few months, a level not seen since World War II. 


But another consideration when trying to determine how high gold and silver might go is your measuring tool. It is less important to understand how high prices go in dollar terms than to understand the value of gold in terms of the things you need in life… energy, food, shelter, etc. So, while precious metals might go up hundreds or thousands of percentage points against fiat dollars, the true value comes in knowing that you will be able to maintain or even increase your purchasing power of key items over the years. 

Double-Dip Stock Market Crash Looms

The S&P 500 has doubled from its bottom to return to pre-crash levels. There have only been a few times in history when the stock market has doubled in just two years and they came off severely overbought conditions. Most technical analysts are pointing to overbought conditions. So, the astute investor has to consider whether 2009 prices were really severely oversold and whether the underlying fundamentals of the economy justify the doubling we have witnessed in the past two years. 


While it is true that we’ve had unprecedented levels of quantitative easing and stimulus programs, most of that money went to the banks and is either parked in excess reserves collecting interest from the FED or has been paid out in record levels of bonuses. Only a small percentage went into circulation and into the hands of those that would actually need to spend it. An even smaller percentage went into the hands of those that create real jobs in manufacturing, energy and elsewhere. Our nation’s wealth, both financial and intellectual, has been handed over to a bunch of exploitative assholes that create nothing of true value to society. Oh yes, I am talking to you Mr. Bankster. You know where you should be sitting

While the country’s debt and deficits are exploding off the charts, unemployment remains high, food stamp participation is at record levels, foreclosures persist and industrial output is sluggish. There is a huge and glaring disconnect between the gains on Wall Street and the desperation on Main St. There is no organic or sustainable growth, only QE and manipulation. It is working in the short term, but as soon as investors panic and confidence sinks, stocks are going to crash even more severely than in 2008. 

Cautious optimism seemed to be the underlying theme connecting the different presentations at the Cambridge House investment conference this past weekend. There is an uneasiness about how far and how high the stock market has charged in the past year. One broker told me that he thought cash was the best place to be at the current moment, even while acknowledging the 5-10% loss that would be taken annually via inflation.
My takeaway is that we should not get too complacent with the incredible gains experienced recently. The extreme bullishness and investor complacency should be viewed as a contrarian indicator and caution is advised. This does not mean to short the market, as the manipulation could keep stocks grinding higher for a while longer. But it does mean to watch your positions closely or tighten your stops so as to avoid huge capital losses should another major sell off occur. 

Downside protection can be found in the form of various inverse ETFs that go up when the market goes down. A few of my favorite ways to hedge my portfolio and profit during down dips include EDZ and FAZ. If I am holding for a time horizon longer than a few months, I look to short EDC or FAS, as the ultrashort funds suffer from long-term decay. Either way, it is important to have a strategy that will protect your portfolio and even provide you with profits to offset the declines you might face in core positions during the upcoming double dip, should it occur. 

Have an End Game in Mind

One interesting recommendation that is far too often overlooked is to know your end game. Owning precious metals as a way to hedge against inflation, protect your assets and even increase your wealth and purchasing power is a solid strategy. However, most gold bugs have yet to consider their end game. When gold and silver go parabolic and mainstream investors create a blow-off top, what are you going to do with your metals? 

As hard as it might be to imagine today, there will come a top in precious metals and time when other assets will become more attractive. How will you know when to sell and what will you be willing to sell for? Where do you move your wealth after you have sold your precious metals? We might be a few years away from having to deal with this question, but it is a critical one nonetheless and deserves your attention.

As a cycles investor, I will be looking for the beginning of the next bull market cycle in another sector. My choice will likely be real estate, although it is hard to foresee what opportunities might develop between now and then. Regardless, I believe that real estate is nowhere near a bottom yet and will be likely to bottom around the same time that precious metals hit a top. If this thesis is true, investing in gold and silver now and transferring those assets into real estate when the cycles cross will yield many times more real estate for your money. As real estate prices continue lower and precious metals prices continue higher, we are likely to get to the point once again where a single-family median home can be purchase for less than 1,000 ounces of silver. Do you have your 1,000 ounces yet?

If we are lucky enough to catch the start of the next bull market in real estate, our wealth will continue to grow until it is time to sell real estate and move wealth into the next bull cycle in another asset class. Or perhaps you want to invest in education, start your own business or blow your newly-acquired wealth on travel or partying. Maybe you believe precious metals will never hit a top and will continue increasing in value indefinitely, in which case you will hold most or all of your metals. But the point is to know your end game and have a plan for exactly what you will do when prices spike to obscene levels and finally peak. 

The Yukon and Prospect-Generators Heat Up

This year’s conference had plenty of talk about the Yukon. Those of you tracking junior gold miners have probably heard stories about the notable discoveries in the Yukon and the story of Shawn Ryan, who has been systematically staking claims in the search for the “source rock” for all that gold that was panned from the Yukon’s rivers in the first gold rush. Although significant amounts of placer gold was found in the nearby creeks and streams, they apparently never found the huge underground deposits that birthed all of those nuggets. Shawn Ryan lived in a tin shack for years before uncovering the so-called White Gold district and many believe he has now found the source of all the placer gold.


Miners have been working with Shawn Ryan and others to find some very promising deposits in the area. A few of the Yukon miners mentioned at the conference by newsletter writers and others analysts include:
Northern Tiger Resources (CVE: NTR)

Tarsis Resources (CVE: TCC)
Kaminak Gold Corporation (CVE: KAM)
Silver Quest Resources (CVE: SQI)

Out of respect to paying subscribers, I have left out my favorite junior Yukon stock, a Columbian miner that just hit high grades and an extermely undervalued Nevada junior that is going into production this year.

Powerful Spike in Crude Oil


Crude oil's upside pivot reversal off of last week's low at $83.85 has morphed into a powerful spike that has climbed above the prior high of $92.84 to a new, post-Dec 2008 high at $99.94 today.

The explosive upmove has blown through key resistance at $90.15 -- the 50% resistance plateau of the huge $114.87/bbl bear market from July 2007 to Dec 2008. It has hurdled key multi-week resistance at $92.30/90 into what looks like a vicious new upleg that could be heading for a confrontation with the upper channel resistance line, now up near $110.50 to $113.00. 

At this juncture, only a major downside reversal that breaks and sustains beneath $92.00 will begin to compromise the developing vertical surge in oil prices and the U.S. Oil Trust ETF (USO).

Continue reading this article >>

NEXT STOP: $200 OIL?

by Cullen Roche

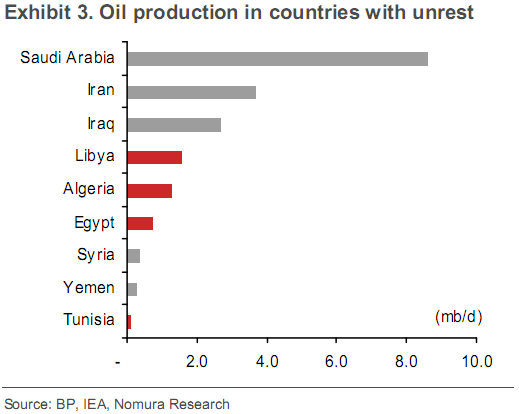
Nomura has a very good piece on the current situation in the Middle East and the risk of oil rising to $200.  While Libya is a big player in the region the ultimate scare would come from any disruption in Saudi output. As you can see they are by far the largest player in the region:
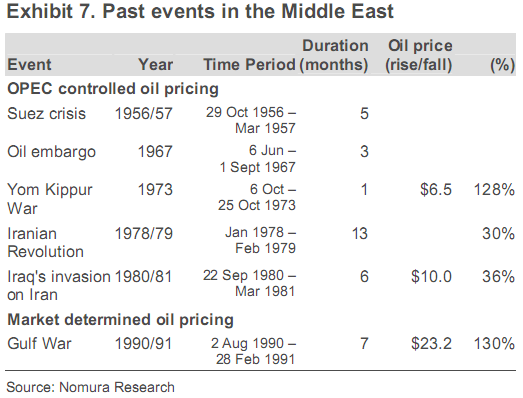
Nomura reviewed past oil disruptions in an attempt to gauge the potential outcome here:
In order to estimate the possible impact MENA crisis has on oil supply and prices, we analyse the past crises that have rocked the region. There have been a few events that drove oil prices higher, most of which are during the period in which OPEC controlled oil prices. For example, during the 1973 Arab-Israel war, OPEC increased oil prices by US$6.5/bbl or 128%, while in 1979-1981 the Iran revolution followed by
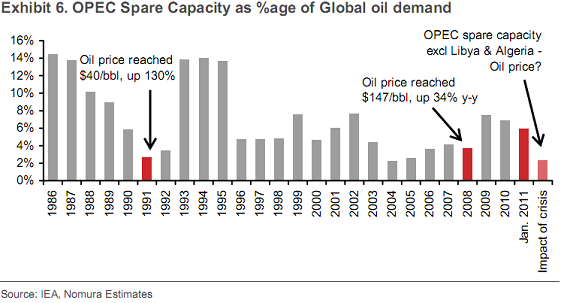
the Iran-Iraq war saw oil prices move up by about 77%. In fact the only major event that is comparable is the Gulf War in 1990-91 as it is the only event in the Middle East which seems close to the ongoing crisis during the free-market pricing era. Before the Gulf War, OPEC spare capacity stood at 5.9mmbbl/d. During the war, OPEC production capacity was severely reduced (OPEC spare capacity came down to less than 2.0mmbbl/d) and oil prices jumped 130% in a period of two and a half months.

We can identify three distinct stages of the Gulf war which led to changes in oil prices. The initial phase is the anticipation of war and just the threat to oil supply; during this period, oil prices moved up by 21%. This is comparable to what we have seen recently – oil price is up by 13% since the beginning of the MENA unrest and we believe we are still at the initial stage of the three stage process for the current MENA unrest. As we see further evidence of real supply disruption, we will be moving into stage 2 of the event. The second stage is the actual reduction in oil supply when the Gulf war started and during this period oil price moved to its peak of US$41/bbl, up 109% within a period of two months. The third stage will mark the end of the crisis with the anticipation that supply will resume and during the Gulf war, prices returned back to pre-crisis level (below US$20/bbl) in three months.
One of the concerns today is that spare capacity is fairly high.  That means OPEC is unlikely to add supply to the market despite the disruptions.  This was confirmed by CNBC today who says that OPEC has no intentions of raising supplies:
Current OPEC spare capacity sufficient to ward off immediate supply concerns: Currently, OPEC spare capacity stands at 5.2mmbbl/d with 3.5mmbbl/d of that coming from Saudi Arabia. As a result, we believe that there is enough spare capacity available in the OPEC to ward off any near-term supply disruptions owing to the crisis as it stands currently. However, we could see a spike in oil prices in case supply is actually disrupted, given the uncertainty that it would bring.
If Libya and Algeria go offline, one can see a 3.1mmbbl/d of reduction in production capacity pushing spare capacity again to 2.1mmbbl/d, as seen in 1990-91. Even in 2008, when oil prices reached US$147/bbl, OPEC spare capacity was as low as 2.3mmbbl/d in June 2008, causing prices to spike a month later. Based on the Gulf War, coupled with the fact that demand is much higher now, leaving a lower spare capacity as % of demand, we estimate oil could fetch well above US$220/bbl, should Libya and Algeria stop production. We could be underestimating this as speculative activities were largely not present in 1990-91.
Past events show one disturbing similarity – they tend to persist for several months.  If so, we are almost certainly closer to the beginning of these events than the end:
Nomura concludes that $200 oil is a very real concern in the near-term:
If the situation in the region were to worsen in a way that it encompasses other oil producing countries as well in the future, the oil supply-demand balance could change very rapidly. In particular, if the crisis were to spread to Saudi Arabia, (possibility of which is quite low at present according to our Senior Political Analyst Alastair Newton), there can be real threat to global oil production, the impact of which is impossible to ascertain on prices. In addition, the recovery in Middle East oil production would depend upon the extent of damage to oil infrastructure during the crisis and the extent of restoration of stability. Overall, we do not rule out the possibility of oil prices touching record highs in excess of US$200/bbl in the near term, should the MENA crisis continue to spread over the coming weeks.

2011: The Year of Energy Stocks (so far)

by Bespoke Investment Group

With a gain of 3.72% year to date, the S&P 500 has seemingly done pretty well.  But unless you have been overweight the Energy sector, chances are you're underperforming.  As shown below, the Energy sector is up 14.58% so far in 2011, which blows away the other nine sectors.  Only two other sectors are outperforming the S&P 500 as a whole (Technology and Industrials), but they're outperforming by less than 4 basis points! 

Coming into 2011, there was a lot of talk about this being a year where "stock picking" would be very important in order to achieve outperformance.  Hopefully you picked Energy stocks!


Continue reading this article >>

The Fastest Doubling of the S&P 500 Since the Great Depression!


Since its low in March 2009 the S&P 500 Index has doubled. Last week The Wall Street Journal stated that it was the fastest doubling since 1936. That rally began in March 1935 and reached the 100 percent gain mark in 501 days. The red vertical line in the chart below depicts the start of the rally.

This time the market needed a bit longer to double … 707 days. 

What the Journal did not mention was what happened afterwards. Let’s fill that gap, since the rest of this story is as interesting as the first part … 

Immediately after the index doubled in 1936 a short-term correction followed. But then the rally reassured itself. It lasted another seven months and gained 15 percent. However, that was the end of the party as you can see in top panel of the chart. 

The S&P 500 experienced 40 percent slump the following year. But the final low of this bear market came as late as 1942. Many analysts conclude that 1942 marked the real end of the Great Depression.

An Interesting Analogy
I see an interesting analogy here since the bull market of 1936-1937 followed the most severe financial crisis in U.S. history, and the current rally follows the second-most severe one. 

In 1936 hopes ran high that the crisis was over and a sustainable recovery had started. But as it turned out the economic slump was only interrupted. Another grave economic downturn started in May 1937 and lasted until June 1938 with GDP declining 3.4 percent. Only the outbreak of WWII put an end to the Great Depression.

As in 1936 hopes are again running high that the Great Recession and the associated crisis is over and that a sustainable rally has started. This may also turn out to be a false hope. Why? 

Well, the underlying problems of overindebtedness have not been solved — not even addressed. Quite to the contrary. All that has happened is the government stepping in and shifting some of the most pressing debt loads of financial institutions from the private sector to the public sector. 

That’s not a solution; it’s kicking the can down the road!

Fundamental Valuations Are High
Now look at the middle and bottom panels of the above chart. The middle one shows the price/earnings ratio, the second one dividend yields. Both are time honored measures of valuation. First you can easily see that current valuations are very high.

Then compare 1937 to today. In 1937 the price earnings ratio was a tad lower than now. But the dividend yield was higher at 3 percent then vs. 1.7 percent today. Obviously, the stock market is no healthier now than it was in 1937.

Let’s summarize the main points: In the mid-1930s the stock market and the economy were recovering from a major crisis, and the stock market was clearly overvalued. The majority of market participants and economists were sure a sustainable recovery had just begun. 

Their hopes were quickly dashed. 

Will it be different this time around? Probably not because we’re in the same boat today: Recovering from a major crisis, an overvalued stock market and high expectations. 

Plus there are other signs warning of a high risk environment …

Fund Managers Fully Invested, Short Interest Drops; Insiders Selling Stock!
First, mutual fund managers are again fully invested with an average cash quote of a mere 3.5 percent. This is the lowest reading since this data series began in 1988. Only once before — in March/April 2010, just before a 20 percent correction — has this indicator been so low. Even at the major highs of March 2000 and October 2007 fund managers were more cautious than now. 

Second, the NYSE Short Interest Ratio has fallen from 4.1 in December to a very low 2.6. This ratio measures the total outstanding shares sold short divided by the average daily volume for the last month. Its interpretation is twofold … 

A low short interest ratio is a sign of widespread bullishness or at least complacency. Even more important is the fact that short sellers are potential buyers in case of a market slump. To realize their gains they have to buy back the shares sold short. So the massive decline in shares sold short means there will be fewer buyers in the future. 

Third, financial insiders are massively selling the stocks of their companies. Alan Newman of Crosscurrents shows that 68 sellers were matched by just four buyers. And the ratio of shares sold to shares bought was 855. 

So why are the insiders of Goldman Sachs, Wells Fargo, JPMorgan, Morgan Stanley, American Express, Citigroup, and US Bancorp selling like mad? They apparently have some doubts in the health of the current rally — at least insofar their own money is concerned.

You don’t have to sit on the sidelines if the market takes the header I see coming … 

One way to profit from a declining market is with an inverse ETF, like ProShares Short S&P500 (SH). This fund seeks daily investment results that correspond to the inverse of the daily performance of the S&P 500 Index. That means you stand to make 1 percent for every 1 percent the Index drops.

Continue reading this article >>

Italy’s ties to Libya in spotlight amid unrest

By Polya Lesova

Few European countries have closer ties to Moammar Gadhafi’s Libya than Italy

It’s little surprise then that the Italian stock market fell sharply this week, as a popular uprising against the 42-year regime of Gadhafi escalated, leading to violent turmoil and uncertainty about the path ahead for the oil-rich North African nation.
Libya, which was once an Italian colony, is a key supplier of oil and natural gas to Italy. Prime Minister Silvio Berlusconi’s government has spent years wooing Gadhafi, leading to considerable cross-border investment. 

“Berlusconi has made enormous efforts to strengthen institutional ties between Italy and Libya, but also to strengthen personal ties between himself and Gadhafi,” said James Walston, a professor at the American University in Rome. 

“If Gadhafi goes, that could cause trouble for Italian interests,” he said.
Italian companies have invested heavily in Libya, which is home to Africa’s biggest proven oil reserves. Energy giant Eni SpA /quotes/comstock/23g!eni (IT:ENI 17.08, -0.20, -1.16%)   /quotes/comstock/13*!e/quotes/nls/e (E 46.88, +0.20, +0.42%)  was Libya’s biggest international hydrocarbon operator in 2009, according to its website. Eni has operated in Libya since 1959. 

In the construction and engineering sector, Impregilo SpA /quotes/comstock/23g!ipg (IT:IPG 2.26, -.00, -0.09%)  has several key projects under development in Libya, including a conference hall in Tripoli and university campuses in three other cities. 

In turn, Libya owns stakes in some of Italy’s highest-profile companies, including banking giant UniCredit SpA /quotes/comstock/23g!ucg (IT:UCG 1.85, +0.01, +0.76%) , aerospace and defense group Finmeccanica SpA /quotes/comstock/23g!fnc (IT:FNC 8.96, -0.15, -1.65%) , and soccer powerhouse Juventus Football Club SpA /quotes/comstock/23g!juve (IT:JUVE 0.87, +0.02, +1.95%)

As investors worried about what the Libyan unrest would mean for Italian companies, Milan’s benchmark FTSE MIB stock index slumped 3.6% Monday and a further 1.1% Tuesday. The index closed down 0.3% on Wednesday. Read more about European stock markets.
 
So far this week, Eni and UniCredit shares have both declined 7%. Impregilo’s shares are down more than 8%.

Berlusconi in a tough spot

Libyan leader Moammar Gadhafi is greeted by Italy's Prime Minister Silvio Berlusconi in Rome in this Nov. 16, 2009 file photo.
International pressure on the Libyan leader has grown following his brutal crackdown on protesters. At least 300 people have died in the unrest, according to reports. Italy’s foreign minister on Wednesday was quoted as saying the death toll was likely over 1,000. 

In a defiant televised address Tuesday, Gadhafi vowed to fight and to remain in Libya “until the end.” 

Italy’s close ties to Libya have put Berlusconi in a difficult situation, as international condemnation of Gadhafi has grown.

Big Gains On eMini Russell and Gold With Our Ninja Trading System

Il nostro Ninja Trading System ieri ha chiuso un ottimo trade su eMini Russell, inoltre sta gestendo una posizione aperta a rialzo sul Gold che sta realizzando $ 5000 c.a. per contratto. Qui sotto abbiamo inserito gli screenshot dei trades chiusi recentemente su eMini Russell e eMini S&P e quello in corso sul Gold. I risultati storici di Ninja System sono disponibili ai seguenti link: http://www.box.net/shared/static/oam4a02b4m.xls, http://www.box.net/shared/c22rgem896. I risultati di alcuni altri nostri trading systems sono a disposizione al seguente link: http://www.box.net/shared/5vajnzc4cp

Our Ninja Trading System yesterday closed a good trade on eMini Russell, also is managing a Long trade on Gold who earning $ 5000 c.a. per contract. Below we have included screenshots of recently closed trades on eMini Russell, eMini S&P and the current trade on Gold. Historical results of Ninja System are available at the following links: http://www.box.net/shared/static/oam4a02b4m.xls, http://www.box.net/shared/c22rgem896. Historical results of our some other trading systems are available at the following link: http://www.box.net/shared/5vajnzc4cp

ES TF GC

Material in this post does not constitute investment advice or a recommendation and do not constitute solicitation to public savings. Operate with any financial instrument is safe, even higher if working on derivatives. Be sure to operate only with capital that you can lose. Past performance of the methods described on this blog do not constitute any guarantee for future earnings. The reader should be held responsible for the risks of their investments and for making use of the information contained in the pages of this blog. Trading Weeks should not be considered in any way responsible for any financial losses suffered by the user of the information contained on this blog.

The Commodities Boom of 2011: Coal Will Be the New Gold


Martin Hutchinson writes: The run-up in commodities prices has been a long one. And it shows no signs of abating.

As a Money Morning reader, you know that we predicted this run-up. Back in October 2007, for instance, we told readers to buy gold - when it was trading at $770 an ounce. Those of you who followed our advice have done quite well. 

But now it's time to make a new prediction.

The run-up in commodities prices isn't going to end. But it is going to change.

You see, commodities are going to break into two distinct groups: Traditional inflation hedges, such as gold, and big industrial commodities, such as coal.

Going forward, the industrial path will be the one that investors will want to travel for maximum profit. Here's the No. 1 way to play what we're calling "the commodities boom of 2011."

The Lowdown on the Commodities Run-Up
With commodities such as silver and gold, the prices are based on speculative demand. During the current run-up, loose global monetary conditions and the fear of inflation have served as the catalyst for record prices. For the last two years, governments around the world have used monetary policy as a tool to prop up their economies after the financial crash. That has pushed up gold and silver prices: The increase in the yellow metal has been moderate, albeit steady, while silver has doubled in the last 18 months.

However, interest rates are now rising in many countries, as central banks work to head off inflationary pressures. In both Britain and the Eurozone, interest-rate increases are quite close - in Britain, where inflation has already appeared there at the 4% - 5% level, and in the Eurozone, because the managers of the European Central Bank (ECB) are monetarily quite conservative.

It is already fairly unlikely that U.S. Federal Reserve Chairman Ben S. Bernanke will succeed in imposing another period of "quantitative easing" - involving large-scale purchases of U.S. Treasury bonds - after the current "QE" program expires in June.

By the fourth quarter, inflation stemming from the world's rising commodity prices may penetrate the notoriously insensitive price reports from the U.S. Bureau of Labor Statistics (BLS). If that happens, Bernanke & Co. may be forced to start increasing interest rates by the end of this year - although the Fed chairman will no doubt do his best to delay and limit the process, as he and predecessor Alan Greenspan did from 2004 - 06.

With monetary policy gradually getting tighter - and trillions of fewer dollars in liquidity sloshing around the global economy - the upward pressure on gold and silver prices will decrease, although those won't disappear immediately. 

At the other end of the commodities spectrum - in food commodities and bulky commodities such as iron ore - the trajectory will be different. With this group of commodities, the primary upward catalyst won't be global monetary policy; it will be the rapid growth in emerging-market economies. 

Emerging-market consumers, whose incomes are rapidly growing, are nevertheless poorer than Western consumers and do not have the basic goods that are associated with modern affluence. Hence, those newly minted middle-class consumers are now buying modern apartments, automobiles, kitchen appliances and a host of other items that, unlike electronic gadgetry, require large amounts of such basic materials as iron and steel to manufacture.

Since demand for basic industrial commodities is driven by emerging-market consumers - and not by monetary policy - there is relatively little speculative activity in coal or iron ore. Instead, the demand is industrial in nature.

This is an important distinction for prospective investors. You see, price increases driven by industrial demand are likely to persist longer than those that were speculative in nature, particularly since it's not at all likely that modest interest-rate increases will kill off the growth that we're seeing in emerging-market economies.

Keep an Eye on Supply
We should not, of course, neglect the supply side. For some commodities - most notably oil - a number of new supply sources have arisen over the last five years. For instance, Canadian tar sands now form a more-substantial part of the U.S. oil picture.

And with oil-shale prices currently near $100 per barrel, this is now a viable source of additional supply. Colorado has a big supply. Outside the United States, the Tupi oil fields in Brazil are due to come on-stream in 2012, while Colombian production has been increasing at a rapid rate and is expected to ramp up further in coming years. 

Moreover, the speculative zoom that oil prices experienced in the summer of 2008 showed us that - at prices above $100 per barrel - demand becomes quite sensitive to oil prices, partly because very high oil prices tend to deflate non-oil-producing economies. Thus, the upward pressure on oil prices is likely to be moderate.
Conversely, copper is particularly likely to continue rising in price because new sources of supply take a very long time to come on stream, and many mining projects were severely delayed by the 2008-09 global downturn.

In addition, speculative demand by hedge funds and through the exchange-traded-funds (ETF) mechanism is withdrawing physical copper from the market, a much more serious problem than with gold, because the world does not have large stocks of unused copper.

Thus, copper - which is "in the middle," between the speculative and industrial commodities - is likely to continue rising in price, until major new sources of supply come on stream in 2014-15.
That brings us to coal, which is shaping up to be the best way to profit from the commodities boom of 2011.

The No. 1 Profit Play
Coal is at the far industrial end of the spectrum: In the past, supplies have been plentiful, and speculative demand negligible.

Both China and India are heavily dependent on coal for electric power. And both countries have increasingly resorted to imports as demand grows. Furthermore, coal mining has not been particularly profitable in recent years, and developing new coal mines in advanced countries is a permitting nightmare because of the environmentalists.

There is thus much less capital in the coal industry than there is in the oil sector, and much less ability to ramp up production to meet soaring demand.

So where does that leave us? Coal mines - not gold mines - will be the key to investor profits in the commodities boom of 2011.

As an investor, you could do a lot worse than Cliffs Natural Resources Inc. (NYSE: CLF). Cliffs, working through several Australian joint ventures, is a major coal supplier to China. And through its acquisition of Canada's Consolidated Thompson Iron Mines Ltd. (TSE: CLM), a $5 billion deal announced just last month, Cliffs will become the largest-iron-ore producer in North America.

Cliffs has had a very good run, with its stock price having more than doubled in the past 18 months, but isn't overvalued. The Consolidated deal will broaden its reach. And it remains very strategically positioned, indeed.
Action to Take: The commodities boom is destined to continue. But it's going to take a different form here in the New Year - which is why we're calling it "the commodities boom of 2011."

The investment leaders up to this point - chiefly gold and silver - are going to give way to industrial commodities: Copper, iron ore and others. But the big star could be coal. And the No. 1 way to play it is Cliffs Natural Resources Inc. (NYSE: CLF).

Cliffs is a major coal supplier to China. And through its acquisition of Canada's Consolidated Thompson Iron Mines Ltd. (TSE: CLM), a $5 billion deal announced just last month, Cliffs will become the largest-iron-ore producer in North America.

Cliffs isn't overvalued - despite its stock having had a good run. The Consolidated deal will broaden its reach. And it remains very strategically positioned, indeed.

[Editor's Note: Money Morning Contributing Editor Martin Hutchinson doesn't just have a knack for picking out profit plays in the energy industry. 

You see, he's a numbers man. And he successfully applied his mathematical knowledge - as well as his financial expertise - to his 37 years as an international banker. 

Now Hutchinson is using those same skills to help investors multiply their wealth by uncovering outstanding quality stocks with consistent high cash payouts. Just click here to read a report on how you too can pull enormous amounts of money out of the markets, or subscribe to his advisory service Permanent Wealth Investor.]

How To Use Gold And Silver To Get Rich On Inflation


Below, I look at what is driving the precious metals markets. The US government and the Fat Boys that control the Federal Reserve banking system, both benefit from inflation. We can also benefit, by understanding who, is doing what, to who.
In the second part, I suggest a way to use loose money and low interest rates to protect us from inflation. 

A hunger for democracy?
Inflation is starting to show up in the producer price index.  This month the consumer price index showed that the producers are starting to pass their increased input cost on to the end users.  As long as they are successful at doing that, then inflation can spiral higher.  We have seen similar inflation data in China, India and the United Kingdom.  

As the inflationary pot sits bubbling on the burner of quantitative easing, the poorer countries will be flash points, where inflation gives no sanctuary.  Only starvation, sickness and death. When you live in grinding poverty, subsisting on $2.00 a day and spending 80 percent of your income on food.  When your teeth are rotting in your head and your children, dressed in rags, are crying themselves to sleep with empty bellies, you don't think much about buying gold or silver as an inflation hedge.  

Most of the world's people need help from their governments to survive.  Irresponsible monetary expansion has made that possible for most countries. Until now. The illusion of prosperity has set the world up for major trouble. 

The media talks of a world, hungry for democracy.  They miss the point.  The world is just hungry, and getting hungrier. 

None of these counties have ever had democracies and most never will.  Not for long.

There will be constant fighting. Tribal warfare. Dislocation and chaos.  

It's coming. 

The truth is, we are about to see the same fate befall many so called democratic countries as well, including the United States.  In fact, it is already happening.  Even in "inflation central", the standard of living is collapsing.  States and municipalities are bankrupt now. They are cutting subsidies.  Laying off the people that supply essential services.  For example, at the same time that they reduce police budgets and staff, they are letting felons out of prison because they can't afford to hold them.

The dictatorial governments are not passing enough money through to their citizens.  They are taking too big a cut for themselves.  This isn't going away.  Times will get harder. Oppressive regimes will have to take a hard line against protesters.


Don't kid yourself, the Fat Boys are an oppressive regime. I include the federal reserve banking system in the Fat Boy's empire. The thin edge of the wedge is already in the crack.

The truth is that only a few benefit from inflation.  Most are harmed. 

This is an organized inflation to benefit the rich.  They don't care who they harm, anymore than Gaddafi does.

The government and the Federal reserve system, form a dangerous parasitic-symbiotic relationship that we all have to fear and protect ourselves from.  The rich want more and they have found a way to get it. Now they can print as much money as they want. They can't just put the money in their pockets however.  That would be counterfeiting.  They need to launder it first.

The Fat Boys have slammed the trap shut.

They have found the perfect laundry.  The people of the United States and their government. These patsies are abetting a perfect crime.  They have bankrupted themselves, but don't want to live the life style they are doomed to.  Like the people of Egypt, they have a hunger.

The US government desperately needs a way out of the debt trap they have created, before the people start rioting in the streets. 

Hush money.

The Fat Boys have hooked the country's leadership on the idea that we need more inflation. 

It gives the government the resources they need to fiscally bribe the people.  It keeps them from going hungry and pouring into the streets.  That is just one benefit. 
 
The Federal reserve finances the country's day to day operations and drives up prices.  At the same time,  the government applies the only weapon they have that can dig them out of the debt trap.  They tax the inflation that the Fed is creating. 

It is a hidden tax, that uses inflation to take a huge cut of everything we make in the markets. The more we hedge by owning hard assets, the more it appears that we make.  The more we make, the more tax we pay. Therefore, the bigger the government's tax base.  Even though your gains may only keep even with inflation, you have to pay the government 30 percent on your illusory gains.   

Here is the beautiful part for the Fat Boys. 

Because the government wants to keep the illusion of legitimacy, they are not printing the money themselves. The Fed has been given permission to print money out of thin air.  Then lend it to the Government. Then the government gives the Fat Boys back their cut (interest),  lets use 3 percent for illustration purposes.  By printing 600 billion for the government, they have counterfeited roughly 20 billion per year for themselves.  Remember it is per year. There is no way the government is ever going to pay it back. In fact, it will increase every year as the 20 billion gets added to the deficit.  Not to mention all the old debt that will need to be rolled over and the new debt that will be created. It will all have to be financed by the Fed.

The Fed has no reason to lend to the general public now, unless they are part of the elite.  In fact they have more reasons not to. The longer the economy founders, the more government fiscal stimulus will be needed.  That means more QEs and that means the Fed's cut gets even bigger.  

Disingenuous at best.

Bernanke is warning the US government that they have to be more fiscally responsible, all the while knowing full well it is not possible.  Why ?  It is a form of character assassination, which scares away bona fide lenders and makes sure that interest rates on US treasuries stay high or go higher.  Higher rates support the dollar and that is what they are counterfeiting.

You ask, why are long term rates going up, not down, as the Fed buys Government debt? Think about it. Who benefits from higher rates.

Below is a chart and some of the commentary from an article I wrote last December in an M.O. article entitled "What is wrong with gold" . Beneath that is a chart that brings us up to the present. I have colored what happened to the price since December 21, in red.  I used the gld chart but the same basic parameters apply to gold itself. They also apply to silver and slv.  

Here is the conclusion I wrote, from that article.
..........................................................................................
I am looking for another quick swing toward the highs, that may reach above 1400. Then I expect a swipe down toward the October lows (128ish). That is where I will be backing up the truck.
.........................................................................................


Late translation says "good to go"

In the above chart, we see that the low was essentially 128 and the low came in on time. Since then we have gone up steadily for almost a full month. The blue dots mark 1 month cycles. Notice that we are due for a 1 month low now.  When we go up this late in a cycle, it is called late translation and indicates that the larger cycles, such as the 3 month and the 6 month, are pushing up and adding lift.  That is what we were expecting to occur.  So far it seems to be confirmed.

If you look back at what happened in August, you get an idea of what I mean. If the market is as strong as it telling us, we shouldn't fall much below 132.50 when we make this month's low. We have to watch what happens of course, but for now it looks good to go.

We have a minimum target of $148 which translates into nearly $1500 on bullion.

The higher gold goes (and inflation in general) the more the taxman rakes in, so we have the Fed and the government on our side.

To beat the inflation tax you need to use leverage. If inflation is going to wipe out our savings, it follows that it will also wipe out our debts.  As long as money is available at interest rates below the inflation rate, it is almost free.  That is what the fat boys are doing.

Leverage beats the inflation tax. It is how we can hedge inflation and grow our wealth. 

One example. 

One of my students (Ben) has grown his account from $90K to $325K in less than 6 months.  The $90k was borrow to start with and he used margin debt as well. When Ben pays back the money he borrow. The lender will not be able to buy as much with the money as he could when the loan was made. The lender pays the inflation tax. The money that Ben has in his account after the loan is paid back, is money out of thin air.  Instead of illusory profits. He has made real profits, on illusory debt.

There is just one small problem. 

To use leverage requires a higher skill set.  You need to know where to enter and how to minimize risk. I have created a powerful set of videos that will teach you those skills. I also teach one on one courses, in real time, using real money. My money.

I never use indicators. moving averages etc.

Conventional technical analysis doesn't work. If it did, making money trading would be easy. Instead the Fat Boys prey on traders that use indicators. 

It is much more important to know how to find the trigger points that the Fat boys use in their algorithms. You have to understand market structure and manipulation to be profitable.

The Fat Boys control the markets and if you are not with them, then you are a victim.

Please go to my web site or Email me. 

Gold, China and the West Take Opposite Approaches to Inflation


Precious metals gained on Friday amid the G-20 weekend summit, geopolitical concerns, and inflationary pressures. Gold traded at $1390 per ounce while silver was at $32.65 per ounce. So far, February has been an interesting month for gold. The development in emerging markets, inflationary pressures in the United States and lingering geopolitical worries have all contributed to its rally. 

Gold prices held steady as the People’s Bank of China did what it can do combat inflationary pressures at home. The price of gold was almost unchanged after reports confirmed that the PBOC raised its reserve ratios to 50 points which will become effective on Feb. 24, 2011. 

It should be noted that the gold prices were firm despite the fact that policymakers in China implemented a series of tactics, even interest rate hikes, to contain inflation and cool its overheating economy. Food prices in China are of particular concern because an average working class Chinese allocates a high proportion of their income to buy food.

Fed Keeps Its Cool amid Inflation Concerns

While Chinese policymakers are ramping up their fight against inflation, Fed Chairman Ben Bernanke doesn’t seem to think that deviating from his current policy of quantitative easing and zero interest rate would be a good move at this time. Aside from buoying gold prices, it also helped maintain the price of almost all asset classes. 

In the United States, precious metals are doing well because the Fed is keeping its commitment to keep monetary policies loose in spite of skyrocketing commodity prices. Silver performed better than gold this month, appreciating by 13%. Meanwhile, gold price only increased by 4% in February. At its current rate, silver is trading at its peak level since 1980 when the Hunt Brothers tried to dominate the market, pushing the price of silver to $50. 

High inflation brings one of George Washington’s statements to mind, “paper money has had the effect in your state that it will ever have, to ruin commerce, oppress the honest, and open the door to every species of fraud and injustice.” Around a century afterwards, the effects of inflation are distinctly apparent. Today, a dollar is worth less than 2 cents in purchasing power than in 1913. 

As the wholesale prices rose broadly in January, the fear of inflation is once against stoked. According to the Bureau of Labor Statistics, the producer price index of finished goods, excluding energy and food, rose to 0.5% last month. This is significantly higher than the 0.2% increase that economists had expected in October 2008. The overall index for finished products (goods delivered to retail stores) increased 0.8%.

Inflation in the West will be “Subdued”

Right now, concerns about inflation in the West are mainly centered on rising energy and food crises due to the demand from emerging markets. Poor harvests limited agricultural output, further contributing to price volatility. The Federal Reserve has focused more on core inflation due to the volatility of energy and food prices. Paper products, jewelry, pharmaceuticals, and jewelry saw some of the largest price increase last month. Joel Naroff of Naroff Economic Advisors said that, “What’s worrisome is the accelerating increase in non-energy and non-food prices.” 

Although pharmaceuticals accounted for an estimated 40% of wholesale prince increases, Paul Ashworth of Capital Economics said that the trend is unlikely to result to sustained rise in inflation because drug prices can be volatile. Core finished product prices are only up 1.6% from last year. Ashworth further added that retailers cannot pass along these price increases to consumers at this point despite strong retail sales the previous year. 

However, Eugenio Aleman, a Wells Fargo economist, said that consumers will see higher prices eventually. There are already grocery, fashion, and other sellers who intend to raise prices to offset their costs. If this happens on a large enough scale, the Fed may need to raise short-term rates sooner or sell some of the Treasury bonds it has been hoarding to decrease long-term rates. If the Fed takes either course of action, recovery may be dampened. 

In its January 25-26 meeting, the Fed reported that it projects inflation to be “subdued”. It expects the inflation to stay at 1.3-1.7% for 2011 and 1-2% through 2013. The economic growth forecast also increased to 3.4-3.9% from 3-3.6% in November. Some of the reasons cited include rising business investments, consumer spending, and factory output. 

Despite this growth, the Fed said that unemployment will still be high at around 8.9%. Prevailing weakness in the construction sector, employer’s cautious hiring, and tight credit would hinder higher economic growth. Some Fed policymakers said that the recovery may prompt the Federal Reserve to shelve its plans to buy $600 billion worth of Treasuries by June. But other policymakers believe that the current outlook is not likely to change “enough” to prompt this action.
Gold and Silver Prices

In the short term, the correlation between the dollar and gold indicates that the strength of the greenback is one of the primary drivers of increasing gold prices. Take note of the medium-high 0.59 coefficient found on the 30-day column. Silver is correlated with stocks as is indicated by the 0.61 coefficient.

However, Fed’s low-interest-rate policy is not a short-term phenomenon, it’s a long-term one. As such it has implications for the precious metals market in the long run. In this case, let’s take a look at the long-term column – the 1500 trading day one. The correlation coefficients are negative and below -0.5 for gold, silver and mining stocks which means that weakening dollar will likely to influence these markets in a positive way over the following years.

Overall, the signal for precious metals at this time is bullish.

In the stock market, large-cap gold firms are raking in their earnings after a quarter that propelled gold prices to high highs. The CFO of Barrick Gold, Jamie Sokalsky, said “we’re not inclined to view gold price as being anywhere near the top.”  Gold prices have recovered over half of its $118.72 slide from the all-time high last December 7, 2010 at $1,432.50 to its multi-month low of $1,313.78 on January 27, 2011. The price of gold is expected to experience its third weekly gain. It is poised to breach the $1,400 per ounce level once again.

If you are interested in knowing more on the market signals we analyze, we encourage you to subscribe to our Premium Updates to read the latest trading suggestions. We also have a free mailing list - if you sing up today, you'll get 7 days of full access to our website absolutely free. In other words, there's no risk, and you can unsubscribe anytime.

Thank you for reading.

How To Profit From Copper's Next Wave, Follow The Money


Urbanization is a macro-trend, in 1800 two percent of the global population was urban, by 1950 it was 30%. Today half of all the people in the world live in cities. This is an economic migration - historically poverty rates are 4 times higher in rural than urban areas. The UN projects that by the year 2030 there will be 1.5 billion more people living in cities.

Investing in copper might be the simplest way to profit from the ongoing global urbanization.

China has one fifth of the world's population and India has another 1.2 billion people. India's economy expanded at 8.9% in the quarter ended September 30th while China's economy expanded at 9.8% in the quarter ended December 31st.
China and India consume a lot of copper. Key drivers of increased copper consumption in both countries is infrastructure build out - power, construction, energy and transportation.

India's power production needs to rise by 15 to 20 percent annually which means, according to the International Energy Agency (IEA), India needs to invest $1.25 trillion by 2030 into its energy infrastructure. Because of this investment into new infrastructure India's annual copper demand is expected to more than double to nearly 1.5 million tonnes by 2012 - up from a current 600,000 tonnes. India usually exports between 100 and 150,000 tonnes a year, Indian copper exports are likely to cease and indeed Indians might become large copper buyers.

With less than 1/3 of the population India's urban areas generate over 2/3 of the country's GDP and account for 90% of government revenues. A report done by the McKinsey Global Institute called India Urban Awakening predicts that 590 million people or 40% of India's population will live in cities by 2030, up from 340 million today.

China's current urbanization rate of 46 percent is much lower than the average level of 85 percent in developed countries and is lower than the world average of 55 percent. China has set a goal of 65 percent of urbanization rate in 2050. Over the coming 40 years that means 20 percentage points of urban growth per year. This translates into 300 million rural residents becoming urban residents over this time period - last year the disposable income of the Chinese urban population stood at 17,175 yuan per capita while the net income of the rural population was 5,153 yuan per person.

The annual per capita consumption of copper in India is 0.47 kg, China's 5.4 kg and the world average is 2.7 kg. China's urbanization plans and forecast GDP is expected to drive Chinese copper consumption from the current 5.4 kg/capita to an astounding 10 kg/capita by the end of the decade.

Australian equity research firm Resource Capital Research (RCR) said it expects the copper market to move from a small surplus in 2010 to a deficit of around 400,000 tonnes by 2011. According to JPMorgan Securities Ltd, the world refined copper market will have a 500,000-metric-ton deficit in 2011. The International Copper Study Group said global demand for copper will rise by 4.49% in 2011. Supply disruptions have cancelled out modest mine supply growth.

A glance at the following two charts confirms the growing demand for copper while inventory levels at the London Metal Exchange hint at the supply deficit.

With metal analysts calling for a 10-30% rise in the 2011 copper spot price, you could probably make money buying shares of JJC-iPath - an index composed of copper futures contracts traded on the New York Commodities Exchange (JJC is up 50% in the last 6 months).

Or you could buy shares in one of the big multi-national copper miners. Freeport McMoran (FCX-NYSE), BHP Billiton (BHP-ASX) or Xstrata (XTA-LSE) are up a collective 58% in the last year.

But to make the big gains, you have to get in ahead of the money flow. Potash has recently given us an excellent example on how to do that and what signals investors should watch for as the process plays out.

Potash is the primary ingredient in fertilizer, it's also a mined resource with global demand being driven by a macro trend. What's been happening is a trickledown effect and is a three phase process:

PHASE#1: a barrage of bullish headlines in the mainstream media: "Potash Profits Up" "Spike In Food Prices Bullish For Potash" "Potash Export Prices Rising" etc.

PHASE#2: a flood of investment dollars into the senior potash companies. Potash Corp (POT-NYSE), Agrium (AGU-NYSE) and MOSAIC (MOS-NYSE) are all up about 120% in the last 12 months.

PHASE#3: Snowballing investor interest in the "junior" (smaller cap) explorers. This third phase is typically riskier and more profitable than phase #2.

Nine months after the potash majors began their climb, Amazon Mining (AMZ-TSX.V), Encanto Potash (EPO-TSX.V) and Western Potash (WPX-TSX.V) all caught fire - catalyzed by news stories of food price inflation. In the last three months all three aheadoftheherd.com sponsor companies have seen stock price increases an average of plus 200%.

"You're seeing a catch-up phase, there's capital flowing into the sector and it's moving down into smaller-cap names." Robert Winslow, Wellington West Capital Markets

Copper has just completed phase #1 (a barrage of bullish headlines), and phase #2 (the majors have had their run).

Phase #3 is about to begin.

VMS Ventures, Copper Fox, Far West Mining, Hana Mining, Nevada Copper, Redhawk Resources and Western Copper are all good companies seemingly well positioned to benefit from this next phase.

Catalyst Copper

I am going to single out one company, Catalyst Copper TSX.V - CCY, that appears to have everything going for it - including a "tell" in the fundamentals that suggests it may be about to be re-valued.

Catalyst has the right to earn 60% of the La Verde Project. La Verde is a Mexican copper porphyry project with NI 43-101 compliant resource of 2.1 billion pounds of Measured and Indicated copper and an Inferred Resourceof 1.3 billion pounds of copper.

Catalyst Copper is currently earning into a 3.4 billion pound copper deposit that remains open in all directions. Today their 60% share would equal 2 billion pounds of copper - 9.6 pounds per share - the current spot price of copper is $4.46/lb. With Catalyst currently trading at .22 an investor would be buying copper in the ground for .02 a pound.

Catalyst Copper, partnered with Teck Resources TCK-TSX, has commenced an aggressive 20,000 meter drill program for 2011.

Catalyst CEO John Greenslade just raised $850 million for Baja Mining and he is on record as stating that CCY is a "more straight forward project".

But here's the tell: for the last year CCY has traded about 500,000 shares a day. A lot of that trading is "seed stock" changing hands. Since February 1, 2011 - the average daily volume has jumped to about 1,840,000 - while the stock has risen to .22.

180,000 people a day move from the country to the city. Urban infrastructure devours copper. Over the next 12 months that demand might drive investment dollars into juniors with big resources like Catalyst Copper.

Are there copper juniors on your radar screen?

If not, maybe there should be.

Continue reading this article >>

Follow Us