Thursday, June 20, 2013

Initial "Sell Signal" Is In

by Lance Roberts

We discussed in last weekend's newsletter that this week would likely lead to a market "sell signal".   With the sell off in the markets today the market has not only thrown off a weekly sell signal (denoted by the vertical blue lines) but also violated support at 1600 as shown in the chart below.  For a complete explanation of the chart below please review last weekend's newsletter which details all the different indicators in detail.

Sell-Signal-062013

While much of the sell off has been attributed to the Federal Reserves statement yesterday I fear that the real culprit is likely a potential resurgence in the Euro zone crisis as witnessed by spiking yields across the region and an announcement today that the IMF is likely to cease funding aid to Greece.  From Zero Hedge:

"As we warned earlier in the week, Greece is notably missing its Troika goals and the issue just became a lot more critical. As The FT reports, the IMF is preparing to suspend aid payments to Greece over what it claims is a EUR 3-4 billion shortfall that has opened up. Between health care budget shortfalls, central banks refusing to roll-over Greek bonds, and amid signs that even the scaled-back privatization plans that Athens had agreed to being behind schedule, the IMF - following its own admissions of mistakes in the Greek bailout, has warned EU officials the shortfall will require it to stop aid payments by the end of July. The equity market is already reacting (as is EURJPY - EUR weakness against the big carry pair) to this re-awakening of EU event risk (and the awkward timing with Merkel's election so close) - with the Fed's comfort blanket somewhat removed."

As I stated in last weekend's newsletter this initial "Sell Signal" is a warning that a further correction is likely to come.  This is a wake up call to pay attention to your portfolio.  However, this is not a signal to "panic sell" and make emotional based investment mistakes.   In this regard here are the actions that should be taken within portfolios.

1) Review all holdings in the portfolio fundamentally to determine if anything has changed within the fundamental storyline.

2) Review each positions weight relative to the portfolio. Assume that each position in a portfolio was 5%. Trim back positions that are now greater than 5% back to portfolio weight. (It is not uncommon that when a warning is issued that the market will continue to rise – therefore, we only want to trim profits currently and sell positions on bounces if trends become broken.)

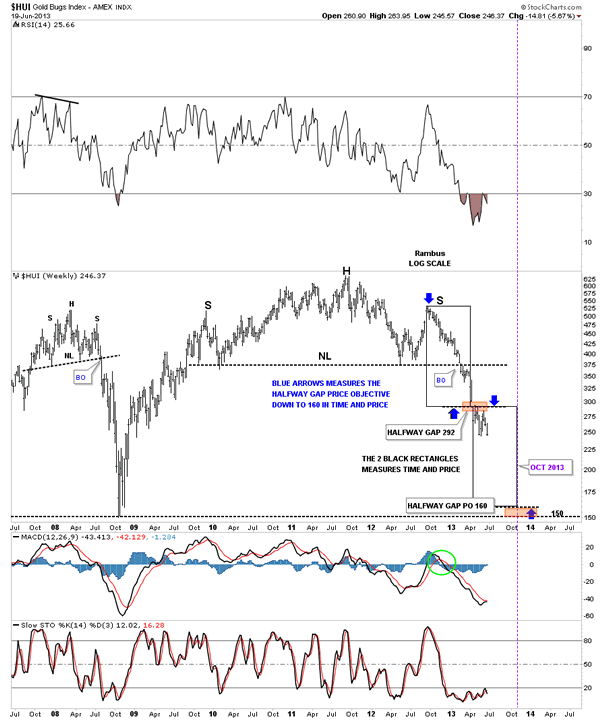
3) Positions that are fundamentally broken, lagging or otherwise not performing should be sold in their entirety UNLESS they are a hedge against a correction. Positions that are lagging during a market rally tend to lead on a market decline.  (This includes gold, gold miners, precious metals, etc.)

4) Do not sell winners to buy losers. Hold cash as a hedge against the coming correction. Notice that all warnings above are eventually followed by a sell signal and a market correction.

Notice that in the chart above the SELL Signals in the bottom most MACD indicator ALWAYS align with the signals of the other indicators. When all of these signals align it is always in conjunction with a more significant market correction.  Currently, the indicators are issuing a very strong "warning" and it is likely that within the next couple of weeks we will see a deeper correction occur. 

With support at 1600 now removed it is likely that we could see a retracement to the longer term moving average (red dashed line) above which is currently at 1525.  A violation of that level and we have a whole new ball game to deal with.


NOTE:  I am not advocating market TIMING – which is trying to be either "all in" or "all out" of the market. This is not a winning strategy. However, I am advocating using price analysis to determine optimal times to manage portfolio risk by increasing or decreasing exposure to equities. Furthermore, as opposed to the mainstream media that tells you that you should "buy and hold," the whole premise of investing is to "buy low" and "sell high." How can you do that if you don't know where "high" and "low" exist?")


It is important to remember that if you think that every position you buy is going to be a winner, or you expect your advisor to only buy winners, then you should NOT BE INVESTING. It is an unrealistic expectation that will lead to larger losses than you can imagine.  Having a loser in your portfolio is just a reality of investing – it does not mean you, or your advisor, is loser for making a mistake.  There is NO PROFESSIONAL INVESTOR on the planet that doesn't have losers more often than not.  It is how you deal with them that matters.  Limit the loss, correct the problem and move on.

This is why the greatest investors in history all have the same investing rule in one form or another:  "Cut your losers short and let your winners run."

It seems simple – but it is an extremely tough rule to follow.

Be sure and subscribe to the email list (it's free and only for email deleivery of the newsletter notification) and I will update the market analysis this weekend along with a sector review and rebalancing suggestions.

See the original article >>

Gasoline slides most in seven weeks on prospect of Fed pullback

By Barbara Powell

Gasoline slid the most in seven weeks, dropping along with crude and other commodities on concern the Federal Reserve will reduce economic stimulus and as data signaled China’s growth is slowing. Crack spreads narrowed.

Futures fell as much as 3.6% one day after Fed Chairman Ben S. Bernanke indicated the central bank may begin reducing its bond buying this year if the pace of economic recovery is in line with the Fed’s projections. Reports show China’s manufacturing shrank at a faster pace and its benchmark money-market rates climbed to records.

“Tapering off is like raising rates,” said Phil Flynn, senior market analyst at Price Futures Group in Chicago. “Banking issues and bad manufacturing in China are putting more pressure on the market.”

July-delivery gasoline fell 10.07 cents, or 3.5%, to $2.7917 a gallon at 1:28 p.m. on the New York Mercantile Exchange. Trading volume was 18% above the 100-day average for the time of day.

The Standard & Poor’s GSCI Index of 24 materials dropped 2.9% as the dollar rose against its 16 most-traded peers, reducing the investment appeal of commodities. July crude futures sank 3.1%.

Commodities Liquidation

“We’re seeing liquidation across the board in commodities,” said Andrew Lebow, a senior vice president at Jefferies Bache LLC in New York. “Obviously, the market was not anticipating a clear-cut timeline.”

Bernanke told reporters yesterday that the Fed will probably pare its $85 billion in monthly bond purchasing later in 2013 and end its quantitative easing program altogether around mid-2014. Bernanke said curbs to bond buying hinge on gains in the labor market and a pickup in growth.

The People’s Bank of China added 50 billion yuan ($8.2 billion) to the financial system today after a cash squeeze drove money-market rates to record highs, said Hao Hong, chief China strategist at Bank of Communications Co.

A preliminary reading of China’s Purchasing Manager’s Index for June dropped to 48.3, compared with the 49.1 median estimate in a Bloomberg News survey of 15 economists. In the U.S., factories in the Philadelphia region grew in June at the fastest pace in two years.

“U.S. manufacturing is potentially about to turn the corner but the global data is not getting better,” said Jason Schenker, president of Prestige Economics LLC, an Austin, Texas- based energy consultant. “And a lot of folks are going to read Bernanke’s statements as a blueprint for the end of quantitative easing. There’s just a great deal of uncertainty.”

Crack Spreads

Gasoline’s crack spread versus West Texas Intermediate narrowed $1.29 to $21.95 a barrel. Gasoline’s premium over August Brent fell 62 cents to $14.36.

Gasoline at the pump, averaged nationwide, fell 0.5 cent to $3.598 a gallon, Heathrow, Florida-based AAA said today on its website. Prices have fallen for eight straight days to the lowest level since May 14.

Ultra-low-sulfur diesel for July delivery fell 9.29 cents, or 3.1%, to $2.8796 a gallon on trading volume that was 3.7% below the 100-day average.

ULSD’s crack spread versus WTI fell 99 cents to $25.62 a barrel. The premium over Brent declined 34 cents to $18.44.

See the original article >>

Should Italy Quit the Euro?

by Roberto Orsi

This question is certainly worth exploring, not so much perhaps in sheer terms of policy options, as it will be argued, but especially because of the challenge that it represents against the background of the substantial immobilism displayed by European decision makers, at all levels, during the crisis.

After years of persistent deterioration of Italy’s economy, it is no surprise that, as in other countries of the Eurozone, the search for possible solutions to the on-going crisis has led to the emergence of a debate about the prospect of leaving the Eurozone and re-introducing a national currency. The debate mirrors the polarisation of the sentiments expressed by Italians towards the common currency, which have never been entirely positive. Still, today, eleven years after its introduction as physical currency (1st January 2002), the memory of the perceived sudden rise in many consumer goods prices has made the euro appear as the culprit of the steady decline in the purchasing power of Italian consumers.

Recent opinion surveys show that, as in other countries of the Eurozone, there is a sizable sector of the population, currently about 20%, that endorses leaving the euro as the way forward in order to re-start the economy. A more thorough articulation of this policy option has been articulated by a relatively small group of economists and economic journalists, mainly Alberto Bagnai, Alberto Bisin and the controversial Paolo Barnard. Others, such as Loretta Napoleoni, have been advocating the break-up of the euro into two currencies, with a euro-2 for the southern economies. These positions are related to the critical views often expressed by leading economists, such as Joseph Stiglitz and Paul Krugman, and by the strategic analyst Edward Luttwak, about the damaging consequences of austerity policies and the opportunity of either re-thinking the whole system, or proceeding with some consensual divorce, perhaps with a German exit. Luttwak has recently articulated the view that, despite a high price to be paid in terms of domestic restructuring, Italy would be better off, in the long run, outside the Eurozone.

Those who argue for exiting the Euro base their position on a bleak reading of Italy’s position within the Eurozone and of its future. Essentially, Italy has been penalised by a combination of excessively high exchange rates against the rest of the world (thus depressing exports), the original exchange rate of 1,936.27 lire for one euro represented an over-valued lira, and the German socio-economic dumping (Hartz IV reforms and German industrial restructuring in the mid 2000s). The Euro-system is also constraining the capability of the Italian state to finance itself as austerity policies ban higher deficits and the rapid expansion of the monetary base (quantitative easing), as current enacted of the Federal Reserve, the Bank of Japan and the Bank of England. Exiting the euro and adopting a new national currency would allow a 20% devaluation, boosting exports and re-establishing the competitiveness of manufacturing. It would also allow quantitative easing and a more aggressive policy of public spending, partially by means of monetisation. Of course, the Italian public debt (currently among the largest in the world at €2,000 billion) would have to be immediately re-denominated in the new currency.

However, these positions have encountered a barrage of criticisms. Firstly, it appears that they underestimate the legal and political implications of exiting the euro. The prevalent interpretation of the EU treaties affirms that the euro is an irreversible monetary union, as also stated by Mario Draghi, and that the only way to leave would be to leave the EU entirely. But that in itself would require a couple of years. Secondly, even ignoring the legal procedures for a euro-exit, the timing of a currency switch may not be as short as it seems: if it took years of preparation to introduce the euro, it would take years to introduce a new national currency, from printing the notes and minting the coins, to updating the whole financial infrastructure. Feasibility aside, it seems very unlikely that Italian political leaders, who have not managed to introduce any substantial reform for decades, would be suddenly capable of a such bold step.

But the most important point of critique is centred on the economic consequences of the exit. As excellently summarised by Stefano Bassi, author of one of the most widely read economic blogs in Italy, the supporters of this policy option are severely misreading the context in which the country has to operate and compete. While it is true that periodical devaluations of the lira helped Italian exports in the past, today’s world is radically different from that of even the last wave of devaluations in 1992-1994. Italy’s international position has severely degraded in terms of export competitiveness, financial outlook, and demographics. Within a globalised economic environment, the problem is not so much about compressing the cost of labour, but the organisation of efficient production chains, which are indeed mostly globalised. This means that even goods manufactured in Italy are no longer entirely produced in the country, but are more often assembled with components coming from different parts of the world, components which need to be imported, especially if the country intends to specialise in high-tech goods (other manufacturing has already left for Asia and various developing countries). Devaluing the currency will therefore make imports more expensive, further degrading Italy’s competitiveness as a place for industrial business. It is also questionable whether Italy needs any currency devaluation, at a time in which the average Italian wage (after tax) is already among the lowest in Western Europe. Indeed, looking at the historical experiences of Russia in 1998 and Argentina in 2001, massive currency devaluations have a dramatic impact on the standard of living of the population, with severe social and political consequences, which may last for decades. Besides, the proponents of exiting the euro underestimate the power of financial markets, which is far more pervasive than in 1992-1994. And even then, despite the monetary sovereignty of the nation, the Bank of Italy did not manage to defend the lira against speculative attacks.

With a debt-to-GDP ratio of 130%, it would be unimaginable to keep it denominated in euros, while switching to a devalued currency as interest payments would push Italy to default at once. On the other hand, re-denominating the debt in a different currency would be a de facto default, with very severe consequences for Italy and the whole financial structure of Europe and beyond.

These positions seem to be based on the illusion that today’s Italy is still the same as in 1992, while unfortunately Italy is in much worse shape than twenty years ago, when not only the country, but the whole world around it was completely different. In the Bel Paese there is a severe underestimation of how much the world has changed during a long period (1995-2007), when the global economy has been completely transformed, new industrial powers have emerged, consumer patterns have shifted, while Italy has found itself in a long stagnation, with no socio-economic reforms, and political leaders quarrelling exclusively about their own personal and/or party interests.

There is however a legitimacy in the position of those who advocate an exit. The euro does indeed work as a straightjacket for many economies in Europe. The common perception is, quite correctly, that something has to be done about it. Exiting the euro is, however, not the right response. But expecting that the problems will solve themselves, as is the case in the on-going Euro crisis, is not the right response either. The euro and its member states – Italy in the first place – need profound reforms. The question is therefore not “should Italy quit the euro?” but “how can we restructure Italy, and Europe?”, by addressing urgent issues in industrial development, demography, geostrategic positioning, global financial market regulations, without which we are all (including the Northern Europeans) on a path to nowhere. This may demand a quite dramatic shift in the political culture of the EU leadership, which unfortunately is unlikely to emerge soon.

See the original article >>

VIX and SPX During the 1994 Interest Rate Hike Cycle

by Bill Luby

With yesterday’s The VIX and the Pre-FOMC + Post-FOMC Trades post in the books, it occurred to me that my reference to the series of interest rate hikes in 1994 probably stretches back before the memory banks of the current generation of investors. So with all the anxiety about Fed tapering and ultimately ending quantitative easing, I thought this might be a good time to review what happened to stocks and volatility when the Fed embarked upon a series of interest rate hikes that took the financial community by surprise.

To set the context, the 1990s started out with a recession that coincided with the first Gulf War and a corresponding sharp rise in oil prices. The Fed had been gradually lowering interest rates from 1989 – 1992 and this helped to create an environment that favored a recovery, but this recovery took some time to gain traction and did not get going until 1991. The stock market fared better than the economy during this period; after a down year in 1990, stocks rallied to post gains in 1991, 1992 and 1993. After a strong January for stocks, 1994 appeared to be on a similar path to success.

It was at this point that Federal Reserve Chairman Alan Greenspan decided to remove the proverbial punch bowl before the party got out of hand and on February 4, 1994, the Fed surprised the markets by announcing a 0.25% increase in the federal funds rate. By the time 1994 was over, the Fed had raised interest rates on six different occasions. As the chart below shows, the first three raises were 0.25% increases in the federal funds rate, but the incremental size of the raises increased to 0.50% and eventually 0.75% later in the year and were supplemented by increases in the federal discount rate, which also grew from 0.50% to 0.75%. By the time 1994 was in the books, the federal funds rate had jumped from 3.00% to 5.50% and the federal discount rate had risen from 3.00% to 4.75%. (The rate hike cycle finally ended on February 1, 1995, when the Fed raised the federal funds rate to 6.00% and the federal discount rate to 5.25%.)

Keep in mind that Alan Greenspan did not believe in signaling the Fed’s intentions in those days; on the contrary, he was a master of obfuscation and his cryptic and often ambiguous language typically kept investors in the dark about his intentions. For this reason, it was difficult for the markets to anticipate the Fed’s next move and investors we not necessarily prepared for subsequent interest rate hikes.

How did the financial markets respond to what amounted to almost a doubling of the federal funds rate and an increase of more than 50% in the federal discount rate? With a lot less volatility than one might imagine. The average closing value of the VIX was 13.93 in 1994, little different than the 13.90 average for the VIX in 2013. While the VIX did spike all the way up to 28.30 on April 4th, the VIX only closed above 20.00 on two days during the entire year! The S&P 500 index ended the year with a small loss (a small gain if dividends were to be included in the calculations), but roared back with gains of 34%, 20%, 31%, 27% and 20% in the subsequent five years.

[source(s): StockCharts.com, Federal Reserve Bank of New York, VIX and More]

The series of rate hikes did dramatically change the yield curve, as the chart below illustrates. The more dramatic moves were at the front end of the terms structure, with the curve essentially flat from two years through thirty years by the end of 1994.

[source(s): Wall Street Journal / SmartMoney]

So while Robin Harding’s Fed Likely to Signal Tapering Move is Close article in the Financial Times yesterday (and his subsequent tweet, “The Fed does not leak anything to any journalist to steer markets - especially during blackout”) may have given investors an opportunity for a dress rehearsal for the ultimate tapering, the historical record from 1994 suggests that tapering fears may be exaggerating how the QE end game will ultimately play out.

See the original article >>

Like it or not, you too have exposure to emerging markets

by SoberLook

We've received an e-mail recently with the following question (paraphrased):

"I am a US-based retail investor. I have no positions in emerging markets - why should I care about places like Brazil [discussed here] or China [discussed here]?"
Here are two reasons (among others) that should get you interested in the events taking place in emerging markets - particularly the BRIC nations:
1. BRIC nations have been buyers of massive amounts of US treasuries. As their growth slows down and current account surplus declines, so will their purchases of US treasuries. The other large buyer of US treasuries just announced yesterday that their buying days may be over some time next year. What do you think happens to US interest rates? Mortgage rates? Dividend stock valuations?

Source: Sandler O'Neill

2. Take a look at the US exports to BRIC nations over time as percentage to total exports. These nations' economic growth will have a direct and very real effect on US corporations (enjoy your CAT or BA shares while you can), jobs in the US, and the US economy as a whole.

Source: Bloomberg

So as an American investor, when you see the Indian rupee sell-off to record lows as panicked investors  move dollars out of the country (chart below), you should be concerned. Whether you like it or not, you have exposure to emerging markets.

USD/INR (Indian rupees per one dollar)

See the original article >>

Deflation: The Fed's Real Worry

by Lance Roberts

In yesterday's FOMC statement there was a particular emphasis placed on inflation, or generally the lack thereof.  As I discussed recently in "What Inflation Says About Bonds & The Fed" I stated that:

"[The] wave of disinflation continues to be much more prevalent than previously expected.  The latest inflation readings (both the Producer and Consumer Price Indices) show deflationary forces still at work. The core reading for PPI declined in May to 1.6% while CPI remained flat at 1.7%.  However, PPI and CPI mask the true economic pressures on the consumer as wage growth remains stagnant, economic production is stalling and price pressures are falling.  More importantly, there are downward pressures on the most economically sensitive commodities such as oil, copper and lumber which indicate weaker levels of economic output both domestically and globally.  The battle against the deflationary economic pressures has been what the Federal Reserve has been forced to fight since the financial crisis."

Inflation-Composite-Index-061813

The Fed's biggest fear has always been the fear of deflation as it erodes economic prosperity over the longer term.   Furthermore, outright deflation is a very hard cycle to break as it becomes embedded in the consumer psychology.  In yesterday's FOMC statement Bernanke repeatedly issued assurances that in the longer term view that inflationary pressures will rise to the Federal Reserves goal of 2%.  However, as I showed in "Fed's Projections: Myth Vs. Reality" even their own projections of inflation have been significantly lowered for 2013 from 1.65% in March to just 1.15% in June.

However, Bill Gross, picked up on this idea yesterday during his interview on CNBC stating:

"I think the Chairman is almost deathly afraid and we have witnessed in speeches going back five or 10 years on the part of the chairman in terms of the helicopter speech and the reference not only to the depression but to the lost decades in Japan. I think he is deathly afraid of deflation. As we meander back and forth around the 1% level, I would suggest that the chairman, to the extent that he perhaps has a limited time left in terms of being the Chairman, that he would guide the committee towards not only an unemployment rate which has been emphasized in terms of the Q&A but also towards a higher inflation target, which is really a target. It's not something in terms of a cap, but the inflation target of 2% and for the next year or two, 2.5% has been specifically delineated in terms of that. It's a target. Those who think it is a cap and we are 1% below the cap and therefore the Fed doesn't care about it, I think the chairman told us the Fed does care about it and the closer we get to 2%, the better as far as he's concerned."

In other words, this low inflation we're getting is not a good thing and the Fed wants higher inflation.  Low inflation as discussed drags on economic growth, wages, living standards.  Of course, this is why we also saw the Fed guide down their estimates for economic growth this year from 2.6% to 2.5% even though the majority of economists estimates are still considerably higher than that.   The question that no one has yet to answer is exactly where that economic growth is going to come from given the fact that we are seeing year over year declines in the rate of growth as discussed in "3 Reasons Stocks May Stumble Despite Fed."

"The economy is currently pushing a third straight quarter of sub-2% growth with the Federal Reserve discussing taking away a major support for the economy.  The extraction of liquidity from the system will stem the forward pull of future consumption, which has come at the expense of higher credit balances and lower personal savings rates for consumers, leading to weaker rates of economic growth."

The other problem of low, and falling, inflationary pressures is the effect on interest rates.  This is what Gross had to say on the issue:

"I think they are missing the influence on inflation that obviously the chairman has considered and perhaps the committee as well. There was a question and Q&A that basically said, Mr. Chairman, if we are down at 1% inflation and it doesn't rise, then real interest rates are in a quandary to which you have limited flexibility, and he said, I agree completely with the premise of your question."

That limited flexibility, as we have discussed numerous times as of late, is the same "Liquidity Trap" that Japan has been locked into for more than a decade.  Low rates of inflation, or disinflation, keeps the Federal Reserve from raising interest rates.  If the Fed tries to raise the overnight lending rate it slows the economy.  The chart below shows the Fed Funds rate as compared to GDP.  Notice that each time the Fed Funds rate rises it coincides with a decline in economic growth.  Exactly how is the Fed supposed to remove their "accommodative policy" when the economy is growing at a sub-par rate.  Furthermore, given that we are already 48 months into the current post-recession expansion, we are closer to the next economic contraction rather than an expansionary boom.

Fed-Funds-GDP-061813

Therefore, while the Fed says they expect to keep accommodative policy in place through 2014, the reality is that without an inflationary push caused by a strengthening economy it is likely they will forced to keep rates suppressed for much longer than intended.  Monetary policy is not a driver of economic growth and there are huge assumptions being made that by the end of 2013 the effects of the "Fiscal Cliff" deal will have passed.  The problem is that higher tax rates are here to stay, which drags on consumption, and the impact of the (Un)Affordable Care Act are just beginning to be felt as implementation begins with exchanges in October and the full brunt of the ACA hits in 2014.  Businesses are already rapidly downsizing staff, cutting hours and shifting full-time labor to temporary and part-time to reduce the impact of higher health care costs on profits.

I agree with Gross's sentiment on the outlook for the economy in the months ahead:

"We think the chairman and the Fed are taking a very much of a cyclical type of view. He blames lower growth on fiscal austerity and expects towards the end of the year once that is gone, all of the sudden the economy will be growing at 3%. He blames housing prices moving up on homeowners that simply like higher home prices as opposed to emphasizing the mortgage rate, which is really what has provided the lift in the first place. To a certain extent his driving analogy, which he talked about pulling back on the accelerator, I think he might be driving in a fog. I think the Fed itself may be driving in a fog. To think that is a cyclical as opposed to a structural problem in terms of our economy. I simply think and PIMCO thinks that real growth to lower unemployment below 7% is a long shot over the next 6, 12, 18 months."

Bill is absolutely correct in that the current problem with the economy is a structural one.  This is why the Fed's own growth projections continue to decline from one meeting to the next as the onslaught of misguided fiscal policies, increased regulations and higher taxes erodes economic prosperity.

See the original article >>

VXEEM as a Measure of Emerging Markets Volatility and Risk

by Bill Luby

If you think U.S. stocks have been through a rough patch as of late, then you haven’t been paying attention to emerging markets stocks, where the popular EEM emerging markets ETF as fallen from a high of 42.96 on May 22nd to 37.02 earlier today – a 13.8% drop in less than one month. A large part of the problem has been the performance of the BRIC countries, where Brazil (EWZ), China (FXI) and India (EPI) are all acting as if they have been thrown overboard with anchors tied to their ankles, making Russia (RSX) look like the most stable investment of the group – which is quite a task.

Investors looking to monitor risk and uncertainty in Brazil and China are fortunate enough to have dedicated volatility indices based on the VIX methodology for EWZ and FXI. These volatility indices were created by the CBOE and use the tickers VXEWZ and VXFXI, respectively. For a more holistic view of risk and uncertainty in the emerging markets space, the best choice is probably VXEEM, the CBOE Emerging Markets ETF Volatility Index that is calculated based on options in EEM.

The chart below shows the relative performance of VXEEM and the VIX going back to the end of October 2012. Note that during toward the end of 2012, the debate over sequestration caused the markets to assign much more additional risk and uncertainty to U.S. stocks than to emerging markets stocks. During the course of the last month or two, this relationship has reversed and the risk and uncertainty associated with VXEEM has grown at a much faster rate than that of the VIX. On average, the absolute level of VXEEM is about 40% higher than that of the VIX. This week, however, VXEEM has been about 60% higher than the VIX.

On a related note, I find it interesting that S&P announced the launch of the S&P Emerging Markets Volatility Short-Term Futures Index just ten days ago. With that index in place, it would be relatively easy to create a futures-based emerging markets volatility ETP that would function in the same manner as VXX, but be based on VXEEM rather than the VIX. The biggest obstacle to this type of product is probably the current lack of liquidity in the VXEEM futures market.

[source(s): Google Finance]

See the original article >>

Gold and Silver Stocks Cold Hard Look at the Unfolding Carnage

By: Rambus_Chartology

Before we look at the charts tonight I just want to make it perfectly clear that I’m not a gold basher or wish for bad things to happen to the precious metals complex. I first found the bull market in the precious metals stocks in the spring of 2002 after having the ride of a lifetime trading the tech stocks up until the spring of 2000 where I cashed out based on a particular chart pattern that told me to either expect a decent consolidation period to begin or it was the end of one of the greatest bull markets in history. It didn’t take long to see a major top had formed and the place to be was on the sidelines. During that great run in the late 1990′s the precious metals stocks were not even close to being on my radar screen. It wasn’t until I looked at a long term chart for gold, in the spring of 2002, that I seen a beautiful inverse H&S base that I couldn’t ignore. I didn’t know anything about the precious metals stocks at that time but with that beautiful H&S base I knew some of the precious metals stocks had to have a bullish look to them as well. I learned about the little juniors that everyone, who was connected to the precious metal complex, were talking about. This was game on for me and I have traded exclusively in the precious metals complex for the last eleven years. The chart patterns that gold, silver and the HUI created during their bull market were some of the most beautiful patterns a chartists like myself could ever expect to see.

Before we look at the charts tonight I just want to make it perfectly clear that I’m not a gold basher or wish for bad things to happen to the precious metals complex. I first found the bull market in the precious metals stocks in the spring of 2002 after having the ride of a lifetime trading the tech stocks up until the spring of 2000 where I cashed out based on a particular chart pattern that told me to either expect a decent consolidation period to begin or it was the end of one of the greatest bull markets in history. It didn’t take long to see a major top had formed and the place to be was on the sidelines. During that great run in the late 1990′s the precious metals stocks were not even close to being on my radar screen. It wasn’t until I looked at a long term chart for gold, in the spring of 2002, that I seen a beautiful inverse H&S base that I couldn’t ignore. I didn’t know anything about the precious metals stocks at that time but with that beautiful H&S base I knew some of the precious metals stocks had to have a bullish look to them as well. I learned about the little juniors that everyone, who was connected to the precious metal complex, were talking about. This was game on for me and I have traded exclusively in the precious metals complex for the last eleven years. The chart patterns that gold, silver and the HUI created during their bull market were some of the most beautiful patterns a chartists like myself could ever expect to see.

The reason I’m telling you this is because what the precious metals charts have been showing me is that, like the 1990′s bull market, the precious metals complex has topped out and is now in a confirmed downtrend. How long and how far down this complex will go is any bodies guess. All I know for sure is the 13 year uptrend has topped and is now making lower highs and lower lows which is by definition a downtrend. I hope when you finish reading this article you will have a crystal clear picture of the bull market and the top that has been in place for some time now.

Tonight I would like to show you some charts of the HUI using it as a proxy for the big cap precious metals stocks. We will start out with the very short term look and work our way out to the beginning of the bull market that began in 2001 or so.

This first chart for the HUI is a 30 minute look that shows the latest consolidation pattern that has formed since the top last fall. This consolidation pattern I call, an expanding falling wedge, because the top and bottom blue rails are widening and falling. It started out as a small triangle, labeled with the red numbers and has morphed into its current form. Most chartists won’t recognize some of my chart patterns and will tell me to go back to charting school to learn the right way to chart. I have been doing this for 35 plus years using the Edwards and Magee Technical Analysis of Stock Trends as my charting bible. I have taken what they have given me and added my own unique style that you will recognize when you see a Rambus Chart.

I won’t get into the details right here just to say when I build out a consolidation pattern I need to see an even number of reversal points, such as 4, 6, 8 or more for it to be valid. A top or bottom needs to have an odd number of reversal points to make a reversal pattern. As you can see on the chart below the HUI is working on its 4th reversal point to the downside. The pattern won’t be complete until the bottom blue rail is hit and at that point I can call it a consolidation pattern. Right now it’s still in the developmental stage. The heavy blue trendlines shows what I think will end up being that bearish expanding falling wedge consolidation pattern when it’s all said and done as I will show you further along in this article.

Lets now look at a daily chart to put our little bearish expanding falling wedge into perspective. What you will also see on this daily chart are three more consolidation patterns that you won’t see most chartists use but they are just as valid and useful as any other traditional consolidation pattern. Also what makes the HUI so negative looking is each consolidation pattern is sloping down into the downtrend. Under normal conditions, in a downtrend for instance, a small flag or wedge will slope up against the downtrend. When I see a consolidation pattern sloping in the same direction of the trend, it tells me the price action is in a hurry to go to the next level and when I see one form after the other in a series that tells me all hell is breaking loose.

What I have shown you on the charts above is only the tip of the iceberg that just shows the right shoulder of a massive H&S topping pattern. Many times a consolidation pattern can be made up of several smaller patterns that ends up creating the finish product. This next chart is a long term daily chart for the HUI that shows the massive H&S top formation. What I would like you to note is the 11 point diamond reversal pattern that makes up the head portion of the massive H&S top. As I mentioned earlier in this article some of the chart patterns you see will only be found at Rambus Chartology.

Lets look at a few weekly charts to gain a little more perspective in what has and is happening with the precious metals stocks. This long term weekly chart shows the big H&S top that has reversed the uptrend that started off the 2008 crash low. This weekly chart is a cleaned up version, of the many looks this H&S top has, so you can see it in all its glory. There is an important feature on this chart that happened about 2 months ago when gold and silver broke below their 20 month rectangles, that we’ll discuss at a later date, and that is the big halfway gap, brown shaded area. Most have forgotten about that gap but it;s going to play a big role in the price action going forward as the HUI was unable to close it. There is another important feature on this weekly chart and that is the 2008 H&S top that most missed at the time. You can’t believe the amount of flack I took when I called that top. It was pure blasphemy to call a top in the HUI. How dare some one say something like that. When you say something the gold bugs don’t like you had better have all your ducks lined up because if your wrong your going to be a dead duck. Fortunately for me things worked out and I was spared to chart another day.

Deja Vu ?

http://rambus1.com/?p=1829

Early in this article I said the precious metals complex, stocks and metals, produced some of the best looking chart patterns a chartists will see. Below is another long term weekly chart for the HUI that shows the beginning of its bull market and four beautiful consolidation patterns that formed until the 2008 H&S top called for an end to that leg of the bull market. Note the move out of each blue consolidation pattern that was an impulse leg higher. That is what a true bull market looks like. One consolidation pattern followed by an impulse move up followed by another consolidation pattern until a top is finally found and a well need rest takes place.

Symmetry plays a big role in how I view a chart especially in fast moving markets. This next chart shows the reverse symmetry that is taking place to the downside that is reversing the rally off the 2008 crash low. The two black rectangles are exactly the same size in height and width. I don’t know if the reverse symmetry down will be perfect and reach the bottom in October of this year but so far it has proven to be dead on the money since I first built this chart back in January of this year. Only time will tell but so far so good.

I would like to show you another form of symmetry that has to do with the halfway gap I showed you earlier and how it may play a big role moving forward. If that gap is truly a halfway gap, that shows up in the middle of a strong move, it will be confirming the October time and price objective that I showed you on the chart above. This time we are using two black rectangles that are exactly the same height and width that I’m measuring the halfway gap with. Again I don’t know how it will play out but so far its been working out better than I had expected when I first built this chart. As long as nothing is broken there is no need to fix it. So we’ll just have to see how it plays out. It is uncanny how one can come up with a time and price objective using two completely different methods. Sometimes the markets are stranger than fiction as you well know.

I would like to leave you with one last chart that doesn’t have anything to do with the precious metals stocks. At the beginning of this article I said there was a chart pattern that formed at the end of one of the greatest bull markets of all time. I know when some of you read that you were probably thinking ya right this guy is full of himself calling a top to an 18 year bull market. I only bring this up because chart patterns can give you the clearest view of the markets of any discipline I know. There are excellent Elliot Wave guys and cycles guys and many other forms of analysis that work very well for those that truly understand what they are doing. Charting gives me a way to follow the price action, and done correctly, keeps me out of trouble as so many in the precious metals complex are finding out again. I’m still amazed at how such an old school of charting the markets competes right up there with the best computer programs that are trying to get an edge on you.

Below is the weekly chart for the COMPQ that gave me one of the biggest clues of my life that it was time to really consider what was happening at the time. For those of you that traded during the tech bubble you know how super bullish the hype was and how hard it was to emotionally distance yourself from all the noise. Can we say the same thing about the precious metals complex right now? Only time will tell. All the best…Rambus

Editor’s Note :

Rambus Chartology is Primarily a Goldbug TA Site where you can watch Rambus follow the markets on a daily basis and learn a great deal of Hands on Chartology from Rambus Tutorials and Question and Answers .
Most Members are Staunch Goldbugs who have seen Rambus in action from the 2007 to 2008 period … and now Here at Rambus Chartology since early 2012 .

You will find Rambus to be a calm humble down home country tutor with an incredible toolbag of all the TA based protocols tempered with his own one of a kind style…simply put…He wants to keep his subscribers on the right side of these crazy volatile and downright dangerous markets

What is he seeing Now ?

All the best

See the original article >>

Market Spooked as Fed Eyes Tapering

By Central Bank News

The U.S. Federal Reserve maintained its target for purchasing assets worth $85 billion a month but turned slightly more optimistic about the economic outlook and plans to cut back it asset purchases later this year, saying downside risks to the economy had diminished.
     While the Federal Reserve maintained its statement on how and when it may begin to reduce its asset purchases - an issue that has roiled global financial markets since late May - Chairman Ben Bernanke later told a press conference that purchases would be cut back later this year if the economy continues to improve.
    "The Committee currently anticipates that it would be appropriate to moderate the monthly pace of purchases later this year; and if the subsequent data remain broadly aligned with our current expectations for the economy, we would continue to reduce the pace of purchases in measured steps through the first half of next year, ending purchases around midyear," Bernanke said.
    At that point, Bernanke said he expects the unemployment rate to be around 7.0 percent and solid economic growth supporting further improvement, he said.
    Bernanke, however, noted that the Federal Reserve was not fixed on any dates and if  "conditions improve faster than expected, the pace of asset purchases could be reduced more quickly." Conversely, if the economic outlook deteriorates, the reductions in purchases could be delayed.

    The Federal Reserve's policy-making body, the Federal Open Market Committee (FOMC) repeated from its May statement that U.S. economic activity was expanding at "a moderate pace" with labor market conditions improving but the unemployment rate remains elevated. Household spending, business investment and the housing sector has strengthened further, "but fiscal policy is restraining economic growth."
    "The Committee sees the downside risks to the outlook for the economy and the labor market as having diminished since the fall," the Federal Reserve said, a slightly more optimistic view compared with May when it said that it "continues to see downside risks to the economic outlook."
    In its latest economic forecast, the Federal Reserve forecasts the unemployment rate to ease to between 7.2-7.3 percent this year, slightly down from the March forecast of 7.3-7.5 percent, and then to decline further to 6.5-6.8 percent in 2014, down from its previous forecast of 6.7-7.0 percent. In 2015 the Federal Reserve forecast unemployment of 5.8-6.2 percent, down from 6.0-6.5 percent.
    Unlike most central bank's, the Federal Reserve is mandated to foster maximum employment and price stability, and intends to keep its key policy rate, the federal fund's rate, at zero to 0.25 percent "at least as long as the unemployment rate remains above 6-1/2 percent," and inflation does not exceed the central bank's 2.0 percent goal by more than half a percentage point.  
     The U.S. unemployment rate inched up to 7.6 percent in May from 7.5 percent in April, but it has been declining steadily from over 9 percent. The inflation rate rose to 1.4 percent in May from 1.1 percent in April and is forecast by the Federal Reserve to remain below 2.0 percent through 2015.
    The forecast for economic growth this year was trimmed to between 2.3 and 2.6 percent, down from the March forecast of 2.3-2.8 percent but the 2014 forecast for Gross Domestic Product growth was raised slightly to 3.0-3.5 percent from a previous 2.9-3.4 percent while the 2015 forecast was trimmed to 2.9-3.6 percent from 2.9-3.7 percent.
    In the first quarter of this year, the U.S. GDP expanded by a quarterly 2.4 percent for annual growth of 1.8 percent, up from 1.7 percent in the fourth quarter of last year.
    In testimony to the a U.S. congressional committee on May 22, Federal Reserve Chairman Ben Bernanke said the central bank could "in the next few meetings take a step back in our pace of purchases," igniting speculation about a tightening of U.S. monetary policy and triggering an outflow of capital from emerging markets that had benefitted from the low cost of U.S. funds and the injection of fresh funds through quantitative easing.
    But the Federal Reserve stuck to its previous script, saying it would continue with its monthly purchases of $40 billion worth of mortgage-backed securities and $45 billion of longer-term Treasuries "until the outlook for the labor market has improved substantially in the context of price stability."
    The purchases of Treasuries and mortgage-backed debt aims to maintain downward pressure on long-term interest rates and support the housing market, helping stimulate economic activity.
    Following Bernanke's testimony, interest rates in the United States and most emerging markets have moved higher as investors anticipated a reduction in U.S. purchases of Treasury bonds.
    The FOMC also repeated that it was ready to increase or decrease the pace of its bond and security purchases as the outlook for inflation or the labor market changes.
    "While participants continue to think that, in the long run, the Federal Reserve’s portfolio should consist predominantly of Treasury securities, a strong majority now expects that the Committee will not sell agency mortgage- backed securities (MBS) during the process of normalizing monetary policy, although in the longer run limited sales could be used to reduce or eliminate residual MBS holdings," Bernanke told journalists.

See the original article >>

Sugar finds strength as Brazil uses more sugar for ethanol

By Jack Scoville

SUGAR

General Comments: Futures closed higher on reports from private analysts that Brazil will use sugar to produce ethanol and use less to produce sugar. The same service said that more pests are hurting the next production. The market closed strong and could work higher in the short term, but is expected to find plenty of selling on the rally. Traders remain bearish on ideas of big supplies, especially from Brazil. Traders in Brazil expect big production as the weather is good. Demand is said to be strong from North Africa and the Middle East. ICE said that a Sugar storage facility in Paranagua, Brazil, was damaged by fire this week and that deliveries could be affected.

Overnight News: Showers are expected in Brazil, mostly in the south and southwest. Temperatures should average near to above normal.

Chart Trends: Trends in New York are up with objectives of 1770 and 1820 October. Support is at 1700, 1680, and 1665 October, and resistance is at 1760, 1790, and 1820 October. Trends in London are up with objectives of 495.00 October. Support is at 480.00, 472.00, and 469.00 October, and resistance is at 487.00, 491.00, and 494.00 October.

COTTON

General Comments: Futures were lower again on what appeared to be long liquidation from speculators and perhaps some farm selling. Ideas of better weather in production areas were once again negative for prices. Some storms are moving through western Texas and conditions there are improving. Good weather is being reported in the Delta and Southeast as well. The weather has improved, and looks to improve conditions generally through the rest of the week. Scattered showers are forecast for the Delta and Southeast, and wetter and warm weather is expected in Texas. Weather for Cotton appears good in India, Pakistan, and China. It is possible that futures made at least a short term high on Friday.

Overnight News: The Delta and Southeast will see some showers this weekend. Temperatures will average above normal. Texas will get showers today, and then dry weather. Temperatures will average above normal. The USDA spot price is now 82.49 ct/lb. ICE said that certified Cotton stocks are now 0.550 million bales, from 0.545 million yesterday. USDA said that net Upland Cotton export sales were 69,800 bales this year and 81,400 bales next year. Net Pima sales were 1,200 bales this year and 0 bales next year.

Chart Trends: Trends in Cotton are mixed to down with no objectives. Support is at 86.50, 85.60, and 84.75 October, with resistance of 88.20, 89.60, and 90.10 October.

FCOJ

General Comments: Futures closed lower again on forecasts for more showers into next week. Futures have been working generally lower as showers have been seen and conditions are said to have improved in almost the entire state. Ideas are that the better precipitation will help trees fight the greening disease. Traders are wrestling with more reports of losses from greening disease on the one side and beneficial rains that have hit the state on the other. Greening disease and what it might mean to production prospects continues to be a primary support item and will be for several years. Temperatures are warm in the state, but there are showers reported somewhere in the state every day now. The Valencia harvest is continuing. Brazil is seeing near to above normal temperatures and mostly dry weather.

Overnight News: Florida weather forecasts call for showers. Temperatures will average near to above normal.

Chart Trends: Trends in FCOJ are down with objectives of 141.00, 133.00, and 130.00 July. Support is at 139.00, 137.50, and 136.00 July, with resistance at 145.00, 150.00, and 154.00 July.

COFFEE

General Comments: Futures were higher in reaction to news from Brazil about the government support for producers. Many think it will be enough to keep Coffee in warehouses and off the market. Interest has left the market in many ways, as many feel prices are too low to sell short again, but there are few who see any reasons to buy for the longer term. Arabica cash markets remain quiet right now and Robusta selling interest has become less, as well. Most sellers, including Brazil, are quiet and are waiting for futures to move higher. Buyers are interested on cheap differentials, and might start to force the issue if prices hold and start to move higher in the short term. Brazil weather is forecast to show dry conditions, but no cold weather. There are some forecasts for cold weather to develop in Brazil early next week, but so far the market is not concerned. Current crop development is still good this year in Brazil. Central America crops are seeing good rains now. Colombia is reported to have good conditions.

Overnight News: Certified stocks are little changed today and are about 2.747 million bags. The ICO composite price is now 117.32 ct/lb. Brazil should get dry weather except for some showers in the southwest. Temperatures will average near to above normal. Colombia should get scattered showers, and Central America and Mexico should get showers, with some big rains possible in central and southern Mexico and northern Central America. Temperatures should average near to above normal. ICE said that 554 delivery notices were posted against July today and that total deliveries for the month are now 554 contracts.

Chart Trends: Trends in New York are mixed. Support is at 122.00, 119.00, and 116.00 September, and resistance is at 126.00, 127.00, and 129.00 September. Trends in London are mixed to up with objectives of 1835 and 1900 September. Support is at 1765, 1730, and 1705 September, and resistance is at 1800, 1850, and 1890 September. Trends in Sao Paulo are mixed to down with no objectives. Support is at 147.00, 144.00, and 140.00 September, and resistance is at 151.00, 155.00, and 159.00 September.

COCOA

General Comments: Futures closed slightly higher in consolidation trading. There was not a lot of news for the market, and price action reflected this. Ideas of weak demand after the recent big rally kept some selling interest around. The weather is good in West Africa, with more moderate temperatures and some rains. The mid crop harvest is about over, and less than expected production along with smaller beans is reported. Malaysia and Indonesia crops appear to be in good condition and weather is called favorable.

Overnight News: Scattered showers are expected in West Africa. Temperatures will average near to above normal. Malaysia and Indonesia should see episodes of isolated showers. Temperatures should average near normal. Brazil will get mostly dry conditions and warm temperatures. ICE certified stocks are lower today at 5.047 million bags. ICE said that 0 delivery notices were posted today and that total deliveries for the month are 120 contracts.

Chart Trends: Trends in New York are down with no objectives. Support is at 2200, 2165, and 2140 September, with resistance at 2250, 2280, and 2300 September. Trends in London are down with objectives of 1380 and 1270 September. Support is at 1430, 1360, and 1320 September, with resistance at 1470, 1490, and 1520 September.

See the original article >>

Learning to live with market volatility

By Alasdair Macleod

It is approximately a month since Japanese monetary policy makers destabilized their financial markets, and triggered instability everywhere else. Emerging-market currencies have been hammered, as have European and U.S. bond and equity markets. It has not helped that the debate has now turned to how the Fed will exit its strategy of buying $85 billion of Treasury and mortgage-backed securities every month, leading to the gradual realization that there is no plan, and worse, no exit.

This is very worrying, but has been obvious from the start. The surprise is that the investing crowd has been in denial of the facts, which we can only put down to the human desire to be blind to negative outcomes. Instead, investors everywhere have been happy to believe that Mr. Bernanke knows best.

While statistics such as brokers’ loans show that equity markets have become overbought, there is not a bubble mentality in equity and bond markets: By this I mean that the wider public is not scrambling to buy in the sure-fire belief that prices are going up. It is more a case of markets being mispriced on zero interest rates and investors being complacent.

Shifts in sentiment can be very sudden under these circumstances. A good example was the 1987 October crash, when markets were over-bought and investors were enjoying the ride, rather than going mad for equities. In that case equity markets lost between 30% and 50% in a matter of days, with New Zealand falling 60%. The reasons for the October crash are disputed, but it was the first time that global equity markets were linked together by financial institutions operating in multiple markets and investment diversification across a range of these markets had become the norm.

It was for this reason that all markets crashed together. Today, we have a similar set-up, but with far greater levels of inter-dependency between markets. No financial institution recommends an investment in one country, without comparing the alternatives in others. Nor will an investment manager contemplate an investment in, say, Spanish bonds without comparing them to Germany’s or perhaps Italy’s.

While this makes eminent sense in today’s investment world, it does mean that if one market weakens it is bound to affect others. When Japanese equities began their fall, not only did it undermine other markets, but hitherto bullish investors began to consider issues that hadn’t worried them before.

There is no knowing how far the increase in bond yields and the slide in equities will go. But with all the printed currency that has ended up in financial markets, the rush for the exit could be spectacular.

This leaves gold and silver in an interesting position. Short term instability in other markets usually has unpredictable effects. Holders of physical bullion should look through these and think about the end result of a bond and equity market crash. They should ask themselves, will it be more destabilizing for gold, or for paper currencies?

And here we must think about the central banks’ response. Their immediate problem is the consequences of losses on securities held in the banking system and being used as off-balance sheet collateral in the shadow banking system. Systemically-important banks particularly in Europe are still highly geared, and falling bond prices will likely wipe some of them out. There can only be one central bank response, and that is to accelerate the provision of liquidity to the banks to avert a crisis. Furthermore, central bankers firmly believe that healthy equity markets are necessary to bolster and maintain consumer confidence, so they will also wish to intervene for this reason.

When financial markets wake up to this inevitability they will seek safe havens; and the only ones that exist are in basic commodities and precious metals. While the ride in gold has been very uncomfortable for the last 21 months, gold bugs might reflect that it has taken less than one month in other markets to produce losses on a similar scale.

As to the future, I leave you with my favorite chart, which shows that the U.S. dollar is already experiencing monetary hyper-inflation, and that is before we consider the extra money supply needed to rescue the banks and to stop market falls become self-feeding.

And that is the real reason to have some gold and silver: Currencies are on the path to self-destruction.

See the original article >>

Gold tumbles to 2 1/2 year-low after Fed as silver plummets

By Maria Kolesnikova, Nicholas Larkin and Glenys Sim

Gold fell below $1,300 an ounce to the lowest in more than 2 1/2 years in New York, exceeding April’s drop into a bear market, after Federal Reserve Chairman Ben S. Bernanke said stimulus may be reduced later this year as the economy recovers. Silver dropped to the lowest since 2010.

Bernanke said yesterday the central bank, which buys $85 billion of Treasury and mortgage debt each month, may begin reducing purchases this year and end the program in 2014 should the economy continue to improve. The dollar rose to the highest in more than a week against six major currencies and the 10-year yield on Treasuries reached a 22-month high. Commodities dropped.

Bullion slid 23% this year, heading for the biggest annual drop since 1981, as some investors lose faith in it as a store of value and as speculation grew that the Fed will taper debt-buying that helped the metal cap a 12-year bull run last year. Investors sold 520.7 metric tons valued at $21.6 billion from gold-backed exchange-traded products this year. The price slump hurt billionaire hedge fund manager John Paulson and producer Newcrest Mining Ltd.

“The markets are definitely not prepared to wait until the tapering actually begins,” said Ole Hansen, the head of commodity strategy at Saxo Bank A/S in Copenhagen. “The combination of Fed tapering, a spike in nominal yields and a stronger dollar has put gold under some considerable pressure.”

Gold Price

Bullion for August delivery sank as much as 6.5% to $1,285 on the Comex, the lowest since Sept. 28, 2010, before trading at $1,293.70 at 9:31 a.m. in New York. Futures trading volume was about 150% higher than the average in the past 100 days for this time of day, according to data compiled by Bloomberg. Gold for immediate delivery traded at $1,296.70 in London.

The metal may fall another $50 in the next few days and will probably drop to about $1,100 in a year, according to Ric Deverell, head of commodities research at Credit Suisse Group AG. Nouriel Roubini, professor of economics and international business at New York University, has forecast a decline toward $1,000 by 2015.

The Standard & Poor’s GSCI gauge of 24 commodities dropped 4.1% since the start of January, the MSCI All-Country World Index of equities rose 4.9% and the U.S. Dollar Index added 2.7%. A Bank of America Corp. index shows Treasuries lost 1.9%.

Money Printing

Gold futures as much as doubled from the end of 2008 to the record $1,923.70 in September 2011 as the Fed cut interest rates to a record low. The unprecedented money printing by central banks around the world has so far failed to spur inflation. Expectations for increases in consumer prices, as measured by the break-even rate for 10-year Treasury Inflation Protected Securities, fell 16% this year, reaching a 17-month low last week.

Newcrest Mining, Australia’s largest gold producer, said this month it will write down the value of its assets by as much as A$6 billion ($5.5 billion) after the drop in prices. Paulson, the biggest investor in the SPDR Gold Trust, the largest gold ETP, had a 13% loss in his Gold Fund last month. That takes the decline since the start of the year to 54%, according to a copy of a letter to investors obtained by Bloomberg News.

ETP Holdings

Holdings in the SPDR Gold Trust slumped 351.3 tons this year to 999.6 tons yesterday, the lowest since February 2009. Global holdings now stand at 2,111.2 tons, the least since March 2011, data compiled by Bloomberg show.

While assets dropped every month this year, gold’s slump in April spurred purchases of coins and jewelry worldwide. India, the largest consumer, raised gold import taxes earlier this month to limit demand and contain a record current-account deficit.

“We are likely to see buying coming through, but I would be surprised to see the same level as we saw in April,” Walter de Wet, an analyst at Standard Bank Plc, said today by phone from Johannesburg.

Gold may drop to $1,250 in a month, down from a previous forecast of $1,425, Joni Teves, an analyst at UBS AG in London, wrote today in a report. The bank cut its three-month outlook to $1,350 from $1,500, and lowered its 2013 estimate to $1,440 from $1,600. Prices will average $1,325 next year and $1,200 in 2015, it said.

Silver Falls

Silver tumbled 33% this year, making it the worst- performing commodity. It reached a record $49.8044 an ounce in London in April 2011 and was as low as $8.46 in October 2008. Prices could drop to $10 to $15 “in days or weeks,” according to Robin Bhar, an analyst at Societe Generale SA in London.

“There is a long way down,” Bhar said by phone today. “In an oversupplied market like silver, the price should approach cost of production.”

Silver for July delivery slid as much as 9.2% to $19.64 in New York, the lowest since September 2010, and was last at $19.805. Futures trading volume in New York was about 200% more than the average for this time of the day, data compiled by Bloomberg show.

Platinum for July delivery dropped 2.7% to $1,385.30 an ounce, the lowest since April 16. Palladium for September delivery was down 4.4% at $665.85 an ounce, the lowest since April 18.

See the original article >>

Wheat: Boring...but, never sell a dull market short

By Sholom Sanik

Over the past few months, activity in the wheat market has been subdued, especially when compared with the volatility of its counterparts in the corn and soybean pits. It has traded in a relatively narrow range of 50¢ per bushel. Traders were focusing on the extremely wet spring in the U.S., which delayed both corn and soybean planting. While spring-wheat planting was running well behind the historical norm as well, it comprises only 27% of the total U.S. wheat crop. Winter wheat, which is planted in the fall and makes up the bulk of the U.S. wheat crop, was already nearing harvest during this period.

Although it does not receive as much attention, the spring wheat crop was planted late enough for some areas to miss the planting window altogether. Last year, planting was complete before the end of May. As of the most recent weekly crop progress report, only 92% of the crop was in the ground. On the other hand, prospects for yield have improved. The weekly report showed the good-to-excellent portion of the crop jumped by 6 percentage points from the previous week, to 68%. That compares with 76% last year at this time. Last year’s growing season was marred by severe drought, however, and by the end of summer, the final crop rating dropped to 61%. So it’s too early to draw any conclusions.

The much bigger issue is the quality of the winter wheat crop. It was a harsh winter for the key winter-wheat states. As the crop emerged from dormancy, the damage was evident. The most recent weekly crop progress report shows the good-to-excellent portion of the crop at a scant 31%. That’s down from 54% at this time last year. The harvest has been slowed down by the same wet weather that has affected planting across the U.S. Only 11% of the crop has been harvested, compared with 51% at this time last year and the five-year average of 25%. U.S. production levels for the combined winter- and spring-wheat crops remain vulnerable.

The USDA was curiously optimistic in its monthly crop report. The average of analysts’ guesstimates for the winter wheat crop was just a tad under 40 million tonnes, below the May estimate of 40.5 million tonnes. But the actual figure came in at 41.1 million tonnes, surprising traders and sending new crop prices to fresh recent lows.

On May 29, Japan, one of the largest importers of U.S. wheat announced that it was canceling wheat shipments from the U.S., because of the discovery of illegal genetically modified wheat on an Oregon farm. Other importing nations, such as South Korea and Taiwan, soon joined the chorus and said they would be reviewing its U.S. orders until the situation is clarified. The media were quick to point out that the $8 billion U.S. wheat export market was at risk if mass cancellations should snowball. Monsanto, the producer of the seed in question, stopped field testing for this product in 2005, and it was never available commercially, so it was indeed a mystery as to how the seed ever surfaced. Farmers from as far away as Kansas initiated lawsuits against Monsanto, claiming that it tainted the reputation of U.S. wheat, and that as a result, they would suffer millions of dollars of lost revenues.

In the meantime, Monsanto tested 30,000 samples of seed spanning 60% of all farms in Oregon and neighboring Washington State and did not find any of the illegal seed. On June 14, the USDA confirmed the company’s findings that the only instance was the original discovery on the 123-acre farm in Oregon. Initially it seemed as though this could turn into a larger issue that would depress U.S. prices, but the most recent weekly export report showed a normal flow of new sales. A lot of noise, but a non-event.

Overall, the outlook for 2013-14 global production is not quite as exuberant as it’s been over the past few months. For the most part, output estimates for the major Northern Hemisphere winter-wheat-producing nations were revised down from their May estimates. EU production was lowered by 1.3 million tonnes, to 137.44 million tonnes, while the estimate for FSU output was cut by 4.5 million tonnes, to 102.59 million tonnes.

The estimate for global production was revised downwards by about 5 million tonnes, to 696 million tonnes, which resulted in a drop in the estimate for ending stocks to 26.1% of consumption, down from 26.8% last month. Global inventories have been in a downtrend since they peaked at 30.9% of usage in 2009-10. Nevertheless, we are still very far from the bull market years of the mid 2000s when ending stocks plummeted to 21% of usage. Unless fresh dynamics are introduced into the market – a crop failure or an unexpected surge in demand – we expect the market to continue to trade in the confines of recent ranges. One note of caution: Funds are heavily short the market and sentiment readings are at 52-week lows. While there is no compelling reason to be long, it would be downright dangerous to be short.

See the original article >>

The Bond Implosion Has Officially Begun

by Graham Summers

The QE Infinite parade officially ended yesterday when Bernanke hinted at tapering QE later this year or in mid-2014.

I first warned Private Wealth Advisory subscribers about this in mid-May writing,

If Bernanke is going to step down (as hinted by his decision to skip out on the Jackson Hole meeting) he’s not going to want to leave with the Fed going at QE 3 and QE 4 full throttle.

Instead his best bet would be to take his foot off the gas a little bit, giving his replacement a little room to maneuver if things get ugly.

Source: Private Wealth Advisory

This is precisely what Bernanke is trying to do. However, there is another far larger issue at work here.

The primary driver of stocks for the last four years has been the hope of more Fed stimulus. This hope has put a floor under ALL asset prices as market participants KNEW the Fed was involved in the markets. As a result EVERYTHING (stocks, bond commodities, even currencies) has been artificially propped.

By calling for the end to QE 3 and QE 4, the Fed has begun to remove these market props. Which means that the markets are now going to start adjusting to where assets prices REALLY SHOULD BE.

Take a look at the spike in the 10-year Treasury yield:

This is just the start. I warned Private Wealth Advisory subscribers in our most recent issue that higher rates were coming noting a collapse in bonds in Europe and the emerging market space.

This could easily become truly catastrophic. The world is in a massive debt bubble and the Central banks are now officially losing control. The stage is now set for a collapse that could make 2008 look like a joke.

See the original article >>

Crude Oil: Breakout Or Fake Out?

by Tom Aspray

The global markets have provided their initial verdict on the FOMC announcement and the comments from Fed Chairman Ben Bernanke at his press conference. The comments were pretty much what I expected: if the economy gets better, they will reduce their bond buying; if it doesn’t, they won’t.

The markets are reacting in a panic mode initially as stocks and gold have plunged. Rates have continued to move higher as the yield on the 10-year T-note rose to 2.311% from an early May low of 1.631%. Wednesday’s close completed the reverse H&S bottom formation on the T-note yields. The similar formation for T-bond yields was completed in May, the day after the inaugural issue of Eyes On Income was released.

Historically higher yields are not negative for stocks, especially at current levels. In fact, bond holders who can no longer stand the capital loss in their bond funds are most likely to turn to stocks. As I mentioned in More Pain or More Gain, I think bond yields are likely to see a pullback this summer, which will provide another opportunity to adjust your bond portfolios.

The recent improvement in the market internals suggested that the correction was over. Large losses in overseas markets are not yet translating to the US futures in early trading, and it will be important that the June lows do hold. Crude oil broke out of resistance last week and it often leads the stock market, but was this a fake out?

chart
Click to Enlarge

Chart Analysis: The comparative plot of crude oil and S&P 500 highlights several times when crude led the S&P 500 both higher and lower.

  • On February 22, 2012, crude oil peaked (point 1) while the S&P 500 did not make its high until early April.
  • The S&P 500 made a secondary high in early May before prices collapsed.
  • Stocks bottomed a month ahead of crude in the summer of 2012 but both peaked together on September 14.
  • Crude oil bottomed first on November 7 (point 3) but the S&P made its low a week later.
  • Crude oil has diverged from the S&P 500 for most of 2013 as it had formed lower highs, line a.
  • Last week crude oil closed above this resistance (point 5).

The weekly chart of crude oil is updated through the close on June 19 and shows last week’s close above the resistance at line b.

  • There is first support now at $96-$96.50.
  • The more important level of support is at last week’s low of $94.
  • The on-balance volume (OBV) has held support, line e, so far this year.
  • The OBV is back above its WMA but is still below its recent highs.
  • The OBV is well above the 2011 highs so has been acting stronger than prices.
  • There is next resistance at $100 with the downtrend from the 2011 highs, line a, at $103.60

chart
Click to Enlarge

The SPDR S&P Oil & Gas Exploration (XOP) is a well-diversified ETF whose top ten components do not make up more than 1.6% of the ETF. It has an expense ratio of 0.35% and yields 1.18%.

  • XOP peaked at $63.30 in May and hit a low of $59.22 (line a) last week. This was decline of 6.4%.
  • The quarterly pivot is at $59.07 with the longer-term uptrend, line b, at $55.65.
  • The short-term downtrend was broken on Tuesday with the 20-day EMA now at $60.60.
  • The relative performance shows a solid uptrend, line c, indicating it is leading the S&P higher.
  • The weekly RS line has also moved above its WMA.
  • The daily OBV broke its uptrend from the late 2012 lows, line d, last month.
  • The OBV is below its WMA while the weekly is above its WMA.
  • Short-term resistance now at $61.82 and then $62.40ron

Chevron CVX -1.33% Corporation (CVX) is a giant $233.6 billion dollar oil company with a current yield of 3.30% and a current ratio of 1.58.

  • CVX had a doji high on May 28 of $127.40, and the following day, an LCD was triggered.
  • The early June low of $118.66 was a 6.8% correction from highs that came close to the uptrend, line e.
  • The 38.2% Fibonacci retracement support is at $117.20 with the 50% level at $114.04.
  • The relative performance has just made new lows for the year and shows a clear downtrend, line f.
  • The OBV did form a bearish divergence at the recent highs, line g.
  • This was confirmed by the drop below the prior low as the OBV is testing its uptrend, line h.
  • There is short-term resistance at $122.98 with the quarterly R1 at $124.41.

What it Means: The typical seasonal pattern for crude oil is for it to bottom in February and then top out in late August. The close in crude oil this week will be important as a major reversal will call last week’s breakout into question.

The daily technical studies on both SPDR S&P Oil & Gas Exploration (XOP) and Chevron Corporation (CVX) need further improvement to confirm that the correction is over. I still prefer XOP over the Select Sector SPDR Energy (XLE) because of its diversification. I will be watching all of them closely.

As for the overall market, have a plan for your holdings as opposed to following the Fed Whisperers.

How to Profit: No new recommendation

See the original article >>

Bernanke: King and I

By tothetick

Some have been asking for quite a while now what Ben Bernanke will be up to when he finally gets to close his office door at the Federal Reserve for the last time? Will he be sunning it on some Cayman Island beach? Will he be cut into little pieces in the tapering tantrum that follows the withdrawal of $85 billion a month in Treasury Bonds that are going to disappear down the rabbit hole? Will the angry mob of swarming crowds be seeking out his hide-out to make the man pay for his mistakes?

Well, Ben there are two things that should be taken into account. First off: artists are rarely recognized in their lifetime, are they? Some will certainly agree that Ben Bernanke is an artiste of some sort, with an ‘e’ at the end; a skilled public performer, an entertainer, a person with artistic pretentions. He has certainly topped the bill in the past few years, that’s for sure. Maybe in a hundred years we will look back and have a Bernanke piece of work hanging from some plate rack in the living room. That’s if the plate rack and the living room are still in existence after the Quantitative Easing has had enough of us all.

The second thing that needs to be taken into consideration is that Bernanke should have seriously considered applying for the job before Mark Carney (former Governor of the Bank of Canada) got in when Mervyn King steps down as Bank- of-England Governor in just a few days, on June 30th. Why? Well, in Britain, they give life-peerages of privilege to those that are criticized with having done little all else in the UK except heighten the already sorrowful plight of the state of the economy there after the financial crisis.

Gordon Brown, the then-Chancellor of the Exchequer and later Prime Minister once quipped that there were two types of Chancellor in the UK: first, the one that failed, and then the one that got out in time. Brown got out and became Prime Minister and some will add managing to combine the first and the second, failing and getting out in time in one foul swoop. Machiavellian. Shakespearean. Macbethian tragedy on stage: “Life's but a walking shadow, a poor player/ That struts and frets his hour upon the stage / And then is heard no more”. If only! King and Bernanke have had their absurd hour on stage at the Bank of England and at the Federal Reserve, but in Britain life peerage is the reward. What will Bernanke be getting? An Oscar?

Bernanke: Oscar?

Bernanke: Oscar?

When Macbeth heard that his wife, Lady Macbeth was dead he replied “she would have died at sometime, either now or later". Perhaps King will say the same thing about the Old Lady of Threadneedle Street while he’s quietly sat on his chesterfield-padded red seat at the House of Lords. Bernanke might be saying the self-same thing about the Federal Reserve.

George Osborne, the Chancellor of the Exchequer of the UK (not to be confused with the R&B singer, Jeffrey Osborne, making the mistake that Barack Obama made at the G8 summit – which incidentally says more about the fact the Mr. Osborne is non-existent than Obama’s liking for music) said at the Mansion-House speech to the City that Mervyn King had "helped to lead our country through an extraordinary period of its economic history". No comment.

Some might say that these were and still are economically-troubled times. Others will say that Mervyn King failed to see the crisis coming and failed to deal with it adequately. Some say that King was Greenspan’s double when he slashed interest rates, leading to the credit bubble. Some said that he was a brilliant economist, but his stint at the Bank of England was far from shining. In a report that was published yesterday by a banking commission headed by Andrew Tyrie, Conservative MP in the UK, it was suggested that bankers, even top bankers should get prison sentences and should not be paid their bonuses until up to ten years after they had earned them in the hope that it would inject some morals into the banking sector in the world. Obviously, the report probably forget when submitting it to George Osborne to mention the fact that central bankers were of course not exempt. Or are they? King has always been strongly criticized for failure to act immediately, when it took five months to cut interest rates from 5% to 0.5%. He also never managed to keep inflation at around 2%. Although at least he did admit that the banks had put “profits before people”.

Mervyn King’s reply to George Osborne’s accolade was: "I am truly honoured to have the opportunity to continue my public service in the Lords. Chancellor, I know you will be comforted and relieved that I consider the role of members of the House of Lords to be, as Keynes put it, ruthless truth-telling."

So, watch out guys, Mervyn King has given the kiss (of death) and will now tell all. Truth-telling is a nasty business. There must be quite a few that are running for the hills to hide. But, one thing that King knows, now: people love being told the truth, but only after it has happened. It makes them feel good, with that ‘I-told-you-so’ attitude and secondly, it gives them what they want: someone else to put the blame on.

So, if Ben Bernanke is looking for something to do in January 2014, someone tell him that there is probably a seat somewhere in the House of Lords in the UK, right next to Mervyn and that he has to get down to writing his memoires. People love a good tragedy! If you can't give them tragedy, give them comedy, please!

See the original article >>

Follow Us