Friday, August 19, 2011

Socio-Economics Put China and India at Higher Investment Risk Than The U.S.

By EconMatters

This week has turned out to be Wall Street's wildest week since 2008. The Dow Jones industrial average closed down 519 points on Tuesday, Aug. 10, but then went up 423.37 points. But overall, Down has now lost more than 2,000, or 16% since July 21, less than three weeks ago. The selloff intensified after the U.S. got stripped of the top notch AAA rating by S&P first time ever in history.

The double AA status has put the U.S. in the same category as China, based on S&P's rating. But one consolation for the United States is that the country's high socio-economic resilience has placed the U.S. at a more favorable investment risk position than major emerging economies like China and India. Socio-economic Resilience Index is a risk metric developed by risk analysis firm Maplecroft measuring the ability of countries to cope with the impacts of a major event.

It is interesting that although some of the developed countries and emerging economies, while all subject to economic exposure to natural disasters, it is the socio-economic resilience that sets these countries apart when it comes to the overall risk to investors.

Based on another risk metric - Natural Hazards Risk Atlas 2011 (NRHA)--from Maplecroft, out of 196 countries, USA (1), followed by Japan (2), China (3) and Taiwan (4) are the only four countries rated as "extreme risk" to economic exposure to natural hazards such as floods, hurricanes, earthquakes.

The large emerging economies of Mexico (5), India (6), Philippines (7), Turkey (8) and Indonesia (9), and two developed countries--Italy (10) and Canada (11) are the remaining to be rated as ‘high risk’.(See Map)


However, in the Socio-economic Resilience category, most developed countries such as the US and Japan are rated as ‘low risk’, whereas some hot growth emerging economies like China, India, the Philippines, Indonesia, Pakistan, Bangladesh, and Iran are all rated as 'high risk’.

According to Maplecroft, while the large developed economies of the US and Japan have the greatest economic exposure to major natural hazards, they also have the capacity and readiness to weather impacts from major disasters. That includes: economic strength, infrastructures, disaster contingency plans, as well as tight building standards, etc.

Many of the emerging economies rated with high socio-economic risk have attracted high FDI (Foreign Direct Investment) inflow in recent years with their rapid growth. The rising economic power of the major emerging economies like China and India, and their lack of resources to respond to major events means the occurrence of a major disaster in these countries may also have global economic impacts and severely affect the global supply chain.

For instance, the severe drought in China earlier this year threatened global wheat crop production and prompted the U.N. food agency to issue warning due to the impact of China’s drought on global food prices and supplies.

Companies deriving a large portion of revenues from emerging Asian countries, although may have enjoyed higher growth in recent year, are at the same time subject to a greater risk of business disruptions than their more domestic-centric competitors.

Nevertheless, just as each country differentiates itself in its capability to respond and withstand major events / disasters, how each company executes its disaster response and business continuity plans may also serve as a differentiator within the pack.

For example, some companies like Apple were able to move quickly to secure their supply chain after the Japan quake, whereas others had to cut or halt production, powerless to respond to lost business and market share.

This also means investors, who are currently diversifying portfolios into Asian countries, need to also factor in natural hazards risks in to their investment strategies.

Bloomberg quoted an EPFR Global report that emerging-market equity mutual funds had more than $7 billion of withdrawals in the week ended Aug. 10, the most since the third week of 2008.

Emerging economies have been all the rage and buzz in recent years partly on stagnant growth in the OECD countries. But in times of uncertainty like we have now, investors tend to put stability above other considerations. Right now, the U.S. still offers relatively stable outlook (albeit with a gloomy near-term GDP growth projection) than most of other regions in the world.


So the risk factors discussed here probably already are playing an implicit role, particularly in the wake of Japan's mega earthquake and the resulted tsunami's, in the recent stock performance of MSCI emerging markets index vs. the S&P 500 (see chart above).

Get Ready! Gold & Stocks Are About To Diverge


The past few weeks traders and investors have been completely spooked from the surge of negative news and collapsing stock prices. This fear can be seen by looking at the volume on the GLD gold ETF fund. With gold being in the spot light for several years now and the fact that anyone can own gold simply through buying some GLD shares. It only makes sense that reading the volume on this chart gives us a good feel for what the masses are feeling emotionally.

If we step back to trading basics we know that fear is the strongest force in the financial market for moving prices. And that there are a few ways to read fear in the market and the more which line up at the same time means there is a higher probability of trend reversal in the near future.

The first thing I look for is a rising volatility index (VIX). This index rises when investors become fearful of stock prices falling be hedging positions or flat out buying put options to profit from a falling market.

Second, I look for a high selling volume ratio meaning at least 3:1 shares traded are from individuals hitting the sell button in a panic thinking that the market is about to collapse.

And last but not least… I look at the GLD gold etf volume and price action. A surge in GLD volume after a strong move up means everyone is scared and dumping their money into a safe haven.

Let’s take a look at some charts to get a better feel.

GLD Weekly Gold Chart:

As you can see there are sizable price movements which ended with strong volume surges. Those volume surges mean that the majority of investors have reached the same emotional level and bought gold for safety (GLD ETF). Keep in mind that the big money players and market makers can see this taking place and that is when they start selling into that surge of buying volume locking in maximum gains before there are no more buyers left to hold the price up. Tops generally take a few weeks to form so don’t expect a one day collapse.

The recent rally in gold has taken place when stocks have fallen sharply. Money has been pulled out of stocks and pushing into gold but I think that is about to change…


SPY Weekly SPX Chart:


The past month has been a blood bath for stocks. But from looking at the charts, volume and the fear in the market I can’t help but think we are going to see higher stock prices as investors see stocks moving higher, they will pull money out of gold and dump it back into stocks and likely high dividend paying stocks…


Mid-Week Trading Conclusion:

In short, everyone piled into gold sending it rocketing higher and I feel it has moved to far – to fast and is ready for a pullback (pause lasting 2-12 weeks). In association with gold’s pullback I feel investors are now realizing they sold their stocks at the bottom of this correction because fear took hold of their investing decisions. Now they are starting to think about getting long stocks but it still may be a bumpy ride for a few weeks yet…

ChartMatters: Dollar, Gold and Silver


Here now is a fresh look and the world's reserve currency and the two metals, starting with a 20-year timeline for the Dollar and Gold. Since late April, the Dollar has been in a narrow range with yesterday's close down 0.2% from our last inspection. Gold, in contrast, has risen 18.59%.
Click to View

What about Silver? It has been more volatile than Gold, but over the same timeframe, it has a nearly identical gain of 18.11%.
Click to View

The next chart starts the timeline in 1980, the earliest date my source, Stockchart.com, supplies data. Gold and Silver data are available across the complete timeline, but the Dollar tracking begins in mid-1983.

Click to View

By starting in 1980, we see the downside of the historic bubble in Silver that peaked on Silver Thursday, March 27, 1980.
Click to View
Source: www.RealTerm.de via Wikipedia


The circumstances surrounding the 1980 Silver Bubble, nicely summarized in this Investopedia article, were unique in modern history. In nominal terms, Silver is back in the territory of the 1980 bubble, but in real terms, and in light of the global financial distress, precious metals will doubtless remain attractive to many investors.

What about the Dollar? As of yesterday's close, the Dollar is down 55% from its 1985 peak. I won't hazard a forecast as to where it's headed, but I wouldn't be surprised to see the range of the past two years set the boundaries for the next several months.

See the original article >>

Is China Going To Stop Buying US Government Debt?


Is the PBoC going to stop buying USG bonds? Once again we are hearing very worried noises from various sectors about the possibility of a reduction in Chinese purchases of USG bonds. Here is what an article the South China Morning Post said:

"China will press ahead with diversification of its US$3.2 trillion in foreign exchange reserves, the State Administration of Foreign Exchange (SAFE) said on Thursday, adding it does not intentionally pursue large-scale foreign currency holdings. Officials have long pledged to broaden the mix of the country’s huge reserves – as much as 70 per cent of which are now in US dollar assets, according to analysts’ estimates – but the process has been gradual.
“We will continue to diversify the asset allocation of our reserve assets and continue to optimise the holdings based on market conditions,” the foreign exchange regulator said in a statement, responding to questions about its reserve management from the public. It did not mention the US debt debacle. Top Republicans and Democrats worked behind the scenes on Wednesday on a compromise to avert a crippling US default and potential credit rating downgrade.
Xia Bin, an adviser to the central bank, told reporters earlier this month that China should speed up reserve diversification away from dollars to hedge against risks of the US currency’s possible long-term decline."
It sounds like this time the PBoC might be pretty serious about diversifying their risk away from USG bonds, right? Let’s leave aside the fact that every six months we have heard the same thing for the past several years, and nothing has happened, shouldn’t we nonetheless be worried? Won’t reduced PBoC purchases be hugely disruptive to the US economy and to the US Treasury markets?

No, they won’t. There is so much nonsense still being said about this, even by economist who should know better, that I thought I would try to address what it would mean if the PBoC were actually serious and not simply making noises aimed at domestic political constituents.

First of all, remember that the PBoC does not purchase huge amounts of USG bonds because it has a lot of money lying around and doesn’t know what to do with it. Its purchase of USG bonds is simply a function of its trade policy.

You cannot run a current account surplus unless you are also a net exporter of capital, and since the rest of China is actually a net importer of capital, the PBoC must export huge amounts of capital in order to maintain China’s trade surplus. In order the keep the RMB from appreciating, the PBoC must be willing to purchase as many dollars as the market offers at the price it sets. It pays for those dollars in RMB.

It is able to do so by borrowing RMB in the domestic markets, or by forcing banks to put up minimum reserves on deposit. What does the PBoC do with the dollars it purchases? Because it is such a large buyer of dollars, it must put them in a market that is large enough to absorb the money and – and this is the crucial point – whose economy is willing and able to run a large enough trade deficit.

Remember that when Country A exports huge amounts of money to Country B, Country A must run a current account surplus and Country B must run the corresponding current account deficit. In practice, only the US fulfills those two requirements – large financial markets, and the ability and willingness to run large trade deficits – which is why the PBoC owns huge amounts of USG bonds.

If the PBoC decides that it no longer wants to hold USG bonds, it must do something pretty drastic. There are only four possible paths that the PBoC can follow if it decides to purchase fewer USG bonds.

  1. The PBoC can buy fewer USG bonds and purchase more USD assets
  2. The PBoC can buy fewer USG bonds and purchase more non-US dollar assets, most likely foreign government bonds.
  3. The PBoC can buy fewer USG bonds and purchase more hard commodities
  4. The PBoC can buy fewer USG bonds by intervening less in the currency, in which case it does not need to buy anything else.

We can go through each of these scenarios to see what would happen and what the impact might be on China, the US, and the world. To make the explanation easier, let’s simply assume that the PBoC sells $100 of USG bonds.

The PBoC can sell $100 of USG bonds and purchase $100 of other USD assets. In this case basically nothing would happen. The pool of US dollar savings available to buy USG bonds would remain unchanged (the seller of USD assets to China would now have $100 which he would have to invest, directly or indirectly, in USG bonds), China’s trade surplus would remain unchanged, and the US trade deficit would remain unchanged. The only difference might be that the yields on USG bonds will be higher by a tiny amount while credit spreads on risky assets would be lower by the same amount.

The PBoC can sell $100 of USG bonds and purchase $100 of non-US dollar assets, most likely foreign government bonds. Since in principle the only market big enough is Europe, let’s just assume that the only alternative is to buy $100 equivalent of euro bonds issued by European governments.

There are two ways the Europeans can respond to the Chinese switch from USG bonds to European bonds. On the one hand they can turn around and purchase $100 of USD assets. In this case there is no difference to the USG bond market, except that now Europeans instead of Chinese own the bonds. What’s more, the US trade deficit will remain unchanged and the Chinese trade surplus also unchanged.

But Europe might be unhappy with this strategy. Since there is no reason for Europeans to buy an additional $100 of US assets simply because China bought euro bonds, the purchase will probably occur through the ECB, in which case Europe will be forced to accept an unwanted $100 increase in its money supply (the ECB must create euros to buy the dollars).

On the other hand, and for this reason, the Europeans might decide not to purchase $100 of US assets. In that case there must be an additional impact. The amount of capital the US is importing must go down by $100 and the amount that Europe is importing must go up.

Will this reduction in US capital imports make it more difficult to fund the US deficit? Not at all. On the contrary – it might make it easier. Why? Because if US capital imports drop by $100, by definition the US current account deficit will also drop by $100, almost certainly because of a $100 contraction in the trade deficit.

A contraction in the US trade deficit is of course expansionary for the economy. Since the purpose of the US fiscal deficit is to create jobs, and a $100 contraction in the trade deficit will create jobs, the US fiscal deficit will contract by $100 for the same level of job creation – perhaps even more if you believe, as most of us do, that increased trade is a more efficient creator of productive jobs than increased government spending.

In other words although there is $100 less demand for USG bonds, there is also $100 less supply (or more) of USG bonds. It is of course possible that the USG ignores the employment impact of the contraction in the trade deficit, and goes ahead and spends the $100 anyway, but in that case unemployment would drop even more than expected.

This is the key point. If foreigners buy fewer USD assets, the US trade deficit must decline. This is almost certainly good for the US economy and for US employment. When analysts worry that China might buy fewer USG bonds, in other words, they are worrying that the US trade deficit might contract. This is something we should welcome, not deplore.

But the story doesn’t end there. What about Europe? Since China is still exporting the $100 by buying European government bonds instead of USG bonds, its trade surplus doesn’t change, but of course as the US trade deficit declines, the European trade surplus must decline, and even possibly go into deficit. This is because by selling dollars and buying euro, China is forcing the euro to appreciate against the dollar.

This deterioration in the trade account will force Europeans either into raising their fiscal deficits or letting domestic unemployment rise. Under these conditions it is hard to imagine they would tolerate much Chinese purchase of European assets without responding eventually with trade protection.

The PBoC can sell $100 of USG bonds and purchase $100 of hard commodities. This is no different than the above scenario except now that the exporters of those hard commodities must face the choice Europe faced above. Either they can neutralize the trade impact of Chinese purchases by buying US assets or they have to absorb the employment impact of deterioration in their trade account.

This, by the way, is a bad strategy for China but one that it seems nonetheless to be following. Commodity prices are very volatile, and unfortunately this volatility is badly correlated with Chinese needs. Since China is the largest or second largest purchaser of most commodities, stockpiling commodities is a good investment only if it continues growing rapidly, and a bad investment if its growth slows. This is the wrong kind of balance sheet position any county, especially a very poor country like China, should be engineer. It simply exacerbates underlying conditions and increases economic volatility – never a good thing, especially for a poor and undeveloped economy.

The PBoC can sell $100 of USG bonds by intervening less in the currency, in which case it does not need to buy anything else. In this case, which is the simplest of all to explain, China’s trade surplus declines by $100 and the US trade deficit declines by $100 as the RMB rises. The net impact on US financing costs is unchanged for the reasons discussed above. Chinese unemployment will rise because of the reduction in its trade surplus unless it increases the fiscal deficit.

It’s about trade, not capital

This may sound counterintuitive to all except those who understand the way the global balance of payments work, but countries that export capital are not doing anyone favors unless incomes in the recipient country are so low that savings are impossible or the capital export comes with technology, and countries that import capital might be doing so mainly at the expense of domestic jobs. For this reason it is absurd to worry that China might stop buying USG bonds.

On the contrary, the whole US-China trade dispute is indirectly about China’s insistence on purchasing USG bonds and the US insistence that they stop. Because make no mistake, if the Chinese trade surplus declines, and the US trade deficit declines too, by definition China is directly or indirectly buying fewer USG bonds, and this reduction in bond purchases will not cause US interest rate to rise at all. If it did, it would be like saying that the higher a country’s trade deficit, the lower its domestic interest rates. This statement is patently untrue.

Inevitably whenever I write about trade and capital exports someone will indignantly point out a devastating flaw in my argument. Since the US makes nothing that it imports from China, they will claim, a reduction in China’s capital exports to the US (or a reduction in China’s trade surplus) will have no impact on the US trade deficit. It will simply cause someone else’s exports to the US to rise with no corresponding change in the US trade balance.

No it won’t, unless this other country steps up its capital exports to the US and replaces China – which is pretty unlikely. Aside from the sheer idiocy of the claim that the US does not produce, or is incapable of producing, anything it imports from China, the claim is irrelevant even if it were true. Trade does not settle on a bilateral basis but must settle on a multilateral basis. If the US imports less capital its current account deficit must decline, whether because of bilateral changes in trade or not.

The basic point is that if reduced intervention in Chinese capital exports causes a reduction in Chinese exports to the US to be matched dollar for dollar with an increase in, say, Mexican exports to the US, the story doesn’t end there. Since Mexico’s trade balance is itself decided by the relationship between domestic investment and savings, a rise in Mexican exports will mean a rise in Mexican imports. It may very well be that lower Chinese exports to the US are matched by higher US imports from Mexico, but this will come with higher US exports to Mexico. And if it isn’t Mexico, it will be someone else.

The New Abnormal: Permanently Engineered Market Volatility

By Shah Gilani

If the gut-wrenching market volatility of the past few weeks has made you sick to your stomach , I have some bad news for you: violent volatility is the new normal - or more precisely, the new ab-normal.

After massive market moves last week, the Dow Jones Industrial Average tumbled 419.63 points yesterday (Thursday). And, while t hat may be bad news for average investors, it's something Wall Street wants.

If you're not a day-trader, high-frequency trader, hedge-fund manager, or institutional desk trader, reading this is going to make you mad as hell. But it's something you have to know, understand, and accept if you're going to be a successful investor going forward.

The reality is that in their crusade to manufacture extraordinary personal wealth, Wall Street insiders have engineered volatility into the capital markets.

This change is permanent.

Indeed, the same dangerous volatility that destabilizes markets creates innumerable trading opportunities for Wall Street's proprietary traders. These traders feed off each other and off their banking-industry clients.

The game is simple: Wall Street creates market volatility, some of which leads to panic. Panicked investors, in desperate searches for safety, turn to "experts" for protection. And Wall Street rakes in the profits - not just from their market-crushing trades, but from the investment fees they charge individual investors, companies and nations.

It's similar to how the mafia might trash your business and then offer to "sell" you their protection services.

By increasing volatility in stock, bond, commodity and real estate markets, The Street has created a self-perpetuating moneymaking machine.

Obviously, without the manufactured volatility, markets would be more stable, predictable and better serve economic development and growth. But there are no extraordinary gains to be made in calm and stable markets.

So Wall Street for decades has worked to make market volatility the norm. 

Exodus: The Beginning of Volatility for Profit

The roots of manufactured market volatility can be traced back to an obsession Wall Street has with disadvantaging the public while giving itself every advantage it can.

In 1969, Institutional Networks Corp. launched Instinet, the original off-exchange "communications network" designed for private use by institutional traders and dealers.

Instead of placing their orders and transacting on the principal exchanges where stocks traded almost exclusively, Instinet provided its members a competing venue where they could show each other bids and offers that the public wasn't privy to.

The club became so successful (I was member myself) - partly as a result of its exclusivity - that it eventually spawned competition.

In fact, it spawned a lot of competition.

What eventually became known as electronic communications networks (ECNs) proliferated in the 1990s. Eventually the multiple electronic exchanges, fashioned after Instinet and the over-the-counter (OTC) exchange that became Nasdaq, ended up competing for orders from brokers, dealers, institutions and a new breed of gunslingers known as "day traders" .

All of this competition dispersed trading to such a degree that it was difficult to know where to go to get the best price when trying to buy or sell stocks. But Wall Street eventually saw the benefit of the wide price discrepancies across multiple trading venues: It increased volatility, creating new trading opportunities.

Working (Over) the System

Of course, nobody on Wall Street believes you can ever have too much of a good thing. The first result was that big-name trading shops and old-world exchanges bought up the more profitable ECNs. Then they went on to start other private exchanges and trading conclaves known as "dark pools ."

In order to drive business to their trading venues, these synthetic exchanges pay for "order flow" and offer incentives to attract bids and offers for blocks of stocks.

The game, invisible from the surface, is designed to accomplish several things. If you control a venue that generates a lot of buying and selling, you can "internalize" the order flow. That means you don't have to trade outside your house - you match orders internally because you have so many buy and sell orders coming in. And then there are transaction fees.

If you are the "house," you can also take the other side of any trade you want, which has its advantages.

But the biggest advantage these venues have is that they "see" what orders are coming into them. And, regardless of whether or not it's legal, they trade against them and take advantage of knowing the specifics of other pending orders that can be used to backstop losses. I'll get to that is a moment.

Another piece of the market-volatility puzzle was neatly fitted with the advent of "decimalization."

Beginning in 2000, and finally encompassing all stocks on July 9, 2001, trades could take place only in increments of one cent. Prior to the implementation of decimalization, stocks traded in increments of eighths. Stocks used to trade in increments of $0.125, $0.25, $0.375, $0.50 and so on. You couldn't buy or sell a stock for $50.01 or $50.05, for example. You would have to transact at $49.875, $50.00, $50.125, or $50.25.

Even though changing to one-penny increments was sold as a way to reduce spreads and transaction costs, the hidden agenda was to increase volatility.

Decimalization didn't make for more liquid markets. It simply encouraged more risk-taking. Trading and holding horizons became shorter. And institutions stopped putting down big limit orders, because traders used those orders as backstops to sell into if their speculative buying didn't work out.

Markets got "thinner" and less liquid as a result of smaller orders being put up. Instead of lowering transaction costs, decimalization increased transaction costs: It now takes a lot more trades to buy or sell large blocks. It also can take a lot more time and expose buyers and sellers to steeper price moves.

The increased number of venues combined with more risk-taking to increase volatility exponentially. It was all working.

But there was still one little problem that Wall Street wanted out of the way.

The New Abnormal

Wall Street finally got what it wanted on July 6, 2007, when the Securities and Exchange Commission (SEC) did away with the "uptick rule." As of that day, it was no longer necessary to wait for a stock to go up in price before short-selling it. Without the uptick rule, short-sellers can short any stock, at any price, at any time.

There's plenty more that Wall Street has done to ratchet up volatility. It has flooded the world with derivatives that aren't regulated, and blessed high-frequency trading. It also introduced innumerable securities and financial instruments that it can arbitrage for healthy profits against unsuspecting institutions and the public.

Not surprisingly, market volatility is now a tradable product. And now that Wall Street has taken us down this path of entrenched, institutionalized volatility, there's no going back.

Don't expect any respite from what's going on in the markets now. On the surface, it's all about Europe, debt, downgrades, earnings, fundamentals and technicals. But underneath all those prime movers are the real shakers, the greasy palms of the markets hidden hands.

Abnormal is the new "normal."

7 THINGS THAT MAKE ME WORRY

By Lance Roberts

There are two types of investors in the world. The first type is like Warren Buffet – he invests capital for a return but has no definitive time horizon for that to occur. He can invest capital today for a return that he will most likely never see in his lifetime as his views can be 30 years or more. Berkshire will be around long after he is gone and will realize the benefit of his investing savvy.


The other type of investor is the average American who is investing their hard earned savings for a very definitive time horizon. The real goal here is to ensure that those savings have adjusted for inflation over time. That time horizon is on average 15 years which is shorter than the length of most secular cycles in the market and poses a real problem for individuals trapped in a secular bear market as we are in today.


As a manager of assets for the latter, my job is not to make sure that my clients beat some random benchmark index from one year to the next, but rather that an event doesn’t come along that takes away a large portion of their “savings”.


What individuals have forgotten over the last decade is that the stock market was never meant to be a “casino” or a “get rich quick scheme” but rather a tool to ensure that those very hard earned savings retain purchasing power parity over time.


My job, as I see it, is like a lifeguard at the beach staring out at the ocean. As long as the waves are gently lapping at the shore, blue skies extend to the horizon and a soft breeze is blowing; the environment is safe and I allow swimmers to play in the water. However, if I began to notice the breeze picking up, waves becoming a bit too aggressive or storm clouds forming in the distance I am going to start making preparations to remove swimmers from the water to safety.


The problem with most investors is that they fail to read the warning signs and suddenly find themselves struggling to get to shore as the storm rolls in over them. By that point it is far too late.


This leads me to today. We have been writing about these warning clouds since late last year and that it was only a function of time before reality caught up with the fantasy of markets. Today we are seeing the storm began to roll in and I wanted to touch on things that have me worried and why we will likely see a recession by the end of this year or early 2012.


1) GDP


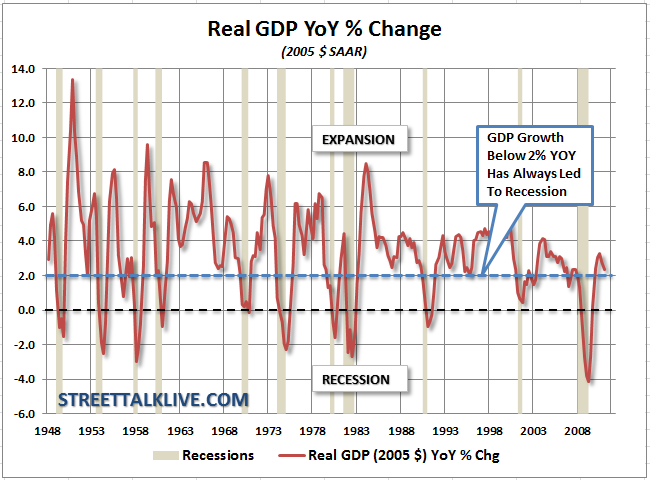
Statistically speaking, the data suggest the definite possibility of a second recession and potentially sooner rather than later. With the most recent release and revisions of the Gross Domestic Product data, the economy is currently growing at 1.6% on a year over year basis.


As the graph shows - when growth declines below 2% GDP growth it has been indicative of a recession in the past. Almost every drop below this line has led to a recession measuring back to 1947.

The issue is more than just a weak quarterly number. The long term trend of economic growth is also on the decline which is more indicative of economic destabilization as the credit boom has led to balance sheet recession rather than a normal manufacturing cycle.


Policymakers need to realize that unemployment is the real problem that needs to be addressed now rather than focusing on the deficit. Employment is the foundation for the organic economic growth cycle that will lead to higher government revenues which can then be used to pay down the deficit. Unfortunately, the current Administration has become entangled in deficit debates and have failed to realize that austerity measures implemented in a high unemployment environment will only exacerbate the situation. Maintaining a large deficit for a long period of time is not desirable for the economy, however, without focusing on the growth side of the equation first the deficit solution can not be solved without extremely deleterious long term effects.

 
2) Housing


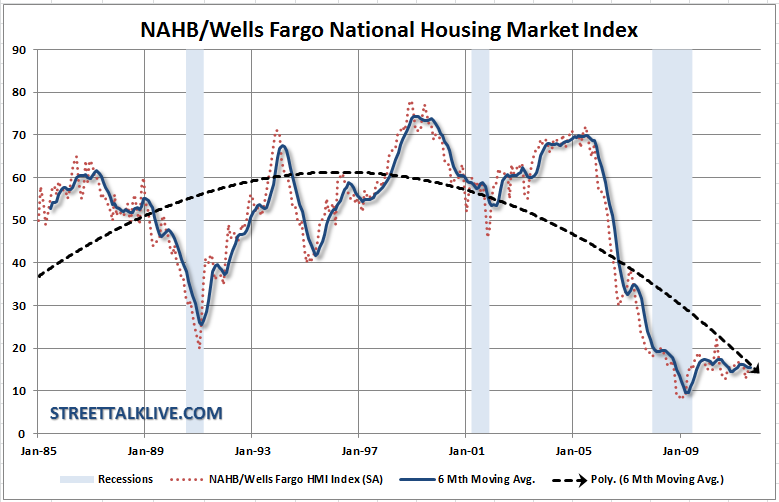
For all the hopes, prayers and wishes of a housing market recovery it has remained as elusive as “Sasquatch”.


The problem with the housing recovery is not just the massive problems that it brings to the banks holding pools of underwater assets but the lack of mobility for millions of Americans.


Part of the employment problem is that many families are literally trapped in their mortgage. Roughly 1 in 5 Americans are underwater in the mortgage meaning they can’t sell the home in order to move to another locale for a better job.


Furthermore, the over supply of homes is also crimping new home construction. When it comes to economic growth two of the biggest multipliers of dollars input are manufacturing and new home construction. In fact, every economic recovery in history has been led by construction and manufacturing. With new home construction clearly not showing any evidence of recovery it is little wonder that the economy is stagnating as well.
3) Manufacturing


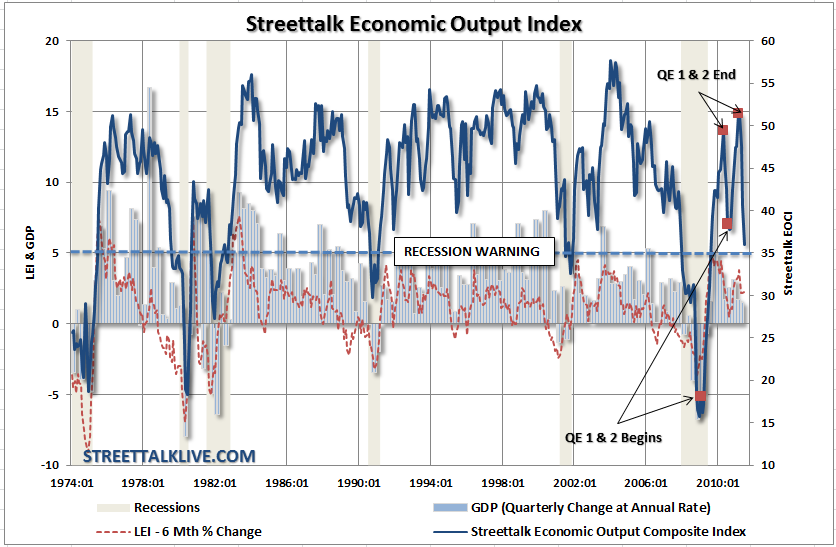
Speaking of manufacturing that area of economic rebound that we saw during 2009 and 2010 is now rolling over and headed towards recessionary levels. Roughly 2/3rds of the growth in the GDP numbers over the last several quarters have been directly attributable to inventory rebuilding and restocking. After massive liquidations of inventories in 2008 those inventories have now been fully replenished. Unfortunately, the demand side of the equation has been weaker than expected and inventories are now bulging at the seams.


As we have seen in many of the recent releases from the manufacturing regions backlogs are declining, deliveries are slowing and prices received are falling behind prices paid. None of this bodes well for stronger economic growth in the future or for corporate profits.
4) Employment


The state of employment, as stated previously, remains a huge problem for the economy. It fascinates me to no end that with each weeks release of the “jobless claims numbers”, which still hover at recessionary levels, that the mainstream media continues to try and extract an employment recovery story.


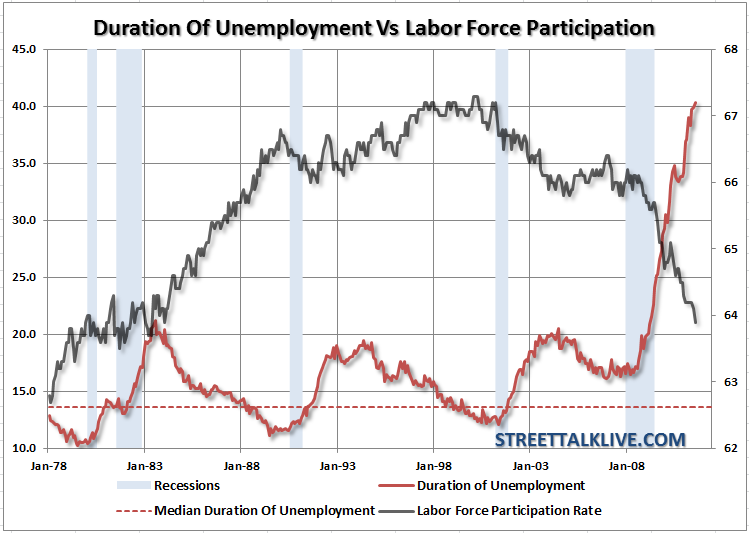
The reality of the story is that we are not created enough jobs now, or in the last decade for that fact, to offset the number of new entrants into the labor force.

Today, we are hovering at levels of employment relative to the total labor force that have not been witnessed since 1983.


Low levels of labor force participation continue to exacerbate the virtual spiral between the consumer and businesses. Individuals need to produce so that they can receive a paycheck. Once that paycheck is received they can then consume which puts a demand on businesses to increase production, inventories, etc. As final demand from the consumer increases more jobs are created and the cycle continues to perpetuate itself.


Currently, without the final demand there is no demand on businesses to create more “jobs, jobs, jobs” which continues to apply downward pressure on the economy. Now that companies have run through all of their alternatives for outsourcing jobs, cost cutting, layoffs, etc. it will now begin to eat the bottom line of their profitability which in turn applies more pressure on businesses to reduce costs – and that means no new jobs.
5) Retail Sales


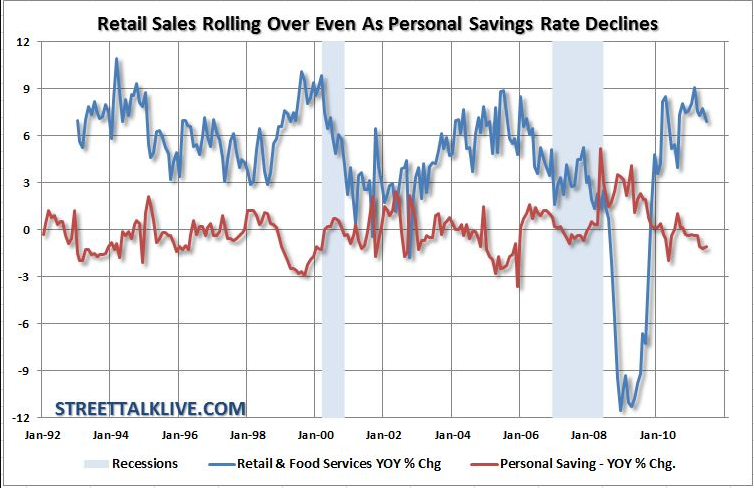
At the very end of the economic chain is the consumption by consumers. This shows up very well in retail sales.


While there was a huge spike up in year over year retail sales following the recessionary plummet; sales have now begun to peak. One of the main areas of retail sales has been gasoline sales which, combined with food, has been eating up more than 20% of wages and salaries.


The problem with this is that those sales are not being done by discretionary income alone but rather by draw downs in personal savings and with increases in credit.


In other words, in order for the average American family to make ends meet they can not do it out of free cash flow alone. They are still having to resort to personal savings and credit and hope that something will improve soon. The problem is that nothing is really improving for the average American. This is why most of the recent polls about the economy still show a large majority of Americans feeling like the recession never actually ended.


This doesn’t bode well for a future pick up in economic growth since the consumer is behaving like we are in a recession which then impacts the final demand on businesses who in turn don’t hire. In the most recent NFIB survey the majority of businesses do not think this is a “good time to expand” as “poor sales” are a major concern.
6) Personal Incomes


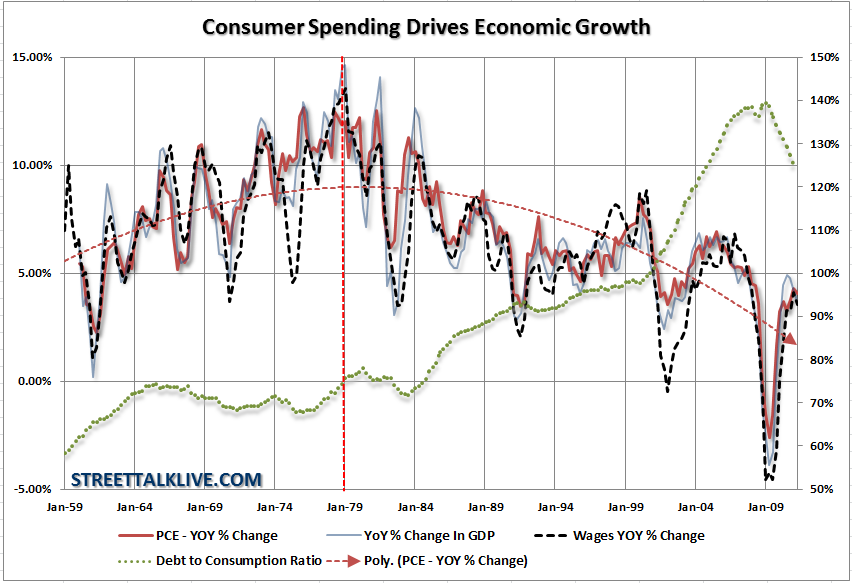
Personal incomes have been declining on a year-over-year basis since the 1980′s. As increases in productivity, a shift from manufacturing and production to a service based economy and a trend of outsourcing labor took hold wages have subsequently been brought under pressure. The problem is that during this same time as wages declined the standard of living of the average American actually increased. In order to maintain these higher standards of living consumers were forced to turn to credit to fill the gap.


This credit boom has now run its cycle and with the deleveraging of balance sheets currently underway by force (default, bankruptcy, etc.), and soon to be underway by choice, this will continue to have a negative impact on future economic growth and ultimately corporate profitability.
7) Profits


So, while most of this discussion has been on the state of the economy what this really boils down too is the market.


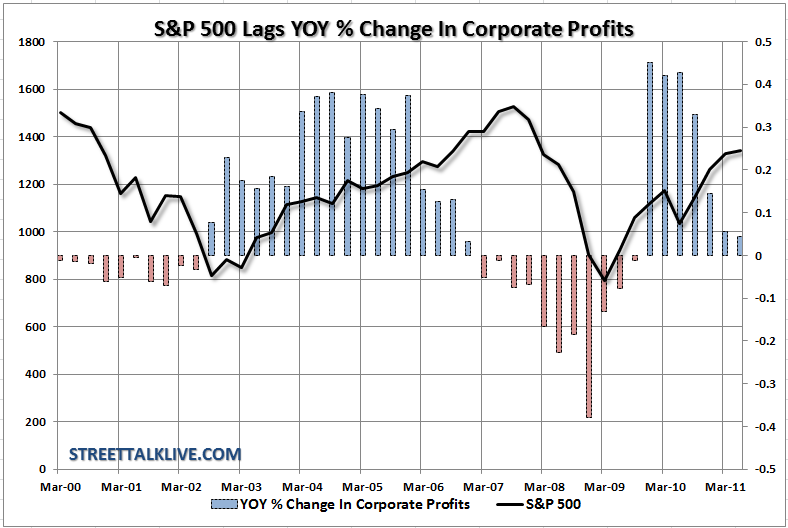
Analysts and commentators continue to point at the current level of corporate profits which is fine except for the fact that those profit margins have not been driven by top line revenue growth as much as cost cutting, layoffs and accounting gimmicks.


The real issue that needs to be paid attention to is that the year over year change in profits is about to turn negative, and will likely do so in the coming quarter. Historically, the markets tend to lag these declines in profits by a couple of quarters but nonetheless it is something that we will want to pay close attention as there is a high probability that we will begin to see negative earnings revisions in the coming quarters which will not play well with stocks that are still overly priced.

It’s The Clouds I Am Worried About


As I stated at the start of this missive – my job isn’t to warn you once the rain starts. My job is to warn you in advance of the storm so that you can safely clear off the beach and get to safety. Capital preservation is essential to long term investing success. It is the one thing that most investors fail to do by chasing market returns, yield or a variety of other blunders that lead to ruin.


The economy is showing tremendous weakness on many fronts and these are only a few of the issues that have me concerned at the moment. Could things turn around and began to improve, of course they can, and if they do then we will tell you that it’s okay to return to the water. Until then the advice is simple – be cautious, protect your assets and wait for the threat to pass before jumping back in. Sometimes having an umbrella with you, even when the sun is shining, can pay off in the end.
See the original article >>

IT’S THE LIQUIDITY STUPID! AND WHY IT MATTERS AGAIN

By Martin

Forget the sell-off in the equity space, it was expected. It seems you can’t teach an old equity dog new credit tricks. It was the case in 2008 and again it looks like it is the case in 2011. Earlier this year I explained the fundamental differences between equity markets and credit markets in the post: “A tale of two markets – Credit versus Equities“. We have a different DNA.

As I posted back in January 2011, in 2007, there was a big disconnect between credit markets and the equities markets. Volatility was falling, I argued, while credit spreads were simply exploding, with sometimes gigantic intraday moves, early indicators of trouble brewing? Lessons learned in 2011? I don’t think so. I also indicated in this previous post the following:
“The recent significant increase in credit spreads for many financials have been driven by the markets concerned about the ability of the weaker players to access credit at reasonable rates.”
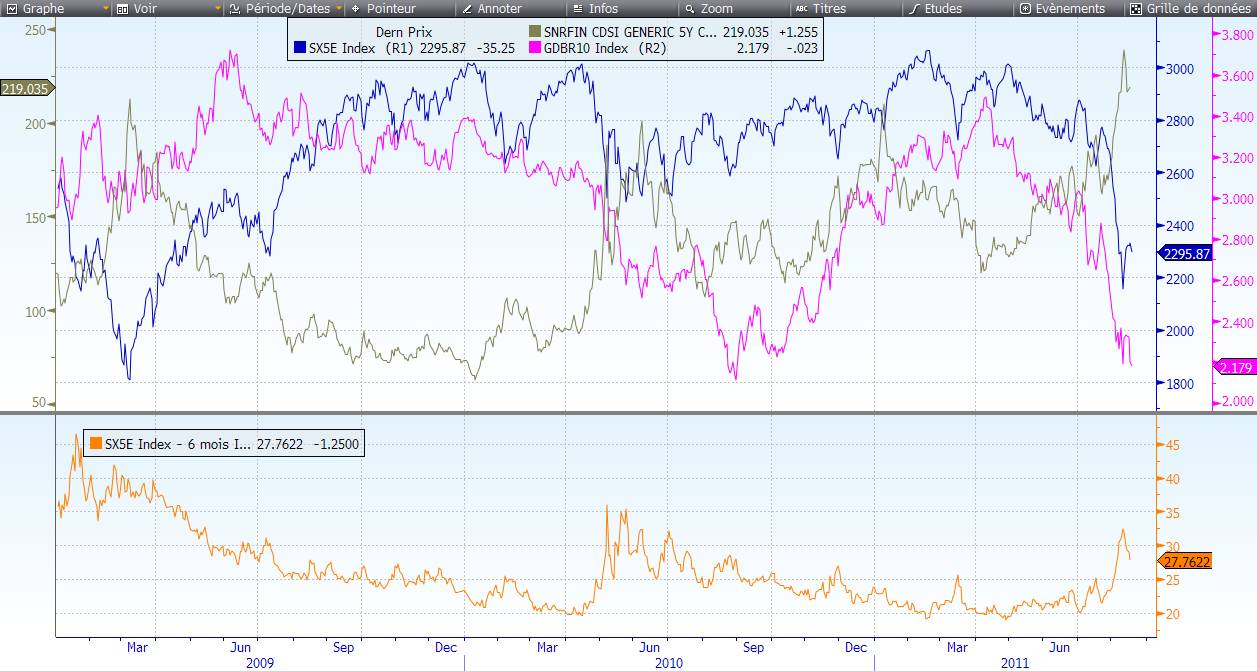
We had an interesting disconnect in January 2011 if you look back at the previous post, as indicated by the graph where you had Eurostoxx 50 (SX5E), Itraxx Financial Senior 5 year CDS index, German Bund (10 year Governement bond, GDBR10), and at the bottom Eurostoxx 6 month Implied volatility.
Here is the graph from January 2011:
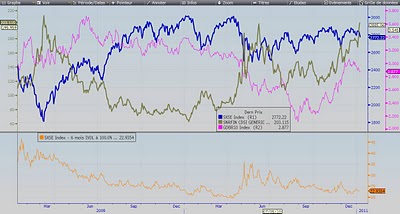
At the time, European High Yield debt was tighter than Bank Sub Debt. It is not the case today.
Here is today’s update from the graph published in January 2011:
We can clearly see the acceleration in the flight to quality with the drop in the German 10 year government bond yield. Since March, the Itraxx Financial 5 year CDS has been creeping higher, and finally the Eurostoxx gave up.

But back to the subject, liquidity and to be blunt, I do not like what I am currently seeing, it is going to be a long post.
The Unknown
As we know,
There are known knowns.
There are things we know we know.
We also know
There are known unknowns.
That is to say
We know there are some things
We do not know.
But there are also unknown unknowns,
The ones we don’t know
We don’t know.
—Donald Rumsfeld, Feb. 12, 2002, Department of Defense news briefing
In a CreditSights report published on the 17th, I had the opportunity to peak through their report on European Banks and liquidity issues.
What I’ve learnt:

Banks have been still reluctant to disclose their liquidity and short-term funding positions, in effect, European banks have failed to learn the lessons from 2008. Although they have higher liquid assets and lower short-term funding reliance than in 2008, the lack of disclosure and market runours about their funding the market is gaining traction, hence the very high volatility in European Banks stock prices and widening CDS spreads. But, ECB and other Central banks are still providing liquidity support, which alleviates somewhat funding concerns.

Truth is liquidity assessment were not included in the latest EBA (European Banking Association) stress tests we had in July. Without hard data and hard facts, how do you refute rumours and reduce interbanking lending pressures? You can’t. One would have thought that after the 2008 debacle, lessons would have been learnt, and that greater transparency is a must.

CreditSights is describing what you can find or not…from the most recent financial information, i.e. banks’1H11/2Q11 earnings reports:
The bad:
“A maturity breakdown of funding liabilities in European banks’ interim reports is rare. This makes impossible to calculate expected cash outflows.”
The good:
“An increasing number of banks disclose their stock of prime liquid assets (including cash, government securities and other securities eligible with central banks).
Creditsights to add:
“We believe liquid assets are typically much higher than they were in 2008 in relation to banks’ balance sheets, while short-term funding is typically smaller as banks have focused on lengthening their maturity profile. However, it is difficult to find comparative data.”
Another issue is the lack of disclosure of the liquidity coverage ratio:
From CreditSights:
“Hardly any banks are yet disclosing their “liquidity coverage ratio” (LCR). Under Basel III and CRD4, banks will have to comply with a new liquidity coverage requirements from 2015, after an observation and review period beginning in 2011. The aim is to ensure that banks have sufficient high quality liquid assets to withstand an “acute stress scenario” lasting for 30 days. The requirement would be a minimum LCR of 100%. In other words, the stock of high quality liquid assets should be sufficient to cover 30 days of cash outflows in stressed conditions.”
and Creditsights to add on the subject:
“In current market conditions, this ratio would be a useful indicator, but it is impossible to calculate it accurately for European banks, which are reluctant to disclose it before the regulators have finalised the definitions.”
The circularity issue weighting on liquidity:

In highly-indebted Eurozone countries, the issue of circularity comes from the high correlation with their sovereign creditworthiness, meaning they are experiencing very high level of stress on their current funding.

Conclusion for the banks in the peripheral countries:

The ECB is currently the ONLY SOURCE of wholesale funding for these smaller banks and have therefore prevented aggressive deleveraging to happen and liquidations.

According again to CreditSights in their report, Italy’s net reliance on the ECB remained low in relation to its large banking system’s total liabilities (2% at the end-July). But, gross liquidity provided to Italian banks in the ECB’s main and long-term refinancing operations virtually doubled from 41 billion euros at end of June to 80 billions euros at end of July 2011. It never even reached 50 billion euros since the end of 2008.

There is a rising risk of a credit crunch in Southern Europe.

A widening gap between Euribor and OIS is indeed a sign of stress in the interbank market. The full allotment provided by the ECB is mitigating so far liquidity concerns.

According to another report, this time by Morgan Stanley (European Banks – The Stress in bank funding and policy options – 15th of August 2011), European banks are starting from a better position than in 2008 given their latest funding survey which suggests that “Europe’s leading banks are on average issued around 90% of their term funding needs for 2011 with significant liquidity pools, better solvency and resolute ECB commitment to support the system”.
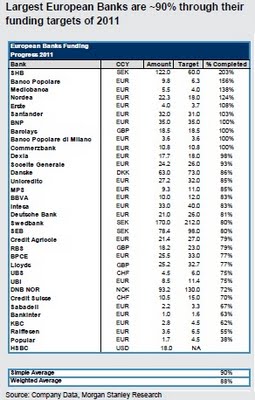
What we learn from this additional Morgan Stanley report:
“ECB support for bank funding is deep; it is also growing notably in Italy. We have regularly shown the periphery is already dependent on the ECB: 20% of Greek banking assets, 15% of Irish, 8% of Portuguese; 4% of Cypriot are funded at ECB window.”
Why liquidity matters again? Because bank funding is a key source for bank earnings, ability to lend, therefore a drag on the economic recovery if it doesn’t happen smoothly. While the US boast a Temporary Liquidity Guarantee Programme (TLPG), a similar mecanism is not currently available in Europe so far.

With the markets currently shut down with the ongoing volatility and turmoils, long term funding is beginning therefore to be a concern and the consequences very easy to understand, but unfortunately maybe not so easy to understand for our European politicians.

Lack of funding means that bank will have no choice but to shrink their loan books. If it happens, you will have another credit crunch in weaker European economies, meaning a huge drag on their economic recovery and therefore major challenges for our already struggling politicians.

As a reminder, 50% of banks earnings for average commercial banks come from the loan book: no funding, no loan; no loan, no growth; and; no growth means no earnings.

So what does that all lead to, very simple, an American solution, to European woes, namely a European TARP programme in conjunction with a European TLPG programme.

Given the strong correlation between sovereigns and their banks, as recently shown in the CDS markets for both Sovereign spreads and Financial Subordinated CDS for some European banks in the peripherals, it is a serious matter to consider, and no offense to our equity friends complaining about a nasty sell-off (believe me equity friends, you ain’t seen nothing yet, like in 2008), if the funding issues we mentioned here are not been addressed, it could get worse, much worse.

I posted this several times, but, remember, a bank is a leverage play on the economy, it is the second derivative of a sovereign. In fact, according to Morgan Stanley, the correlation has been 0.8 with peripherals and European banks in the last 6 months (so what were our equity friends thinking?).

And if our equity friends don’t believe this, then maybe these few Itraxx 5 year CDS charts will tell them more about what is going on out there and it ain’t pretty in the credit space:

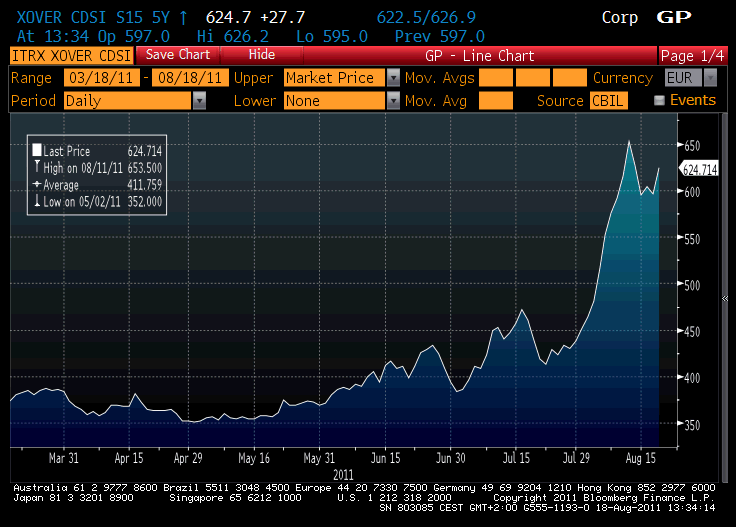
Itraxx Crossover 5 year index (High Yield):
Hey! That W sign on the chart, technically is that a buy sign? I’m afraid not equity friends.

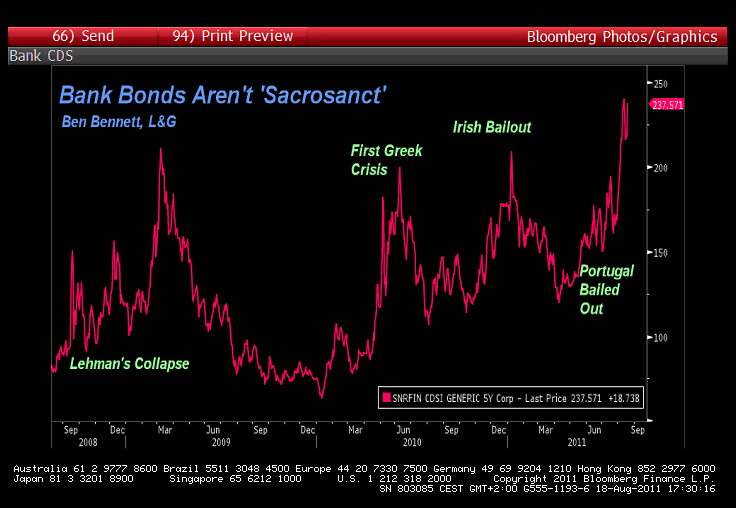
Bank Risk rising? Bank Risk soars above credit crisis peak – Bloomberg – Chart of the Day – Itraxx Financial Index of CDS linked to 25 banks and insurers:
Fact: “The cost of insuring senior bonds of European banks against default is higher than when Lehman Brothers Holdings Inc. collapsed, as funding dries up and concern mount lenders won’t get bailed out again” – Bloomberg

What we have is a 37% increase from July 28 to 237 bps as of today. It was 149 bps when Lehman went down in September and peaked at 211 in March 2009.

So yes, I don’t like what I am seeing and here are some more food for thoughts:

Point 1:

Yesterday according to Bloomberg, Lars Frisell chief economist at Sweden’s financial regulator told Swedish banks should step up preparations for a freeze in interbank debt markets as Europe’s debt crisis is intensifying.

“It won’t take much for the interbank market to collapse,” Frisell said yesterday in an interview in Stockholm.

He added: “It’s not that serious at the moment but it feels like it could very easily become that way and that everything will freeze.”

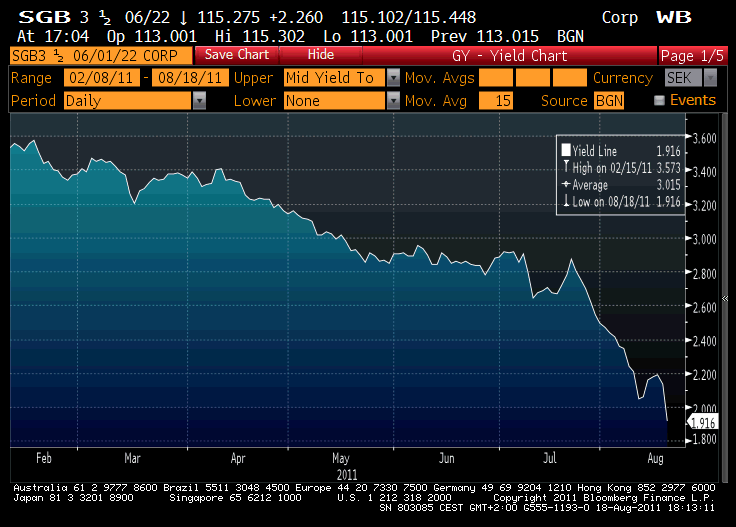
And guess what I saw today on the 10 year Swedish Goverment bond yield? A massive 22 bps tightening move, which incidentally is the biggest tightening move of the day in the European bond market and I don’t like these kind of moves:
10 year Swedish bonds breaking the 2% level yield down.
 
The three-month Stockholm interbank lending rate reached 2.59% yesterday, the highest since December 2008. The rate rose to more than 5 percent in 2008 as the market froze following the Lehman collapse.

Point 2: From Bloomberg article today – By Chitra Somayaji – Aug. 18 (Bloomberg)
“U.S. regulators are stepping up scrutiny of local operations for Europe’s largest banks on concern that the region’s sovereign debt crisis may lead to funding problems, the Wall Street Journal reported today. The Federal Reserve Bank of New York has been holding talks with the lenders and sought information about their access to funds to maintain operations in the U.S., the Journal said,citing people it didn’t identify. The regulator has also been asking some lenders to overhaul their structure, it said. Policy makers, who aim to avert a repeat of the 2008 global financial crisis, are concerned that Europe’s debt problems may curtail the banks’ ability to fund loans and meet their obligations in the U.S., or lead them to siphon funds from the U.S., the newspaper said.”
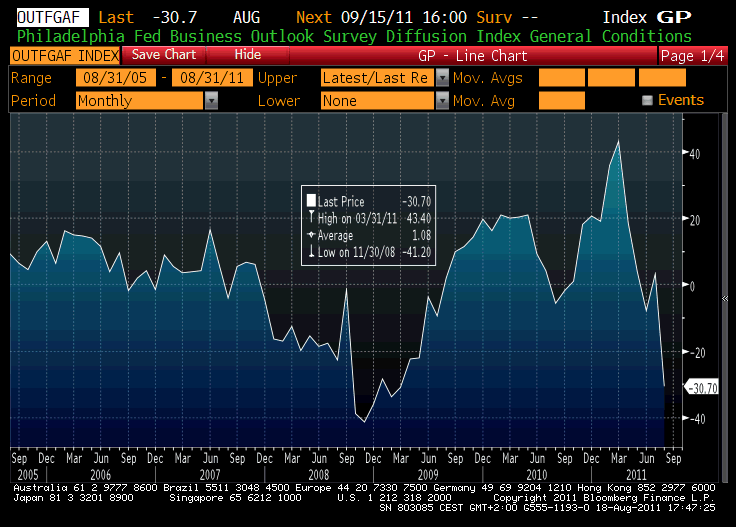
Point 3: Philly Fed – you know the score by now:
More fun?

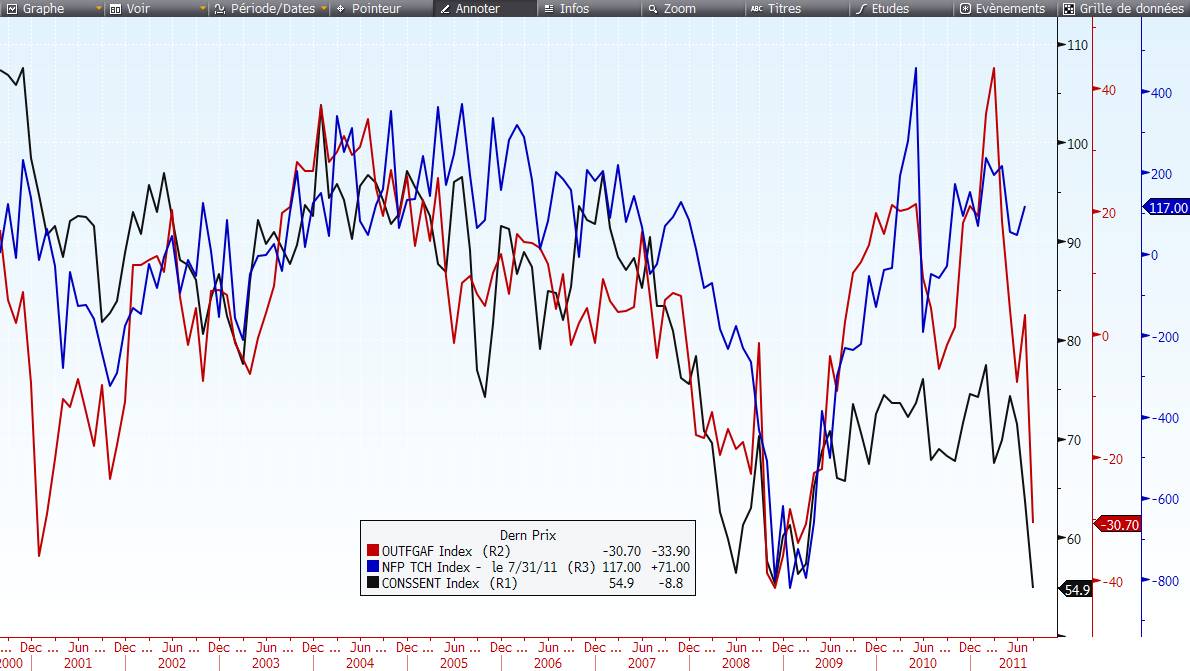
Let’s compare Michigan Confidence/Philly Fed and NFP (Nonfarm Payrolls):
Point 4:

Again on Bloomberg, Austria is joining Finland in asking Greece for collateral in exchange of new emergency loans:
“It always was our position in the council that if there is a collateral setup, Austria will participate,” Harald Waiglein, a spokesman for Austria’s Finance Ministry.
“The Netherlands, Slovakia and Slovenia have also expressed interest in getting collateral should the Finns manage to strike a deal, Waiglein said.”
“The agreement requires Greece to deposit cash in a state account that Finland will invest in AAA rated bonds. The interest generated will raise the amount, which has yet to be disclosed, to cover Finland’s bailout contribution. The bilateral arrangement needs approval from other euro members,Finland’s Finance Ministry said.”
Another risk of European political bickering in the coming weeks. Stay tuned.
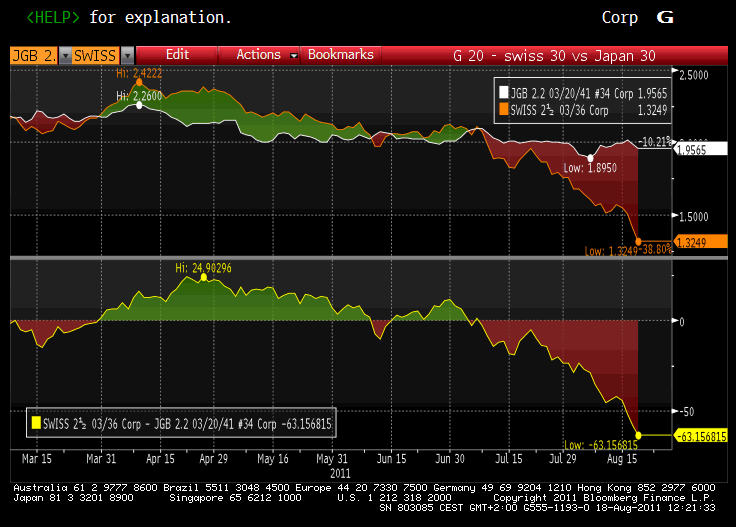
And finally, and because it has been a long day and some people, once again, are aging in dog years this week, including me, I give you one last chart, supportive of the deflation story, Swiss 30 years bond versus Japanese 30 years bond:
To be continued!

They Call It “Stagflation”

By Jeff Harding

This is the “stagflation” we have been telling you about (graphics courtesy WSJ). It’s not a rough patch.


The Bond “Bubble”

By DoctoRx

With incomprehensibly low yields on money, the U. S. has in my view definitively followed the Japanese model. Of course there are major differences. One is that the U. S. is the global big dog, alpha male, leader of the pack, etc. Ten-year Treasurys at 2.03% as I write this are lower than at any time during the 2008 crisis. 

With the consumer price index running at 3.6% annually, this is a bubble yield, yet – it exists. A great deal of savings are looking for a home and not perceiving a lot of worthwhile profitable lending opportunities. A rush of funds out of Europe, out of the stock market, and out of most commodities save precious metals is bidding up Treasurys in price. At these levels, the thinking gets interesting.

Once one is reconciled to putting up $100 into a 10 year bond and ending up, gross, with $120 a decade later ($100 of the $120 being nothing more than getting your own money back), clearly one is just looking to get one’s principal back with a “thank you” of a yield. At this point, there is not a lot of difference between getting $115 back rather than $120. That’s a 1.5% yield. So yield might drop to sub-2% in a real crisis. 

Again, this is not a case of price stability or mild price deflation a la Japan. The U. S. has, for now, the exorbitant privilege that comes from sweeping the table in the major conflicts of the 20th Century and dominating the world in quite an astonishing way, if one thinks about the trajectory of this nation.

So this is a good news-bad news story. The U. S. attracts risk capital, even though one of its sovereign states, Illinois, is essentially in default on hundreds of millions of dollars in obligations. We hear a lot about Greece’s problems, but almost nothing about Illinois, which has a similar population to Greece, and which sends a much higher percentage of its state’s leaders to prison for corruption than does Greece.

In any case, the flip side of lower and lower government borrowing rates while price inflation perks along is the price of gold. In 32 years of following the gold market, gold responds to negative or positive real interest rates. Currently, with even the 30-year Treasury yielding less than the CPI rate, gold’s price is doing what it did in the 1970s. Gold ignores crises when real interest rates are strongly positive. Gold has left being bling behind. Not only is it the non-dilutable “currency”, the world may be closer to peak gold than to peak oil.
Upon reflection and observation of the economic data, I have some thoughts about the recent debt limit agreement. In relation to gold, the agreement is wildly inflationary. The combination of a balanced cash 

Federal budget and reasonably high interest rates through the latter Clinton years pushed down the prices of gold and oil. The current policy points in the opposite direction. My guess is that the economists and bankers were advising Congress and the White House that the economy was at stall speed. Thus my suspicion is that the deal was more or less foreordained. Following recent economic orthodoxy, “stimulus” is to be continued while money is left in circulation rather than being withdrawn from circulation. Meanwhile, each side gets to point a finger at the other, which is useful when seeking campaign contributions.

Several weeks ago, I raised the question in this blog of whether the country was already in a new recession (assuming simply for sake of discussion that the Great Recession ended in 2009). The odds are now much increased that one has begun, with one usual suspect of a cause being the massive jump in oil prices coming off their crisis lows.

Returning to interest rates and banks, then, we have come a full half circle from three decades ago. Then, disinflation was the policy chosen, and high gold and oil prices were the enemy. Relatively tight money and the tolerance of interest rates as high as needed to break the inflationary fever were the policy choices. (Note there were no tax cuts in the 1980 recession or in 1981 as that great recession got underway.)

Now we have tax cuts galore even since 2008 and rather than impossibly high interest rates, we have these ridiculously low interest rates.

Just as investors had to respect the economic cycles in the 1980-3 period while being flexible and preparing for a world of secular disinflation and a ”flight” to paper money from tangibles, so too today. The major difference could be that as in Japan, zero interest rates can be a form of flypaper or quicksand. Zombie banks and bad assets that are not expeditiously liquidated mean that capital is trapped in a sort of black hole.

Thus I interpret the Fed’s statement of ZIRP for at least two years differently from the mainstream. I look at it as a well-informed prediction that there will be a “savings glut” relative to investment opportunities for a long time. While the Fed has a highly imperfect set of opinions, it certainly knows the true state of affairs in lending institutions better than I do. I’m thus not going to fight the Fed. I’m thus taking the point of view that a sluggish level of economic activity probably lies ahead of us in the United States for some time to come. I also expect negative real interest rates to bedevil us savers and provide a tailwind of varying strength to the prices of metals and other assets that can be hoarded. In weak economic times, gold will tend to be the strongest of these; that will tend to reverse when the economic has a growth spurt.

The specific investment decisions beyond the above that flow from this view will be discussed in subsequent posts.

Follow Us