Tuesday, April 15, 2014

Control your risk with simple and winning rules – SuperStocks trading signals for 16 April

   
Super Stocks Trading Signals Report

Latest Free Trading Alerts for 16 April Download Historical Results
Open position value at 15 April $ -228.94 2014 P/L   +2.80%
   

Mixed long/short open position
Today MSFT entry new positions      

3 Open Positions   
1 Long     
2 Short      
1 with Stop Loss at Breakeven

In true signal service, attachments reports are sent to customers also via email, in the evening after the markets close. Those who wish to receive them during the demo, please send me their email address.


I simulated 25% margining and modified initial  capital to $ 500K


1296672115_Stocks
Download Super Stocks Tading Signals for 16 April

1296672488_Chart_4
Download Super Stocks Evening Comment for 16 April

   
We are happy to offer free signal service for Super Stocks until the end of March Please send me your email address so I can invite you on my server to do the demo. Mail me to take the offer and start the free service until the end of March michele.giardina@quantusnews.com


Material in this post does not constitute investment advice or a recommendation and do not constitute solicitation to public savings. Operate with any financial instrument is safe, even higher if working on derivatives. Be sure to operate only with capital that you can lose. Past performance of the methods described on this blog do not constitute any guarantee for future earnings. The reader should be held responsible for the risks of their investments and for making use of the information contained in the pages of this blog. Trading Weeks should not be considered in any way responsible for any financial losses suffered by the user of the information contained on this blog.


Ukraine fights back

By Phil Flynn

Ukraine on Tap!

Reports that Ukraine may start military operations may turn around a market that was all of a sudden pricing in diplomacy. A meeting in Switzerland may be doomed to fail as reports that the acting Ukrainian President has said that a military operation to regain control of cities in the eastern Ukraine has begun. Yet in the early going the market is skeptical anything is really going to happen.

Oil (NYMEX:CLK14) and gold (COMEX:GCK14) rallied in yesterday’s session but fell back on reports of slowing Chinese’s economy as well as hopes that a diplomatic solution can be found in Ukraine. Chinese demand for gold is falling against a back drop of an economy that is slowing China’s demand dramatically according to the World Gold Council.

Oil’s risk on trade has been anchored by ample supply and on again off again promise from Libya that oil would soon be exported. Every time oil gets some positive news it breaks. Now it will be interesting to see if we rally on these reports of Ukrainian military movements. Russia, that has troops on the border, has warned that they might intervene if Ukraine moves.

Gas prices are stubbornly high as the seasonal roll continues. With ample gas supply and a break in ethanol we should see prices start to fall next week assuming Ukraine does not go up in flames.

In the meantime one European country looks to get off Russian gas.

Dow Jones reports that German utility RWE AG said Tuesday it has formally agreed to supply Ukraine with natural gas this year, the first such deal by a European energy company after Ukraine's continuing political crisis put the country's traditional supplies from Russia in doubt. RWE said that it would begin gas deliveries to Ukraine's state-owned energy company Naftogaz via Poland immediately. RWE said it would ship gas from its "pan-European portfolio" to Ukraine, but didn't provide an estimate of the expected volumes. The deliveries are part of an existing five-year framework deal that allows RWE to ship up 10 billion cubic meters of natural gas a year to Ukraine, but the gas supplies must be agreed on annually. Last year, RWE supplied around 1 BCM of gas to Ukraine, it said. The gas will be delivered at wholesale price levels, including delivery costs, RWE said.

Russian gas-export monopoly Gazprom OAO earlier this month raised gas prices for Ukraine by 81% because of the debts it said total more than $2.2 billion. Russia later said that Ukraine would only receive gas in return for advance payments and warned that there could be supply disruptions if Ukraine's debt wasn't addressed. The dispute prompted Ukraine to begin talks with European energy companies in an effort to secure alternative gas sources. RWE said supplies from Western Europe could be significantly increased, provided that "various transport restrictions at the Slovak-Ukraine border are politically and technically resolved.

Dow Jones reports that China's appetite for gold is waning after a decade long buying spree, suppressed by the country's economic slowdown and constrained credit markets. Demand in the world's biggest gold consumer is likely to stay flat in 2014, according to estimates from the World Gold Council. Gold demand in China has expanded every year since 2002, when it declined, according to the industry group, whose forecasts are closely watched in the gold market.

Decelerating Chinese gold demand could threaten the recent recovery in gold prices, some investors and analysts say. Gold futures are up 10% year to date, after falling 28% last year, the biggest annual drop since 1981. Unrest in Ukraine, a bumpy start to the year for stocks, and the Federal Reserve's commitment to low interest rates in the long term has propelled gold higher.

Snow and cold should support Nat gas! Producers are ramping up but they had better wow the market! Buy calls!

See the original article >>

U.S. orange production hit by greening disease

By Jack Scoville

(NYBOT:OJK14)

Orange Juice futures closed lower on long liquidation from the rally seen last week. Traders are back talking about weaker demand again and also about some showers that were reported in Brazil production areas over the last couple of days. Prices had rallied in response to the new production dta from USDA that showed lower production in Florida again. The greening disease has once again lowered U.S. Orange production estimates, and the disease will be around for a few more years. Weaker demand helps offset the losses from less production in Florida and also Brazil as consumers look to alternatives for Vitamin C. Brazil has seen dry weather might that be stressing trees as reports indicate that many áreas still need rain. There is none in the forecasts into the middle of next week. Florida harvest conditions remain good. The Valencia harvest is strong. Blooms are being reported in all parts of Florida and soil moisture conditions are reported to be mostly good due to recent rains. Some fruit is starting to appear. Florida is dry through this week.

Overnight News: Florida weather forecasts call for scattered showers through the weekend. Temperatures will average near to above normal. Brazil should be mostly dry and warm after some showers today. 

Chart Trends: Trends in FCOJ are mixed to up with objectives of 175.00 May. Support is at 160.00, 157.00, and 156.00 May, with resistance at 169.00, 172.00, and 175.00 May.

COFFEE (NYBOT:KCK14)

Coffee closed higher after trading both sides of unchanged. Speculators were the biggest players on both sides of the market. The roasters have been trying to wait out the rally and have either pulled back on offers or offered lower differentials. Producers have been offering, but were not really seen in the market yesterday. Declining production estimates for Brazil keep prices heading higher. Some estimates for production of the coming crop range as low as 40 million bags, although most estimates are still above 45 to 47 million bags. The weather remains dry in Coffee areas, and the harvest is expected to start early due to advanced maturation of the beans. Some rain was seen over the last couple of days, but it is expected to turn dry and warm again after today. Harvest could start in early May instead of the end of the month as would be normal. The Conillon harvest in northern Brazil is already started. London was lower. Exports have increased over the last couple of months as producers in Vietnam start to move stocks amid better prices.

Overnight News: Certified stocks are lower today and are about 2.587 million bags. The ICO composite price is now 176.59 ct/lb. Brazil will get showers today, then mostly dry weather. Temperatures will average near to above normal. Colombia should get scattered showers, and Central America and Mexico should get some showers in most areas. Temperatures should average mostly above normal.

Chart Trends: Trends in New York are mixed to up with objectives of 223.00 and 295.00 May. Support is at 200.00, 195.00, and 190.00 May, and resistance is at 209.00, 212.00 and 215.00 May. Trends in London are mixed. Support is at 2110, 2080, and 2050 May, and resistance is at 2150, 2180, and 2190 May. Trends in Sao Paulo are mixed to up with no objectives. Support is at 246.50, 240.00, and 238.00 September, and resistance is at 255.00, 258.00, and 261.00 September.

COTTON (NYBOT:CTK14)

Cotton was higher in nearby months, but lower in deferred months. The price action overall has not been real strong, but Bulls seem unwilling to give up. Ideas of short domestic supplies available to the market supported nearby months. Demand is a problem as the market has seen selling due to reduced prices for Chinese government supplies and ideas that Chinese imports could be sharply curtailed in the coming months. The government is releasing some of its supplies to millers at competitive prices when compared to imports. The move by the Chinese government comes as the United States will plant more Cotton. China is the top destination for US exports. Brazil conditions are reported to be good in Bahia with warm temperatures and a few showers. India might have some production problems this year as El Nino is developing and might bring less monsoon rains to the country. Warmer temperatures are returning to production areas in the US and there has been some fieldwork done, at least in the Delta and Southeast. It is turning warmer and drier in the Delta and Southeast. The Texas Panhandle should be mostly dry through this week and needs some rain.

Overnight News: Delta and Southeast areas will get some drier weather after some big rains today. Temperatures will average near to above normal. Texas will see mostly dry weather. Temperatures will average near to below normal. The USDA spot price is 85.26 ct/lb. today. ICE said that certified Cotton stocks are now 0.275 million bales, from 0.274 million yesterday. USDA said that Cotton is now 8% planted, from 6% last week, 8% last year, and 9% average.

Chart Trends: Trends in Cotton are mixed. Support is at 90.00, 88.60, and 88.00 May, with resistance of 91.70, 92.40, and 93.20 May.

SUGAR (NYBOT:SBK14)

Sugar futures were lower on ideas of weak demand. Demand for world Sugar is said to be very light right now and the market seems to be looking for new buyers. Ideas are that most buyers have good coverage for now. Dry weather in Brazil remains an important market feature. Some showers were seen in production areas over the last couple of days. Forecasts now call for dry conditions to return through this week. Most other Sugar production areas around the world are in good condition. Futures remain in the overall trading range, and the fundamentals suggest that the range can hold for now, although futures could start to move to the lower end of the trading range in the short term. The Brazil crop needs regular rains after getting off to a very dry start. Dry conditions will return after today and crop stress is seen. There are worries that El Nino is starting and that it would reduce rains in India, but increase rains in Brazil. Thailand has been selling Sugar with steady to lower differentials. Weather conditions in key production areas around the world are rated as mostly good.

Overnight News: Brazil could see some showers today, then dry conditions and near to above normal temperatures.

Chart Trends: Trends in New York are mixed to down with objectives of 1700 and 1640 July. Support is at 1730, 1710, and 1685 July, and resistance is at 1760, 1790, and 1800 July. Trends in London are down with objectives of 454.00 and 442.00 August. Support is at 461.00, 458.00, and 455.00 August, and resistance is at 470.00, 477.00, and 478.00 August.

COCOA (NYBOT:CCK14)

Cocoa closed slightly lower in low to moderate volume trading. Charts show that the markets remain in a big trading range. New grind data will appear soon to show demand and could force a trend change either higher or lower. Traders expect a year-to-year increase of 3% in the U.S. grind. Better than forecast production in West Africa and Asia has kept the rally from extending beyond the current highs. Midcrop offers have appeared in Nigeria and are also appearing in Brazil. Bears have not been able to break futures from the sideways longer-term range as overall the market remains tight on supplies and with enough demand to keep things that way. Mid crop conditions seem good in West Africa and generally good in Southeast Asia, although it remains a little too dry in Malaysia. The weather is also good in Brazil, with the midcrop flowering under favorable conditions.

Overnight News: Scattered showers are expected in West Africa. Temperatures will average mostly above normal. Malaysia and Indonesia should see scattered showers, with best amounts and coverage in Indonesia. Temperatures should average near to above normal. Brazil will get dry conditions or light showers and near to above normal temperatures. ICE certified stocks are lower today at 5.075 million bags.

Chart Trends: Trends in New York are mixed. Support is at 2975, 2960, and 2920 July, with resistance at 3035, 3050, and 3065 May. Trends in London are mixed. Support is at 1860, 1840, and 1825 July, with resistance at 1890, 1900, and 1930 July.

See the original article >>

Geopolitical tension pushing world back to U.S. Treasuries

By Susanne Walker

Treasuries rose, pushing 30-year bond(CBOT:USM14) yields to the lowest level in nine months, as tensions between Ukraine and Russia escalated, boosting haven demand.

U.S. debt strengthened as Ukrainian units backed by armored personnel carriers blocked all approaches to the town of Slovyansk, Russia’s state-run RIA Novosti news service reported, citing an unidentified pro-Russian activist. U.S. consumer prices rose by 1.5 percent in March from a year earlier, the Labor Department reported, and remained below the Federal Reserve’s 2 percent inflation target.

“The Ukraine story leans on the fact that there’s some risk out there,” said Thomas Tucci, managing director and head of Treasury trading in New York at CIBC World Markets Corp. “There are casualties, aggression and no certainty about the outcome. It’s just an unstable situation.”

U.S. 30-year Treasury bond yields fell two basis points, or 0.02 percentage point, to 3.47 percent as of 10:34 a.m. New York time, according to Bloomberg Bond Trader data. The price of the 3.625 percent securities maturing in February 2044 added 3/8, or $3.75 per $1,000 face amount, to 102 7/8. The yield fell to as low as 3.46 percent, the least since July 3.

Benchmark 10-year yields fell two basis points to 2.63 percent. The yield reached 2.60 percent yesterday, the least since March 3.

Bond Returns

Treasuries have returned 2.3 percent this year, including a 0.6 percent rise this month, according to the Bloomberg U.S. Treasury Bond Index. The debt lost 3.4 percent last year.

The term premium, a gauge that includes expectations for interest rates, growth and inflation, was at 0.48 percent. It was as low as 0.46 percent on April 11, the most expensive since March 18.

Fed policy makers are unwinding the bond-buying program they have used to support the economy, while keeping their target for overnight lending between banks in a range of zero to 0.25 percent since 2008. The central bank will acquire $1.75 billion to $2.25 billion of Treasuries maturing from January 2020 to March 2021 today.

Russia’s holdings of U.S. government securities fell in February to $126.2 billion, the lowest level since 2011, from $131.8 billion the previous month, Treasury Department data released in Washington showed. It was the fourth straight month of declines in Russia’s holdings. The figures were part of a monthly report showing foreign holders of Treasuries as well as international portfolio flows.

Foreign Investors

China, America’s largest overseas creditor, owned $1.27 trillion of Treasuries in February, down by $2.7 billion from the previous month. The high was $1.32 trillion in November. Japan holdings increased by $9.1 billion to hold at a record $1.2 trillion.

The consumer-price index climbed 0.2 percent after increasing 0.1 percent the prior month, a Labor Department report showed. The median forecast of 82 economists surveyed by Bloomberg called for a 0.1 percent rise.

“Inflation remains very low and that results in low yields,” said Guy LeBas, chief fixed-income strategist at Janney Montgomery Scott LLC in Philadelphia. “The markets are not really reacting that much. It’s largely in line.”

The difference between yields on 10-year notes and similar- maturity Treasury Inflation Protected Securities, a gauge of trader expectations for consumer prices over the life of the debt, was little changed at 2.15 percentage points. The average over the past decade is 2.21 percentage points.

The Treasury Department will sell $18 billion in five-year inflation-indexed bonds on April 17.

Medical Costs

President Barack Obama’s health-insurance law will hold down consumer prices for years to come as millions of Americans obtain coverage under the Patient Protection and Affordable Care Act, BNP Paribas SA and Credit Suisse Group AG said.

Costs for medical care increased 2 percent last year, the smallest gain in 65 years, according to data compiled by the Labor Department. In the two decades before the financial crisis, health-care expenses rose at more than twice that rate on an annual basis.

“Inflation is already very low, so having one more category that lowers it even more makes nominal Treasuries even more attractive,” Aaron Kohli, an interest-rate strategist at BNP Paribas, one of 22 primary dealers that trade with the Fed, said in an April 10 telephone interview from New York.

The 10-year yield will rise to 2.98 percent by the end of June before climbing to 3.35 percent by the end of the year, according to the weighted average of analyst estimates compiled by Bloomberg.

See the original article >>

Two Very Different Views On Soaring Food Inflation

by Tyler Durden

Two rather amusing, and quite opposing views on surging food inflation (recall that as we first reported beef prices are at record high), which was confirmed by this week's PPI and CPI reports: one from Goldman, the other from IHS Global. We let readers decide which one is right... and which one will determine the Fed's "thinking" about soaring good inflation.

First, some unintended humor from David Mericle, the latest addition to Goldman's economics team, which lost all credibility some time in 2010 when Hatzius got his first (of many) tap on the shoulder.

Impact of Higher Food Prices on Core Inflation Should be Modest

Agricultural commodity prices have risen sharply in 2014, with the S&P GSCI Agriculture & Livestock Index up about 15%. In addition, concerns ranging from droughts in California and Latin America to political tensions in Ukraine threaten to push food prices higher this year. Today, we assess the implications of higher food prices for the inflation outlook.

In the aftermath of spikes in agricultural commodity prices in 2007-2008 and 2010-2011, both retail food prices and core and headline inflation increased substantially. However, those episodes differed from the current one in two key respects. First, the food price spikes were about four times as large. Second, there were simultaneous spikes in oil prices that likely accounted for most of the pass-through to core inflation.

Our statistical model suggests that while agricultural commodity prices show moderate pass-through to food goods and food services prices, they have little impact on non-food core inflation. Both our model and the US Department of Agriculture's projections suggest that food prices should boost core inflation by roughly 0.05pp and headline inflation by about 0.15-0.2pp by end-2014. While ongoing droughts pose upside risk, a reversal of recent increases in grain prices--in line with our Commodity strategists' forecast--poses downside risk.

...

Looking ahead, we do not expect the recent spike in agricultural prices to continue through 2014. Our Commodities research group expects prices for wheat, soybeans, and corn to fall later in 2014, and our food equity analysts expect their Cost of Goods Sold Index to rise only moderately this year. Projections from the US Department of Agriculture point to roughly 2.5-3.5% growth in both food goods and food services prices, a bit higher than our model would predict if the Agriculture Index were to remain flat from its current level.

If the USDA forecast proves correct, it would imply that food prices will contribute about 0.19pp year-over-year to core PCE inflation by end-2014 (vs. 0.13 as of February), 0.39pp to headline PCE inflation (vs. 0.17), and 0.45pp to headline CPI inflation (vs. 0.21). Overall, we expect higher agricultural commodity prices to contribute about 0.2pp to headline PCE inflation and about 0.05pp to core PCE inflation. Food goods and services prices could of course also rise for unrelated reasons as the labor market tightens and new state minimum wage laws take effect.

In terms of risks to our forecast, further tensions in Ukraine or worse-than-expected drought effects pose upside risk, while declines in grain prices expected by our Commodities team pose downside risks. In addition, the forecast for an El Niño weather pattern developing this summer creates additional upside risk to soft commodity prices (palm oil, cocoa, coffee, sugar) and to a lesser extent to wheat prices. However, the El Niño weather pattern is also typically favorable to US summer growing conditions, which would create downside risk to our Commodity strategists' already-bearish forecasts for these crops, which are among the largest components of the S&P GSCI Agriculture Index.

In other words, as we also predicted previously, soon everything will be El Nino's, aka the "Solar Vortex" fault. As for Goldman's statistical model saying that all should be well, who are we to dispute it.

In the meantime here is a completely different view, one actually somewhat grounded in non-model reality, from IHS Global via Bloomberg:

Limited inventory of cattle and other herds contributing to rising costs this quarter, Chris Christopher, economist at IHS Global, writes in note.

Rising prices “a kick in the stomach for those households that have a hard time making ends meet.”  “Main story” of March CPI was food, with meat, dairy and fresh vegetables contributing to higher costs. Outside of food, inflation "relatively bland." However, "living standards will suffer as a larger percentage of household budgets are spent on grocery store bills, leaving less for discretionary spending."

But... core inflation will be untouched. Goldman's model said so. Which means nobody be concerned: certainly not Goldman partners and their live-in chefs.

The one thing that the two agree on, however, is that food inflation is surging. However there is good news:

  • BERNANKE SAYS HOUSEHOLDS WEALTH HAS BEEN RESTORED

One thing is not quite clear - whose households? Dimon's and Blankfein's?

See the original article >>

Economy In Pictures

by Lance Roberts

I have written extensively about the data behind the headline media reports. I have also discussed the importance of the relationship between the underlying data trends relative to broader macroeconomic perspectives.  However, it is sometimes helpful just to view the various economic indicators and draw your own conclusions outside of someone else's opinion.

With the economy now more than 5 years into an expansion, which is long by historical standards, the question for you to answer by looking at the charts below is:

"Are we closer to an economic recession or a continued expansion?"

How you answer that question should have a significant impact on your investment outlook as financial markets tend to lose roughly 30% on average during recessionary periods.  However, with margin debt at record levels, earnings deteriorating and junk bond yields near all-time lows, this is hardly a normal market environment within which we are currently invested.

Therefore, I present a series of charts which view the overall economy from the same perspective utilizing an annualized rate of change.   In some cases, where the data is extremely volatile, I have used a 3-month average to expose the underlying data trend.   Any other special data adjustments are noted below.

If you have any questions, or comments, you can email me or send me a tweet: @lanceroberts


Leading Economic Indicators
Durable Goods

Investment

ISM Composite Index
Employment & Industrial Production

Retail Sales

Social Welfare

The Broad View
Economic Composite

(Note: The Economic Composite is a weighted index of multiple economic survey and indicators - read more about this indicator)

If you are expecting an economic recovery, and a continuation of the bull market, then the economic data must begin to improve markedly in the months ahead. The problem has been that each bounce in the economic data has failed within the context of a declining trend. This is not a good thing and is why we continue to witness an erosion  in the growth rates of corporate earnings and profitability.  Eventually, that erosion combined, with excessive valuations, will weigh on the financial markets.

For the Federal Reserve, these charts make the case that continued monetary interventions are not healing the economy, but rather just keeping it afloat by dragging forward future consumption.  The problem is that it leaves a void in the future that must be continually filled.

In my opinion, the economy is far too weak to stand on its own two feet. With the Fed easing off the current rate of bond purchases, it will be interesting to see what happens in the months to come. While there will certainly be positive bumps in the data, as pent up demand is released back into the economy, the inability to sustain growth is most concerning. From this perspective, it could become increasingly difficult for the Federal Reserve to remove their "highly accommodative stance" anytime soon.

See the original article >>

Peak Coal

By: Ronald_R_Cooke

Comments about coal are usually not complimentary. Despite our dependence on it as a source of heat for electric power generation, environmentalists wish it would go away. On the other hand, advocates like to claim we have more than 110 years of coal left – “at present rates of consumption”. Both sides are overlooking crucial points. Let’s see if we can clarify the future use of coal as a fossil fuel resource.

To begin with, it is important to understand not all coal is of equal quality. When I was in grade school, we lived in a house that had a coal furnace. For those who could get it, the coal of choice of home heating applications was anthracite coal because it was the cleanest burning form of coal and provided – ton for ton – the most heat. Unfortunately, we humans have used up most of the readily available anthracite coal. Future consumption will depend on the other three kinds of coal: bituminous, sub – bituminous and lignite.

Most of the commonly produced (and consumed) coals are of two types:

·       Bituminous coal or black coal is a relatively soft coal that contains a tarlike substance called bitumen. It has a 45% to 86% carbon content. Although primarily used for steam powered electricity generation, high quality bituminous coal can be converted to a coking coal used in the production of steel and iron.

·       Sub-bituminous coal contains 35% to 45% carbon. Like bituminous coal, it is primarily used for the generation of steam powered electricity.

Other applications for bituminous coals include their use as a source of heat for kilns in the manufacture of cement and brick, heat for the smelting of metals, and as a source material for the manufacture of liquid fuels, methanol, fertilizer, shingles, and the coal tar we use for the manufacture of plastics, perfumes, mothballs, medicine, dyes, explosives and flavorings.  There are even a few coal fired steam locomotives in use.

As we use these coals up, what we will have left is a soft brown combustible sedimentary rock of relatively low heat content called lignite. Used as a steam coal to produce electricity, lignite has a low carbon content (25% to 35%). Because it contains relatively high quantities of ash and moisture, lignite is often called the “dirty” coal.

It is the carbon content of coal that supports the combustion process. The higher the carbon content, the greater the heat value per ton. Coals are also graded according to plasticity, and their moisture, volatile, ash, sulfur and chemical content. The values in the following chart are an approximation of ranges.

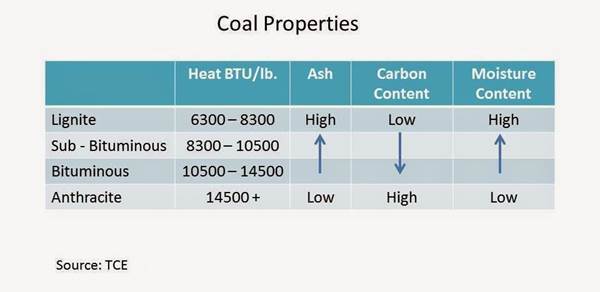
Generally speaking, power companies want the lowest ash and sulfur content, as well as the highest heat value per ton. That fact tends to favor the consumption of bituminous coal over sub-bituminous coal, and both of these coals over lignite. From 1992 through 2012, the total world heat content per ton of the coal we humans consumed fell by more than 10 percent. This means that as we become more dependent on the consumption of coals of lesser heat value, the rate of actual consumption (in tons) will have to increase in order to provide the same amount of heat energy.

Resources and Reserves

Although these two terms are often used as though they are interchangeable, they have very different meanings when we are discussing fossil fuels. The term “resource” refers to the maximum quantity of coal that exists on our planet, irrespective of density, form or location. Coal resource estimates vary widely (up to 11 trillion tons), and are the source of some confusion since many infer that all of this coal can be produced. Compared with current production, there are many who believe our coal reserves will last “forever”.

Unfortunately, most of these “reserves” are useless. We have the same logistics problem with coal that we have with oil. The resource base is far larger than the quantity that is technically and economically recoverable. Coal is embedded in other material (often multiple seams of other overlay), may exist far below the surface of the earth, and may occur in small quantities, irregular pockets, or thin layers that make production impractical. We expect some of this resource base (how much is unknown) is under the ice and oceans that cover vast areas of our planet. In order to produce coal, we must first find it and exploration is an uncertain undertaking. And finally, even if we find a seam of coal, it may not be technically or economically or politically feasible to go into production.

After the elimination of useless deposits, my guess (WAG) is that we humans have inherited approximately 3.4 trillion tons of coal. Of this, perhaps 1.1 to 1.3 trillion tons will eventually be produced.

And that brings us to reserves. When we talk about reserves there are possible reserves (it is possible they will be found and produced), probable reserves (we think we know where they are and believe they can be produced) and proved reserves (the location, size and characteristics of the coal deposit are known and have been evaluated).

According to World Energy Council data, we have proved reserves of over 400 billion tons of anthracite and bituminous coal, and over 450 billion tons of sub-bituminous and lignite coal left on our planet. The term “proved reserves” usually refers to those quantities of coal that geological and engineering information indicates with reasonable certainty can be produced in the future from known deposits under existing economic and operating conditions. In the following graph we can see that Europe and Eurasia have the largest proved reserves (35% by tonnage), followed by the Asia Pacific region (31%), and North America (28%). Most of the coal in the Europe Eurasia region can be found in Russia, Germany, Ukraine, and Kazakhstan. If Russia takes over the Ukraine and effectively dominates Kazakhstan, it will control 26 percent of the world’s proven reserves of coal.

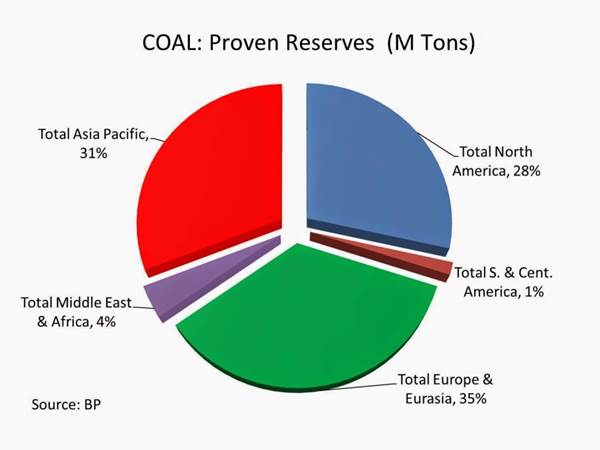
Higher prices for coal and evolving technology will increase our calculation of economically proven reserves. If my coal resource “guess” is approximately correct, we have 850 billion tons of proven reserves, 200 billion tons of probable reserves, and 250 tons of possible reserves left to consume on our planet. Fair warning: these are optimistic projections.

Proven reserves are broken down by type of coal in the next graph. Seventy percent of the coal found in Europe and Eurasia, 40 percent of the coal in the Asia Pacific region, and 54 percent of North American coal resource base is of lower quality sub-bituminous and lignite coals.

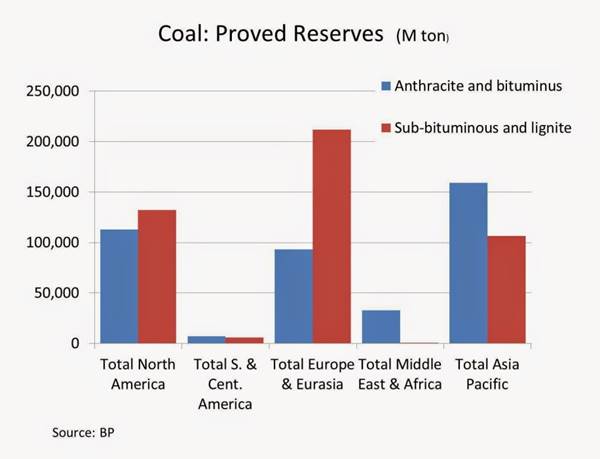
Consumption World coal consumption has been increasing and reached 3730 MTOE (Million Tons Oil Equivalent) in 2012. The largest national consumer is China. There was a slight decline in coal consumption within the United States and Europe from 1992 through 2012. Consumption within the Asia Pacific region, however, increased by 38 percent from 1992 through 2002, and 119 percent from 2002 through 2012. China now consumes more coal (50.6 percent of world consumption) than all other nations put together. That means, of course, China also pollutes the air with more combustion products from the consumption of coal than any other nation. (Note 1) Large coal fired plants are under construction or in proposal stages for many nations including China, India, Germany, Russia, Vietnam, Pakistan, Sri Lanka and on and on. These nations will not stop burning coal because they cannot stop. The consumption of coal is embedded in their economic policies.

In addition, over 3 billion people living in poor nations are looking for a better life. That means they need more steel (processed using coking coal), and a lot more electricity. One of the criticisms of the recent IPCC report is that it would seem to condemn people who happen to live in a poor nation to irreversible poverty – because the IPCC recommendations would severely limit their access to electricity. Thus while some Western nations may temporarily reduce their consumption of coal, international demand will increase – most notably in the Western Pacific region.

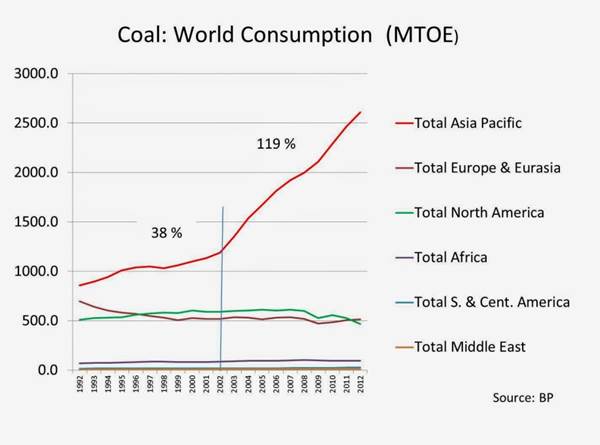
In the following graph, we can see how Chinese coal consumption (72%) dwarfs all other nations in the Asia Pacific region. National governments, particularly in China and India, are committed to economic expansion. China’s consumption of electricity is expected to increase, on average, by five percent per year through 2030. Although it is planning to reduce its reliance on coal for future power generation, China will likely build more than 300 new coal fired plants with a total capacity of 350 – 450 GW over the next 10 to 15 years. Japan is likely to increase its coal fired plant capacity by 30 percent over the next 10 years to replace, and augment, nuclear power generation. About 60% of India's thermal power generation comes from coal-fired power plants and this capacity is scheduled to expand by 500 GW (111 percent).

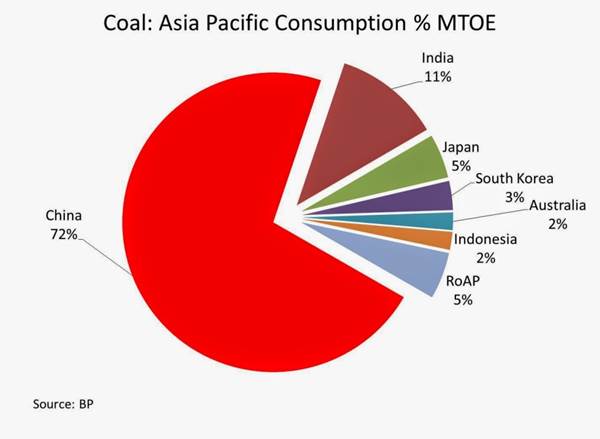
Production and Price Thus far, world coal production has kept up with this dramatic increase in demand. Total world coal production increased by 10 percent in the period from 1992 through 2012, and by 60 percent from 2002 through 2012. World production now exceeds 3845 MTOE per year.

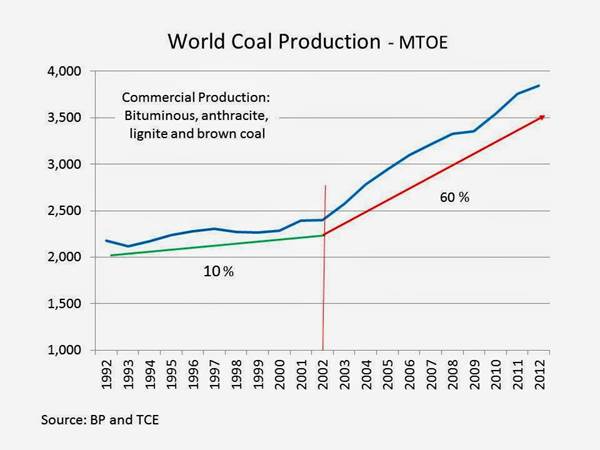
As one would suspect, a growing demand for coal has stimulated higher prices. The United States Central Appalachian index has increased 148% from ~ $29 per ton in 1992 to ~ $72 per ton in 2012. The price the Japanese pay for imported steam coal increased 179% from ~ $48 per ton in 1992 to $ 134 per ton in 2012. Note that coal price increases accelerated between 2002 and 2012. World energy prices for all fossil fuels spiked in 2008, causing food riots in several nations. Coal was no exception even though its consumption had little direct effect on food production. Excess production caused a supply/demand imbalance in 2012 and coal prices subsequently declined in 2013. It is probable that the price of coal will again resume its upward trend before 2016.

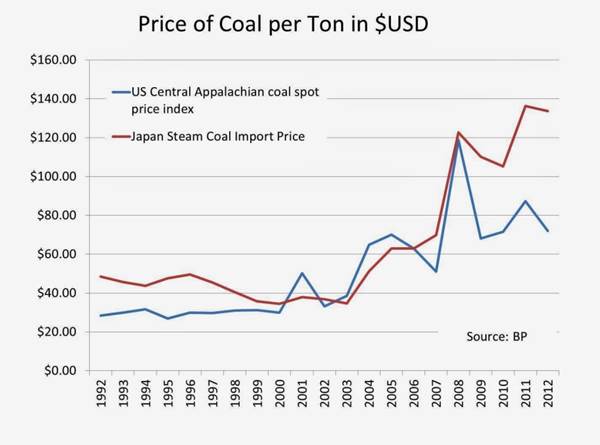
The price of coal is probably more elastic than the price of oil or natural gas because most of the direct consumers are either corporations or national governments. These entities pass escalating coal prices on to the consumer in the form of higher prices for electricity and mass produced goods. The pain of higher indirect coal prices is spread over a large base of consumers. However, there are limits to indirect price escalation and we should expect consumers in developed nations to become increasingly interested in energy conservation and the purchase of goods that use less electricity.

We should also be aware that long term coal prices tend to be influenced by the price of natural gas and oil. Oil prices are projected to increase substantially as we approach peak oil, and that will increase national interest in the conversion of coal into motor fuel. This will have an upward effect on both the demand for coal and the price of coal per ton.

Peak Coal In terms of Peak Coal, we actually will have two peaks: one measured by heat content, and one measured by maximum tons produced. Considering the decline of our anthracite resources, and the increasing production of sub-bituminous and lignite coals, there are those who believe we have already passed Peak Coal based on heat (energy) content.

After we take all of these factors into consideration, and make our assumptions about resource availability, production, consumption, price escalation, consumer behavior, government response, and so on....  we can (with some apprehension) calculate the date of Peak Coal. Between 2012 and 2035 annual coal production will increase by ~47 percent. Production begins to stall around 2030, and the curve flattens through the year of peak production - 2035. Thereafter it declines rather quickly because the remaining reserves are more difficult and costly to exploit. Please note there is a lot of production after 2035. But annual average production decreases with each passing year. We will probably be into the next century before the last nugget is pulled from the ground, and that – of course – is what people think they mean when they say... “We have enough coal to last 110 years”. We will have some coal left, but not enough to satisfy demand. Not even close.

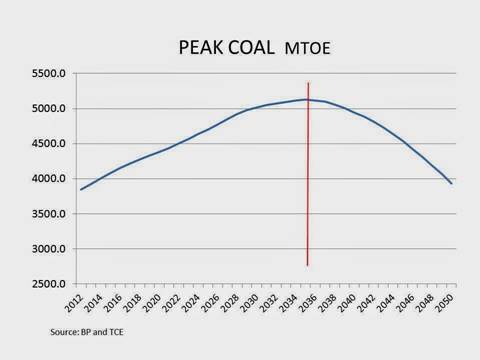
So... just how good is this prediction? It is not a number I pulled from a hat. It is backed by hours of research and a rather large spread sheet. Never-the-less, there are a few analysts who believe I am being too optimistic. On the other hand, most pundits, particularly those associated with the coal industry, will probably assert I am far too pessimistic. (Note 2)

The strength of this prediction depends on several factors which are unknown and unknowable. For example, there is always the hope we humans will find additional seams of coal south of the equator, or in Siberia, or off shore Australia, or in Canada. In situ coal seam gasification would open up additional offshore and under ice resources as well as onshore reserves to production. If we find a way to exploit an additional 200 billion tons of coal, that would delay Peak Coal by perhaps 25 – 35 years, and move the date of Peak Coal to ~ 2065.

So, in the final analysis, we just do not know the date of Peak Coal. We can only make our estimates based on current data that is available to the public. Unless we substantially increase our proven reserves, that information definitely indicates Peak Coal will occur before 2050.

But - I could be wrong. You decide.

See the original article >>

About That “Strong” March Retail Sales “Bounce”: Good Thing Summer’s Coming!

by David Stockman

What would we do without the Wall Street Journal? Do people actually pay for this lame-brained noise?

Retail Sales Surge as Consumers Rev Up Growth

Indicator Posts Best Monthly Growth Since September 2012

In fact, we are now entering the fourth season of head-fakes about “escape velocity” acceleration in as many years. Yet the Wall Street stock peddlers and their financial media echo boxes are so fixated on the latest “delta”—that is, ultra short-term “high frequency” data releases—that time and again they serve up noise, not meaningful economic signal. The former is perhaps good for a pre-open futures ramp by the algos upon the 8:30 AM headline release, but nearly useless as to the real direction of America’s struggling economy.

The WSJ headline writer quoted above might have at least noted the context in which the 1.1% seasonally mal-adjusted bounce for March was reported yesterday. It seems that even giving allowance to what the Fed believes to be the ”insufficient” level of consumer inflation in recent months that the February starting point for yesterday’s report was down nearly 1% from its level last September. So when the winter storms are all said and done and the inflation adjusted retail number for March is published, it will be back to about $183 billion on the graph below—a level obtained around Columbus Day last fall. It’s a good thing summer’s coming!

The larger point here is that the Kool-Aid drinkers keep torturing the high frequency data because they are desperate for any sign that the Fed’s $3.5 trillion of QE has favorably impacted the Main Street economy. And that’s important not because it might mean some sorely needed income and job gains for middle America, but because its utterly necessary to validate the Fed’s financial bubble. Without ”escape velocity” thru and sustainably above 3-3.5% GDP growth, there is no chance of a corporate earnings re-acceleration or the 20-30% gain in S&P 500 profits that are backed into the current forward PEs ($130 per share vs. reported LTM of $100).

Yet is it really not that hard to strain the noise out of the numbers. The starting point is to recognize that the Keynesian economists’  almost maniacal focus on monthly and quarterly GDP numbers has always been a giant mistake— and not only because they are so consistently and significantly revised after the fact owing to plugs, guesses and imputations in the early releases. The real problem is structural because quarterly GDP numbers are based on 90-day rates of ”expenditure”.  The latter contains huge oscillations in the economy’s inventory stocking and destocking function, and therefore can drastically mis-convey the underlying trends.

During the past 18 quarters for example, real inventory change has ranged from -$207 billion to +$127 billion, with points up and down the range during the interim. So a far more sensible use of even the flawed GDP data is to look at the year-over-year data for real final sales. That captures the trend and thereby filters out the four fake GDP accelerations that Wall Street has been gumming about since the end of the recession.

Here are the numbers.  During the year ending in Q4 2010—the first year of “recovery”—real final sales expanded at a 2.0% rate. The next year there was no accelerated: Real final sales in the year ended in Q4 2011 was 1.8%—then it slightly bounced to 2.5% in 2012. But despite the initially reported big GDP acceleration in the second half of 2013–not such thing actually happened.

In fact, the four quarter gain in real final sales as of the most recent reporting on Q4 2013 was just 1.9%; and given the weak spending data already in for Q1 2014, its virtually certain to weaken this quarter. In short, on any reasonable and adult assessment of the numbers for the last 51 months, there has been no acceleration whatsoever. The economy is bumping along the bottom at 2% and that’s it.

Moreover, the problem with the 2% trend who’s name cannot be spoken is that it invalidates the entire bubble recovery scenario in which the inhabitants of the Eccles Building and their Wall Street overlords are completely invested. What has actually happened since the fall-winter 2008 crisis is that there was a drastic and unavoidable one-time liquidation of excess business inventories and phony jobs that had built-up during the Greenspan housing and credit bubble years, but that was nearly over by June 2009. This is documented in detail in Chapter 28 of my book, The Great Deformation (see pp 583-588, “The False Depression Call That Petrified Washington).

Since then, the natural regenerative forces of our $17 trillion  capitalist economy have been slowly inching output, income and employment forward at the aforementioned 2% rate if you believe the official inflation data, and well less than that in reality. But the Fed’s massive money printing spree has nothing to do with it because the credit expansion channel of monetary policy transmission is broken and done. As I have repeatedly mentioned, once “peak” business and household leverage ratio where reached in 2007-2008, the Fed’s massive liquidity injections operated almost exclusively through the Wall Street speculation channel, and that is exactly what has lead to forlorn quest for “escape velocity”.

The trailing 12 months reported EPS for the S&P 500 in Q4 2011 was about $90 per share, and today it is about $100. But while earnings have grown only 5%/year on a mechanical basis, and hardly at all after giving allowance to the massive cheap debt fueled stock buybacks in the interim, the broad market has bubbled up by more than 40%. In other words, its now extend out on the same peak—about 19X trailing profits—that was obtained before the crashes of 2000-01 and 2008-09.

Nevertheless, the Wall Street talking heads can’t help themselves with the constant ridiculous refrain that the consumer is back, and its soon off the races:

The linchpin of economic growth, the consumer, is back,” said Chris Rupkey, chief financial economist at Bank of Tokyo-Mitsubishi.

Oh, really. Real wage and salary income is only 1% above its level 73 months ago when the economy last peaked. After an salutary rebound in the savings rate during the Great Recession, the household savings rate has been drawn down to its unsustainable bubble lows. But pettifoggers like Rupkey just keep pouring the Kool-Aid.

So Fed sponsored Wall Street bubble inflates to its final asymptote. When the inevitable bust, in turn, triggers are sharp retrenchment in business inventories, investment and consumer spending, the usual suspects will say its time to restart the Keynesian Clock—-the one that is now permanently broken but never acknowledged by our rulers in the Wall Street-Washington corridor who long ago through sound money and the laws of economics to the winds–in a desperate attempt to hang on to ill-gotten power and wealth.

In any event, in today’s post by Jeffrey Snider, it is evident that we just had winter; that the three month retail spending average including the ballyhooed March bounced was the second weakest of this century, and that the fifth annual spring time leap into “escape velocity” is nowhere in sight.

ABOOK Apr 2014 Retail Sales wout Autos Jan Mar

See the original article >>

What Happens When ‘All Assets Have Become Too Expensive?’

by AuthorWolf Richter

A new report from Natixis, the asset management and investment banking division of Groupe BPCE, the second largest bank in France and one of the largest megabanks in the world with over $1.4 trillion in assets, predicts what daredevil voices at the maligned margin of financial analysis have worried about for a while: the likelihood another financial panic.

It will be caused ironically by the very mechanisms that are still used to “fix” the last financial crisis: money-printing and asset-purchases by major central banks around the world that unleashed a global flood of liquidity, month after month, for over five years.

Most of this practically unimaginable mountain of moolah that has landed in the laps of banks, institutional investors, hedge funds, private equity firms, and other speculators has not been used to boost lending to the private sector in OECD countries, the report confirmed, and thus has not contributed to the recovery of the real economy in those countries. Instead, it has been poured into financial assets and has artificially goosed their valuations.

This money sloshing through the system and the persistence of zero-interest-rate policies have driven desperate investors ever further out into “all risky asset classes,” including emerging assets, junk-rated corporate credit, Eurozone peripheral debt, and equities. That buying pressure has inflated their valuations even further. And in the emerging markets, it led to an appreciation of exchange rates.

After the May 2013 revelation that the Fed was thinking about tapering its asset purchases, previously considered QE Infinity, there was a whiff of panic. Capital began to flee emerging economies, and their asset prices and exchange rates swooned. But now, the hot money is pouring back into emerging assets, once again inflating valuations and exchange rates.

Investors are holding their noses and closing their eyes, and they’re buying even the crappiest debt of peripheral Eurozone countries, motivated by the ECB’s 2012 pledge to do “whatever it takes” to keep the Eurozone together. So an international feeding frenzy broke out over the bonds that the Greek government sold last week, only a couple of years after prior bondholders had been treated to a terrible haircut. Valuations were so excessive that the paper, larded with risks and supported by an economy in shambles, yielded less than an FDIC insured one-year CD did before the crisis. 

At the same time, starting in 2012, “we saw large buying flows of corporate bonds.” Credit spreads tightened and risk premiums evaporated. With unlimited new and nearly free money available to junk-rated companies that would otherwise have trouble servicing their debt, default rates have been low. But default rates explode when the tide turns, as it did during the financial crisis, and this is going to happen again:

And investors have been plowing money into equities and whipping many indices around the world from one high to the next, “despite the geopolitical risks and the uncertainties lingering over growth.”

This is exactly what the Fed and other central banks have explicitly wanted to achieve with their staggered and well-coordinated waves of QE. They’ve separated markets from reality. They’ve eliminated gravity. They’ve created that infamous wealth effect. As a result, “investors are ignoring the risks weighing on the different asset classes”:

  • External deficits and “virtual stagnation” of industrial production in the large emerging countries
  • Credit spreads that no longer cover the average risk of corporate default over the maturity of a bond
  • Still rising public debt ratios in the peripheral Eurozone countries
  • Soaring non-performing loans at banks in peripheral Eurozone countries; a horror picture belying any official protestations of a banking recovery:

And then the report added gingerly, not wanting to be held responsible for having created a stock-market panic on its own: “If share prices continue to rise, the valuation of equities will become abnormally high in relation to past levels....”

“We can see where this is heading,” the report said. Namely toward a situation where the prevailing “abundance of liquidity” and near-zero returns on risk-free assets are driving investors into emerging assets, corporate credit, Eurozone peripherals, and equities. And then “all risky asset classes will become overvalued.”

And what are investors going to do, once they open their eyes and figure this out?

The report by the second largest megabank in France, one of the largest in the world, the epitome of mainstream finance, comes to the same conclusion that those intrepid but maligned voices on the margin of financial analysis have offered for a while: “There are grounds to fear an episode of widespread panic among investors,” who would try to dump all risky assets at the same time, with buyers running for the exits too, “as we saw in 2008 and 2009.”

Fasten your seatbelts, they’re saying.

“Biotech Stocks’ Rout Perplexes Analysts” the WSJ headlined the phenomenon, as analysts continue to hype this stuff to small investors. But hedge funds are dumping stocks, and private equity firms are dumping their LBOs. That’s the Smart Money. They’re getting out.

See the original article >>

Weather, reports and Ukraine keep grain traders guessing

By Allendale Inc.

Corn: Thanks to rains over the weekend and the forecast for three cold days in the Midwest, the corn market was able to find early support. Given that the forecast only calls for three to four cold days followed by another warm up, the buying was on a limited basis, unable to even reach Friday’s highs.

With funds quiet and weather offering only small bounces, both old and new crop corn could be stuck just above the 500 level until larger news is seen. At noon, the one- to five-day and six- to 10-day forecasts did reduce rains, which will also encourage selling of bounces on thoughts that planting may only end up slightly delayed.

During the day-trade hours, analysts expected Monday’s first planting pace number to come in at 3% complete vs. the five-year average of 6-7%. While bulls will make the case that this is truly “delayed,” they had better hope for even more rain before expecting too much of a bounce. Bears will quickly sell bounces but also need to recognize that heavy support appears just under the 500 level. To start the week, more general sideways trading is expected until later planting progress reports can show a true delay or active planting where a breakout will finally be seen…Ryan Ettner

Soybeans: The soybean market caught a bid Monday, even though the major news that would seem to move the market was absent. The monthly NOPA crush will be released Tuesday and that is anticipated to be bullish so that might have provided some support to the market. The weekly export inspections came in at a disappointing 267,939 tonnes. The trade was looking for inspections to come in between 325,000 and 425,000 tonnes. Last week inspections came in at 509,603 tonnes.

Tuesday, NOPA will release its estimate of March soybean crush at 11 a.m. Central. The trade is expecting 146.1 million bushels. If so, that would represent a strong number at 7% over the previous March. That would help push the September to March total at 1.3% over last year. USDA’s current September to August estimate is 0.2% under last year. If the crush comes in at the trade estimate it would mean that the rest of the year’s crush would have to run 3.2 % below last year’s low crush number to reach the USDA current estimate.

News out of China continues to point to more soybean defaults down the road. The consensus is that 2 mmt of beans will probably be defaulted on. It is just a matter of timing.

Allendale does not recommend chasing the bean market higher as our price targets for old crop soybeans were filled weeks ago. As for new crop, we expect sharply lower price action to develop after planting. Our downside target is $9.25 for November…Jim McCormick

Wheat: Wheat finished higher Monday after we watched the situation in the Ukraine escalate and rains were disappointing in the U.S. plains. There were concerns about acres being abandoned, which could artificially inflate yield while at the same time decrease production. We were expecting a further decline in overall ratings as Texas and Oklahoma wheat continues to be reported as disappointing.

We are still trading above the long-term uptrend line and until we see this line break we are still expecting this market to move higher.

Russia is continuing to show interest in taking over additional portions of the Ukraine, and this does represent a portion of their grain production and the Ukraine doesn’t have much they can do to fight back. The export market in the United States is still firm as we have seen good demand for U.S. exports, but we will be competing with Canada for the world export market not to mention the Black Sea region that might be eager to export wheat amid increasing political tension. Continue to look for higher trade until we break the current uptrend.

See the original article >>

The Alienation of Work

by Charles Hugh Smith

The emerging economy is opening up new ways to reconnect workers to their work and the profits from their work.

One of the most striking blind spots in our collective angst over the lack of jobs is our apparent disinterest in the nature of work and how work creates value. This disinterest is reflected in a number of conventional assumptions.
One is the constant shedding of tears over the loss of mind-numbing manufacturing jobs. I doubt a single one of the innumerable pundits decrying the loss of "good manufacturing jobs" spent even one shift in an actual assembly line. There is a reason Henry Ford had to pay the then-astronomical salary of $5 per day to his assembly-line workers: the work was so physically demanding and boring that workers quit after a single shift. The only incentive that would keep people doing such hellish work day in, day out, was a big paycheck.
Henry Ford's $5-a-Day Revolution

After the success of the moving assembly line, Henry Ford had another transformative idea: in January 1914, he startled the world by announcing that Ford Motor Company would pay $5 a day to its workers. The pay increase would also be accompanied by a shorter workday (from nine to eight hours). While this rate didn't automatically apply to every worker, it more than doubled the average autoworker's wage.
While Henry's primary objective was to reduce worker attrition--labor turnover from monotonous assembly line work was high--newspapers from all over the world reported the story as an extraordinary gesture of goodwill.

Another is the confusion over what constitutes the means of production in a knowledge economy. The term means of production has its origins in Marx's analysis of capitalism, but the means of production change along with the processes of creating value.
As a result, Peter Drucker identified the worker's knowledge (human capital) as the means of production in a knowledge economy in his book Post-Capitalist Society.
Many readers have misunderstood Drucker's point; their objections include 1) the software workers use is essentially owned by Microsoft and other corporations; 2) only corporations have the means to use workers' knowledge and 3) means of production is an outdated Marxist term that is being mis-used by Drucker.
These objections miss the point. A skilled knowledge-worker can create $100,000 of value with a $500 PC and $300 of software. What percentage does the software represent of the output ($100,000)? Not even 1%.
As for corporations being the only owners of capital who can deploy workers' knowledge, millions of self-employed people suggest that this blanket statement is not entirely true. Yes, enterprises that deploy billions of dollars in material capital (oil drilling rigs, shipyards, etc.) cannot be replaced by the self-employed, but what percentage of the economy requires billions of dollars in capital to operate? In a service-dominated economy, capital-intensive industries are a shrinking slice of the pie.
Rather than focus on employment, why don't we examine the nature of work? Why don't we ask how work creates value in a knowledge economy that is commoditizing/automating whatever labor can be commoditized/automated? How about asking if work can be re-shaped to become meaningful beyond the paycheck being earned?
Let's review the idea that work that isn't controlled and owned by the workers is inherently alienating.

In Marx’s view, workers were alienated from the product of their work because they did not own the product or control the means of production. Marx argued that the absence of ownership and control was also an absence of agency (control of one’s destiny) and meaning. Workers were estranged from the product of their work, from other workers and from themselves, as the natural order of the product of work belonging to the one who produced it was upended by capitalism.
Marx characterized this separation of work from ownership of the work and its output as social alienation from human nature. Capitalism, in his view, did not just reorder production into enterprises whose sole goal was profit and accumulating more capital; it destroyed the natural connection between the worker, the processes of work and the product of his work.
Marx was thus one of the first to analyze work not just in terms of economic output but in social and psychological terms.
This tradition was carried on by writers such as Eric Hoffer, who saw work as the source of life’s meaning, and Christopher Lasch, who saw the rise of consumerism as the basis of meaning and the rootless cosmopolitanism of the modern economy as the source of a culture of narcissism. For Lasch, the relentless commoditization of life disrupted the natural social relations of family, social reciprocity and the workplace, depriving individuals of these sources of meaning and replacing them with an empty consumerism that worshipped fame and celebrity.
Lasch explained these dynamics in his landmark book The Culture of Narcissism: American Life in an Age of Diminishing Expectations.
The marketplace's commoditization of everyday life--both parents working all day for corporations so they could afford corporate childcare, for example--created two alienating dynamics: a narcissistic personality crippled by a fragile sense of self that sought solace in consumerist identifiers ( wearing the right brands, etc.) and a therapeutic mindset that saw alienation not as the consequence of large-scale, centralized commoditization and financialization but as individual issues to be addressed with self-help and pop psychology.
In Lasch’s view, both of these dynamics ignored the loss of authenticity that resulted from the commoditization not just of production but of every aspect of everyday life. In this sense, Lasch’s social analysis is an extension of Marx’s original insight into the alienating dynamics of commoditized wage-work, in which workers and their work were both interchangeable.
Lasch’s analysis brings us to the source of modern alienation: it’s not just employees who are interchangeable--employers are equally interchangeable. The interchangeability of work, employees, employers, products and services is the key characteristic of commoditization.
What is the takeaway for those seeking a job or career? There are several takeaways.
One is that the sources of value creation are linked to the level of agency (control of one’s work) and ownership of the work: work that is not process-based (i.e. that cannot be commoditized) and that is experientially sensitive to mastery enables a higher level of agency and ownership because the worker owns the means of production--his human and social capital.
The second is that the dramatic lowering of barriers to education and the ownership of tools powered by the Internet has greatly expanded the opportunities to escape an alienating dependence on the state and cartels for employment and on superficial consumerism for meaning.
If we trust networks rather than states or corporations for our security, we automatically gain agency (control of our work and lives) and an authentic sense of self gained from owning our work and the results of our work.
It is important to understand that corporations exist to make a profit and accumulate capital, for if they do not make a profit and accumulate capital they will bleed capital and disappear. To believe that organizations dedicated to making a profit could magically organize society in ways that benefit every participant is nonsense. Corporations organize labor and capital to accumulate capital. It is absurd to expect that such organized self-interest magically optimizes the social order.
This is not to blame all the ills of society on corporations; it is simply to note that corporations are limited by their limited purpose. Their purpose is not to organize a healthy, sustainable economy; it is to organize labor and capital in such a way that the corporation can accumulate capital in a marketplace controlled by supply and demand.
Corporations have profited greatly from the alienation of work and the social order, as narcissistic debt-based consumerism is a highly profitable economic order, even if it is socially dysfunctional, unsustainable and destructive to individual agency and meaning.
The expansion of decentralized, distributed networks, the near-zero cost of knowledge and the declining cost of the means of production (digital memory and processors, software, 3-D fabrication machines, robotics and tools) offer newfound opportunities for workers to reclaim their agency and ownership of their work and output.

Rather than rely on centralized states and corporations to organize labor and capital, collaborative networks can do so without alienating workers from their work and disrupting the sources of meaning.
The emerging economy is opening up new ways to reconnect workers to their work and the profits from their work. These include traditional models such as self-employment and worker-owned cooperatives and new models of collaborative project-based work.
How do we change a dysfunctional, unsustainable and alienating system? By investing in new ways of creating value and alternative models of cooperative work and ownership.

See the original article >>

US Stocks Are 50% Overvalued … It’s Time to Get Out

by Bill Bonner

Buy Them When They're Cheap

The Dow fell 143 points on Friday. Gold was just about flat. Why the fall in stock prices? Many reasons were proposed, but no one knows for sure. There may not be a reason at all. Stocks don’t need a reason to fall. From time to time, they just do. Not to put too fine a point on it, but asset prices go up … and then they go down. Always have. Always will.

Generally, it’s a credit expansion that drives them up. A credit contraction takes them back down. Credit is still expanding, says economist and author of The New Depression: The Breakdown of the Paper Money Economy Richard Duncan. But come the next quarter, watch out. Duncan reckons “excess liquidity” (as he calculates it, the surplus left over between QE stimulus and what the federal government absorbs through borrowing) is going to contract – sharply.

It hardly matters to us anyway. We buy stocks when they are cheap, not expensive, relative to their historic average. And on a CAPE (Cyclically Adjusted PE Ratio) of 24.7, the S&P 500 now trades at a 50% premium to its historic average CAPE of 16.5. My advice: Get out. And stay out, until the index is cheap again.

Thin Margins

Last week, we mentioned how life on the ranch here in northwestern Argentina toughens you up. Physically … and otherwise. Our business career, for example, has been soft and charmed. In the publishing industry – the only one we really know – cleverness is rewarded. Good ideas and hard work pay off.

But here it doesn’t matter how clever you are … or how hard you work. Margins are as thin as the desert air. Profits are as scarce as the grass. When a man reaches a certain age, he is ready for a new challenge. His career winds down … or comes to an abrupt halt. He needs something to occupy his time and his remaining energy.

His wife is usually fully behind him. The last thing she wants is an idle husband left with nothing to do; he might decide to reorganize the kitchen! Some turn to golf. Some turn to new businesses. At least one bought a cattle ranch in South America, which turned out to be a good place to grow high altitude Malbec grapes.

We spent all of Thursday and most of Friday cosechando (harvesting). We shuffled along the rocky soil on our hands and knees reaching up to cut off bunches of grapes … tossing them into a plastic bin … and then scraping along to the next vine. This went on long enough to convince us that we weren’t cut out for this kind of work. Our knees hurt. Our back and legs ached. Our shoulders were sore.

It really didn’t suit any of the “old guys” helping with the harvest. Nolberto’s body is twisted from a lifetime of hard work. He is one year younger than we are … but has suffered a lot more wear and tear. Jorge is two years younger. He complains of arthritis in his shoulders and arms. Natalio is seven years younger. He has no complaints. But he moves more slowly than the younger men.

Older and Wiser?

An older investor is perhaps a better investor – if he is still solvent. He is a survivor. He is wiser for it. He has seen more scams, crackpot theories and pie-in-the-sky business plans than a younger man. But age is no advantage to the cosechero (harvester) – even one who has been toughened up by life on an Andes ranch.

In business, too, age can be an advantage. An older man is more suspicious and more cynical. He expects trouble and setbacks. He is rarely disappointed.

He is also wary of business plans. Especially his own. But people run businesses for a variety of reasons – not only to maximize earnings … and rarely to maximize shareholder value. Many businesses are run for pleasure, self-aggrandizement, vanity, spite or just cussedness.

Art galleries, boat charters, yoga studios, airlines, fancy rental properties – and vineyards – rarely make money. At least, in our experience. Most often, they are things that people want to do … and justify it with a hope. Paris pied-à-terre apartments – for example – are bought because people think it would be cool to have their own place in the City of Light. Then they set it up as a rental, telling themselves that the place “will pay for itself.” Sometimes it does.

Likewise, an art gallery is often a vanity project. An art lover feels he should inflict his tastes on the community. So he sets up a gallery where everyone who walks by will see what he considers decent, or perhaps provocative, artwork. He convinces himself the project will “at least break even on operating costs.” Perhaps it does – sometimes.

As a general rule, the more attractive a business – socially, artistically, environmentally or ethically – the more money it will lose. Nobody brags to his friends about his used auto-parts business … or his ghetto payday loans or his 24/7 liquor outlet. Nobody enters these businesses, except for the money. And the money tends to be good.

The money from an Argentine ranch run by a North American rogue economist? Bad.

Details to follow when we next convene … which may not be tomorrow. Another aspect of life here at the ranch is the reliability, or lack thereof, of our Internet signal, which comes by way of satellite. I apologize in advance for any further outages, which are a common enough occurrence these days.

SP-and-PE10
S&P composite price and CAPE (Shiller P/E or Cyclically Adjusted Price Earnings Ratio), via Doug Short /Advisor Perspectives. Cheap is something else – click to enlarge.

The above article is from Diary of a Rogue Economist originally written for Bonner & Partners. Bill Bonner founded Agora, Inc in 1978. It has since grown into one of the largest independent newsletter publishing companies in the world. He has also written three New York Times bestselling books, Financial Reckoning Day, Empire of Debt and Mobs, Messiahs and Markets.

See the original article >>

The Abenomics Surprises Just Keep Coming …

by Pater Tenebrarum

A Failing Scheme

Our idea that the Nikkei writes the news remains uncontested by any contrary developments. It still does. Since its peak at 16320 points on the final trading day of 2013, the Nikkei has lost 14.7% – and so it is no wonder that the 'miracle of Abenomics' continues to get the bad press it so richly deserves.

Note that it would be deserving of bad press even if the Nikkei index had not declined, but the ups and downs of the index seem to be in control of the public view of 'Abenomics' and what the media report about it.

Nikkei

The Nikkei has declined by about 14.7% since its late 2013 peak. Over this period of time, doubt about 'Abenomics' has increased – click to enlarge.

The theory behind Abenomics is as hoary as it is misguided. Allegedly, Japan has been in a long lasting economic stagnation due to 'deflation' -  meaning, in this case, not a decline in the money supply (that never happened), but the occasional, barely noticeable decline in consumer prices. Note that these minuscule declines in consumer prices have occurred in what is widely acknowledged to be one the most expensive places in the world. Until it was topped by Singapore in 2014, Tokyo has been regularly taking the top spot as the world's most expensive city. The main reason why it is considered 'cheaper' nowadays is the slide in the yen's exchange rate – but that has actually made it even more expensive for the Japanese. Only, now Japanese citizens will find other cities also very expensive, as they are forced to use a cheapened yen if they want to visit them.

If printing more money and pushing prices higher are what it takes to magically 'create economic growth', one must wonder why emperor Diocletian's coin clipping scheme and John Law's Mississippi bubble failed. Why hasn't even a single one inflationary scheme that has been tried in the course of history succeeded?

The answer should be obvious: printing money cannot create real savings or capital. This does not mean that it has no economic effects, and initially, these effects often appear to be positive, as a boom is usually set into motion. Everybody feels good, as asset prices rise and economic activity seems to revive. But the boom is always built on quicksand. It creates no real wealth: scarce capital will be malinvested and ultimately consumed.

Inflation is Actually Not 'Helping' Anyone in Japan

Japan is facing a demographic problem. Its population is declining and aging rapidly. More and more people need to rely on their savings to make ends meet. Unemployment meanwhile is very low, as the active labor force is shrinking. It is not immediately obvious which problem Abenomics was supposed to 'solve'. Only one conclusion makes sense: the government is trying to reduce the burden of its own debt in an attempt to 'inflate it away'.

This means however that the inflationary push is mainly meant to act like a tax on everyone in Japan. The government might as well have raised taxes outright.  Here is a recent Bloomberg report confirming that this is exactly how it feels for Japan's citizens, although the report contains the usual canards about 'Japan's 15 years of deflation' and the alleged 'benefits' of replacing it with monetary debasement.

“Prime Minister Shinzo Abe's bid to vault Japan out of 15 years of deflation risks losing public support by spurring too much inflation too quickly as companies add extra price increases to this month's sales-tax bump.

Businesses from Suntory Beverage and Food Ltd. to beef bowl chain Yoshinoya Holdings Co. have raised costs more than the 3 percentage point levy increase. This month's inflation rate could be 3.5 percent, the fastest since 1982, according to Yoshiki Shinke, the most accurate forecaster of Japan's economy for two years running in data compiled by Bloomberg.

The challenge for Abe and the Bank of Japan is to keep the public focused on the long-term benefits of exiting deflation when wages are yet to pick up and, according to BOJ board member Sayuri Shirai, most people still see price gains as "unfavorable." Any jump in inflation that's perceived as excessive by a population more used to prices falling could worsen consumer confidence and make it harder to boost growth.

"Households are already seeing their real incomes eroding and it will get worse with faster inflation," said Taro Saito, director of economic research at NLI Research Institute, who says he's seen prices of Chinese food and coffee rising more than the sales levy. "Consumer spending will weaken and a rebound in the economy will lack strength, putting Abe in a difficult position."

(emphasis added)

What a surprise! Consumers are actually unhappy that an inflation tax has been imposed on them. As to Abe needing to “keep the public focused on the long-term benefits of exiting deflation”, one might as well say that his challenge is to keep the public believing a bald-faced lie.

Economic growth has absolutely nothing to do with rising consumer prices. In fact, mildly declining prices and the associated increase in real incomes are the hallmark of an unhampered market economy using sound money. Even the Federal Reserve was forced to admit in a 2004 study (Atkeson, Andrew and Kehoe, Patrick/Federal Reserve Bank of Minneapolis. Deflation and Depression: Is There an Empirical Link? / h/t Chris Casey ) that 'no empirical link between deflation and depression could be established'. Obviously, Ben Bernanke has never read this study, and neither have Janet Yellen or Mr. Kuroda for that matter. Here is a verbatim quote from the study:

“… the only episode in which we find evidence of a link between deflation and depression is the Great Depression (1929-34). We find virtually no evidence of such a link in any other period. … What is striking is that nearly 90% of the episodes with deflation did not have depression. In a broad historical context, beyond the Great Depression, the notion that deflation and depression are linked virtually disappears.”

(emphasis added)

Again, no-one should be surprised that in-depth empirical studies actually tend to agree with what should be clear from economic theory anyway, although one must not lose sight of the fact that empirical studies cannot serve to 'prove' or 'disprove' the correctness of a theory. In this respect, economic theory differs from the natural sciences, which allow for conducting controlled and repeatable experiments. No such experiments can be conducted in economics and every slice of economic history is highly complex and unique and co-determined by a multitude of factors. Even though the laws of economics are always operative, it is not possible to deduce them or prove or disprove them from the study of economic statistics.

From a theoretical point of view it can be shown that real economic growth is indeed possible without expanding the supply of money and that it perfectly agrees with falling prices for consumer goods. Entrepreneurial profits do not depend on the direction of consumer prices, they depend on the price spreads between inputs and outputs. As we have frequently pointed out, if this were not the case, the computer industry – indeed, the entire electronics industry – would have been in a permanent economic depression from the day it was born.

As to Japan, while its consumer price index has declined ever so slightly since  the late 1990s, prices remain about 11% above their level of 1989, the year in which Japan's mega-bubble blew out and inflationary credit growth by private banks went into reverse.

The mild decline in prices since the late 90s has been a boon for Japanese consumers, who in this time period were pretty much the only people in the world that were not burdened by their money continually losing its purchasing power (always keeping in mind the drawbacks of such measures as 'CPI').

Shinzo Abe and the BoJ under Haruhiko Kuroda aim to change that, but again, the big question remains 'what for'? Before their interventions began to destroy the yen's external value, the real growth of Japan's economy when measured in currencies other than the yen (such as the USD, for example) was actually quite brisk. It should be obvious that Japan has not exactly become a poorhouse over the past 15 years. Its corporations and citizens inter alia remain the world's largest foreign investors, a position they are also likely to lose as a result of the Abe 'cure', which has led to a growing trade deficit and for the first time in ages also to a current account deficit last year.

japan-consumer-price-index-cpi

Japan's CPI – the mild decline in prices since the late 90s – which is actually better described as 'more or less stable prices' – has been a boon for Japan's consumers - click to enlarge.

japan-balance-of-trade

Under 'Abenomics', the trade balance has fallen into a steadily worsening deficit – click to enlarge.

There is of course nothing inherently 'bad' about a trade or current account deficit. However, Japanese governments have for years listened to the pernicious advice of Western Keynesians and have driven the country's public debt to such an egregious level, that the only reason it has not blown up yet in a spectacular crisis is the fact that it was possible to finance it entirely from domestic sources. This will soon no longer be the case if the current account deficit lodged last year becomes a permanent feature. It should be noted though that the shutdown of Japan's nuclear plants after the 2011 tsunami has contributed greatly to the trade deficit. A gradual reopening of the plants would help stem the new trend (but there are signs that many plants will actually remain closed).

The Lunatics Have Taken Over the Asylum

Here is more from the Bloomberg article, proving how utterly boneheaded today's central bankers actually are. Not only that, Japan's government is apparently introducing price controls that work in the opposite direction from that normally pursued by governmentsit wants to make sure the price increases resulting from the higher sales tax are fully passed on to consumers. It simply does not get any crazier than this:

“Tadashi Yanai, the billionaire president of clothing retailer Fast Retailing Co., said April 10 that he's not optimistic about the outlook for consumption, ahead of a plunge in his company's shares that contributed to this year's 13 percent slide in the Topix index.

Accelerated inflation would squeeze households, with wages excluding overtime and bonuses declining in February for a 21st straight month, down 0.3 percent from a year earlier, according to April 1 labor ministry data.

Saito, ranked No. 3 forecaster last year, sees the risk of a 3.6 percent increase in the April consumer price gauge, which excludes fresh food, after a 1.3 percent gain in February.

A consumer confidence gauge fell for a third straight month in February to 38.3, down from a six-year high of 45.7 last May and the lowest since September 2011, according to a Cabinet Office survey. "Consumer sentiment has been undermined to a large extent by rising prices," wrote Goldman Sachs Group Inc. economists Naohiko Baba and Yuriko Tanaka in an April 12 note, predicting "a major retreat in sentiment from April as the tax hike drives inflation."

[…]

Doutor Coffee Co. said on Feb. 28 it will raise coffee prices by 10 percent from April 1, citing increasing costs of materials and labor. Suntory said March 3 it will increase the price of drinks at vending machines by 8 percent on April 1. Barber shop franchise QB Net Co. raised the price of a hair cut by 8 percent this month.

Companies tend to change their prices in April — when Japan's fiscal year begins — and in October, the start of the second half, Shinke said.

The government is trying to ensure businesses pass the burden of the higher sales tax on to customers. The Ministry of Economy, Trade and Industry dispatched 474 inspectors to check companies' handling of the levy and had ordered 1,199 cases of wrongdoing to be corrected as of the end of March, it said in a statement on April 7.

Many businesses likely weren't able to fully pass on higher material and operations costs when Japan's economy was stagnating and are now seizing the sales-tax bump as a chance to act, with some likely also looking to claw back costs of wage increases, Shinke said. The Consumer Affairs Agency said it received 442 phone calls between April 1 to 7 from people expressing concerns price increases.

In a Feb. 27 speech in New York, the BOJ's Shirai said it was "striking" that most of the public viewed price rises as unfavorable, with survey results implying that the importance of the central bank's target of stable 2 percent inflation "may not be widely understood and shared by households." Shirai said it was vital to explain the people "how this will improve lives in the medium to long term."

(emphasis added)

One is not sure if this is supposed to be some kind of ongoing Japanese in-joke or if they are really serious. Any Japanese citizen who feels like grabbing something and throwing it at Mr. Shirai (a shoe perhaps?), has our full understanding and sympathy.

Conclusion:

Only central bankers, their economic advisers and various other minions of the state can possibly fail to recognize what a catastrophe 'Abenomics' is shaping up to be. Given how glaringly obvious its drawbacks are, one must wonder what it is actually supposed to achieve. A futile attempt to reduce the real value of the government's debt on the back of Japan's citizens is the only possibility that suggests itself.

However, a reduction of the public debt should ideally be achieved by government spending cuts. Even an outright default would be preferable to monetary debasement, which in the end is just a default by another name – with the added problem that it will set all the pernicious effects into motion in the economy which monetary inflation invariably tends to bring about.

See the original article >>

Follow Us